Post-Thanksgiving Market Rebound? Bank of America: Likely Short-Term; Major Rally Requires These Three Conditions
Author: Bu Shuqing, Wallstreetcn
Bank of America Chief Investment Strategist Michael Hartnett provided his outlook in the latest episode of The Flow Show: US stocks are highly likely to experience a technical rebound after Thanksgiving, but this is merely a short-term respite. To evolve into a major trend, the market needs to see three conditions met simultaneously: the 10-year U.S. Treasury yield breaking below 4.5%, WTI crude oil falling below $70 per barrel, and the U.S. dollar confirming its top following weak employment and inflation data.
The direct trigger for this rebound expectation is that market breadth has deteriorated to extreme levels. According to BofA's Global Breadth Rule, as of November 18, a net 68% of global equity indices are in an oversold state, having fallen below both their 50-day and 200-day moving averages. Under this rule, when a net 88% of the market becomes oversold, it constitutes a major contrarian buy signal for risk assets. Hartnett stated that this threshold is likely to be triggered in the coming days, providing short-term relief to oversold stocks after Thanksgiving.
The market has indeed been sold off thoroughly. According to BofA data, year-to-date, crude oil has risen 44.9% and the US Dollar Index has climbed 5.7%, whereas US equities are up only 4.8%, global equities 4.4%, cash 3.3%, high-yield bonds down 1.2%, investment-grade bonds down 3.0%, government bonds down 3.9%, gold down 15.1%, and bitcoin down 29.5%. Over the same period, the Nasdaq has pulled back 15% from its peak, bank stocks have fallen 16%, and crude oil has declined 22% from its highs. 30-year U.S. Treasuries are heading toward a sixth consecutive year of negative total return, marking the longest streak since the Vietnam War era of 1963 to 1969.
However, BofA warns that selling at the price level does not equate to selling at the position level. Global equity funds still saw inflows of $66.6 billion last week, with U.S. growth funds receiving $9.1 billion, marking the largest single-week inflow since December 2024; the cash level in the November Fund Manager Survey stood at just 3.6%, placing it in the sell zone, with asset allocators broadly long equities and short bonds. In BofA's view, this indicates that more deleveraging at the position level is needed before a blanket buy signal can be given to risk assets.
Breadth Rules Approach Thresholds, But Only Offer Short-Term Relief
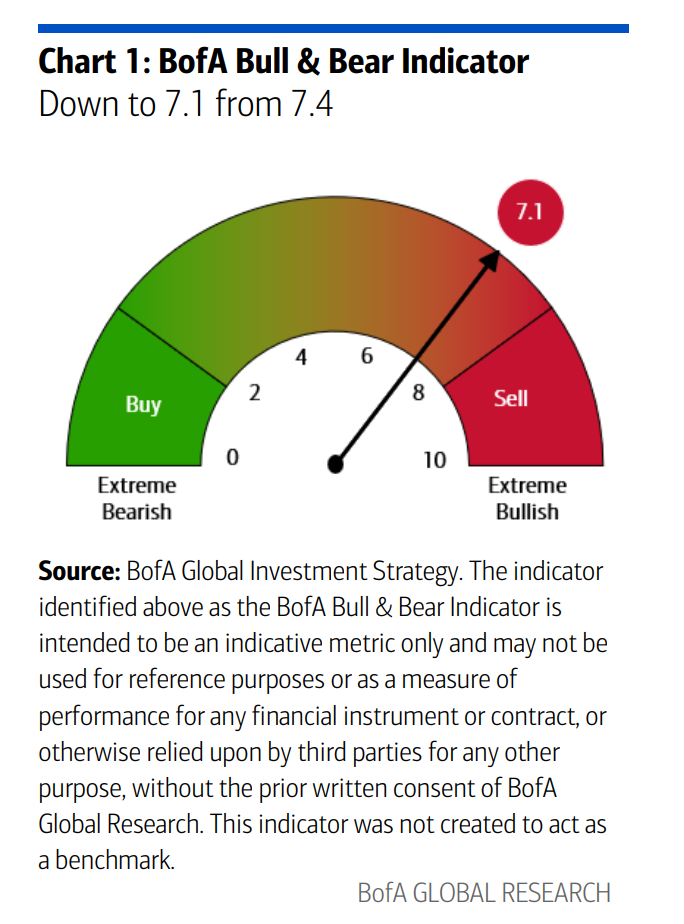
The BofA Bull/Bear Gauge has dropped from 7.4 to 7.1, issuing a neutral signal.
In detail, hedge fund positioning sits at the 56% neutral percentile, while equity fund flows are at a heavily bullish 99% percentile, and Fund Manager Survey positioning is at a heavily bullish 100% percentile. Conversely, global equity breadth stands at only 18%, in the heavily bearish percentile. Large outflows from emerging market debt and high-yield bonds, weakening credit technicals (widening spreads between high-yield bonds and subordinated bank bonds), deteriorating equity breadth, and shifts in futures positioning to short collectively dragged down this reading. The legacy Bull/Bear Gauge currently stands at 6.2.
BofA's Global Cash Flow Rule currently reads 1.1%, also signaling neutrality. This rule triggers a buy signal when global equity and high-yield bond outflows exceed 1% of assets over four weeks, and a sell signal when inflows exceed 1%.
The report explicitly states that the triggering of the breadth rule brings short-term relief to oversold stocks post-Thanksgiving, rather than a trend reversal. A true major market rally requires the simultaneous realization of the three macroeconomic conditions outlined below.
The Three Conditions: Yields, Oil Prices, and the Dollar
The first condition is the 10-year U.S. Treasury yield breaking below 4.5%. BofA believes the greatest threat to risk assets today is not yield declines driven by recession fears, but rising yields, due to excessively high debt levels. The price of 30-year U.S. Treasuries has already fallen 62% from its peak to trough, and the current 30-year yield is only 25 basis points away from its recent high.
The second condition is WTI crude oil falling below $70 per barrel. Elevated oil prices were the core of this year's best trade, long oil and short crypto, and remain a key variable suppressing consumption and inflation expectations.
The third condition is the dollar peaking, which must be predicated on weak employment and inflation data. BofA refers to the dollar as a wrecking ball, considering a dollar peak, along with bottoms in bitcoin, gold, and the KOSPI, as the best indicators to measure whether rate hike concerns have peaked, since these four asset classes are the first casualties that smell a rate-hiking cycle earliest.
A Two-Question Market: When Will Rate Hikes Stop, and Before Recession?
Hartnett characterizes the market heading into 2027 as a two-question market: When will the rate-hiking cycle end, and will it end before a recession?
The backdrop he provides is that there are 71 scheduled rate hikes globally between June 2026 and May 2027. Coupled with excessively bullish sentiment, this continues to pressure risk assets. If the Fed remains Wall Street's friend and views equities as too big to fail, then the selloff in credit and equities itself could short-circuit the hiking cycle. The specific thresholds would be an IG CDX spread breaking above 80 basis points, or the S&P 500 falling below 6,845 points, erasing the year's gains.
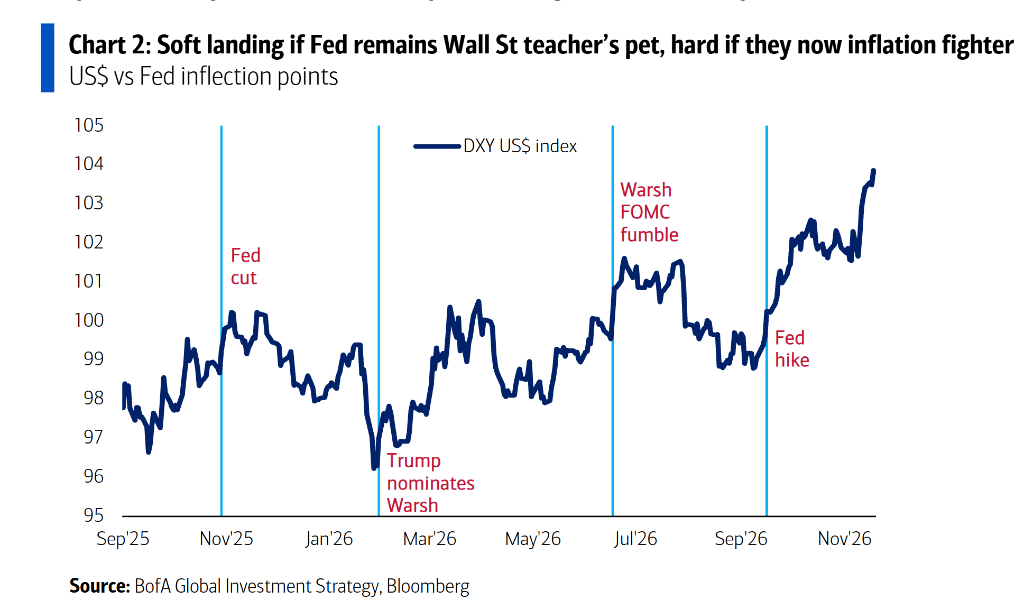
However, following the midterm elections, voters demand affordability. If the Fed pivots to playing the inflation hawk, investors won't start pricing in the end of the tightening cycle until the March 18 or April 28 FOMC meetings at the earliest, increasing hard landing risks. BofA's timeline notes: October 29 last year, a dovish Fed rate cut aligned with Bitcoin's peak; January 30 this year, Trump's nomination of Warsh coincided with gold's peak; June 17, a mistake at a dovish FOMC meeting chaired by Warsh matched peaks in the PHLX Semiconductor Index and KOSPI; and September 16, a hawkish Fed rate hike corresponded with copper price peaks, low IG spreads, and a soaring dollar.
Hard Landing Risk Underestimated: Both Wealth Effect and AI Capex Slowing
BofA's divergence from market consensus centers here: the probability of a hard landing is underestimated, while boom expectations are overly optimistic. Current consensus forecasts 2027 nominal GDP growth of 5% to 6% and earnings per share growth exceeding 15%, figures BofA considers overstated.
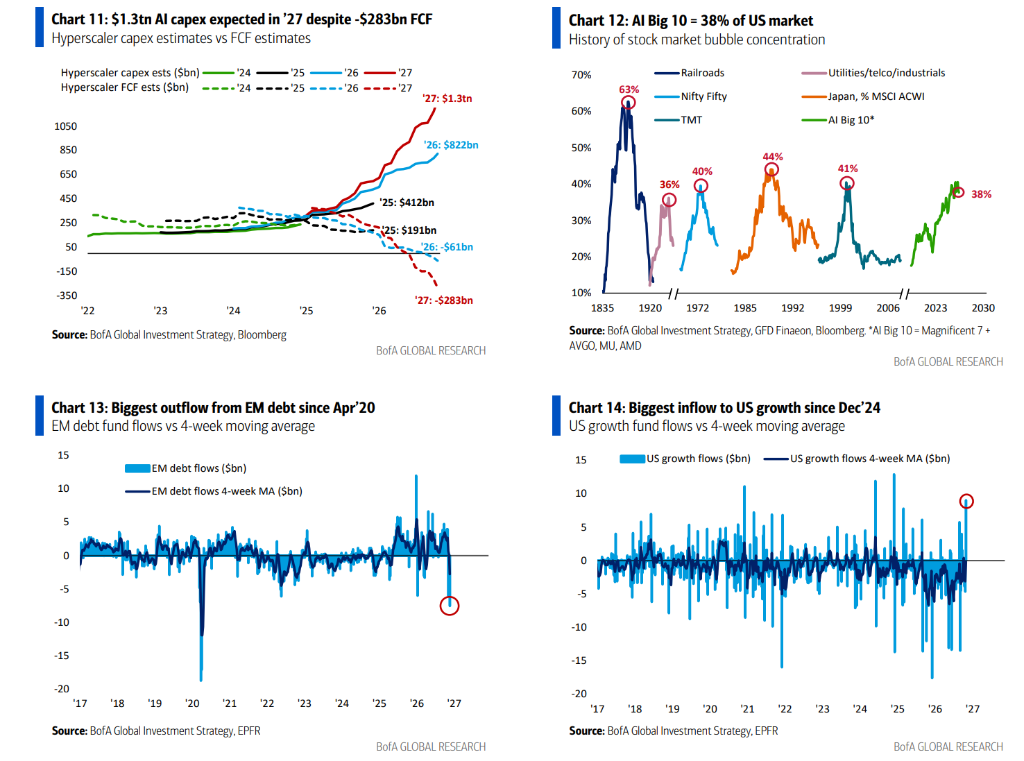
The two engines supporting U.S. nominal GDP and EPS are weakening. First is household stock wealth, which has shrunk by approximately $5 trillion so far this quarter, despite adding roughly $8 trillion for all of 2026. Second is AI capital expenditure, where hyperscale cloud vendors' 2027 capex estimates reach $1.3 trillion, against free cash flow of negative $283 billion. BofA states that voters, bond markets, and asset allocators are all saying slow down AI data center construction.
Regarding recession leading indicators, BofA places the highest emphasis on initial jobless claims and credit spreads: once initial claims break above 250,000 and IG spreads exceed 100 basis points, it signals a shift from a prosperity loop to a doom loop, forcing asset allocators to reduce equity exposure and increase allocations to bonds, the dollar, and AI-negative assets such as REITs and real estate. This means long apartments and short chips, reversing the long-term theme established since the 2020s.
This pivot implies trading against the four major themes of recent years: including ABB (Anything but Bonds, buying everything except bonds, catalysted by debt and deficits, with 30-year Treasuries seeing a peak-to-trough price return of -62%), ABD (Anything but the Dollar, holding everything except the dollar, catalysted by devaluation fears, with annualized gains of 44% and 23% for bitcoin and gold prior to their peaks in October and January, respectively), and AI (a full-blown bet on artificial intelligence, catalysted by disruption, adding $26 trillion to Nasdaq's market cap since March 2023, with the top ten AI-weighted stocks comprising 38% of the S&P 500).
Funds Continue to Flow into Equities as Bonds and Gold Bleed
Over the past week, global equity funds saw inflows of $66.6 billion (ETFs inflowed $73.5 billion, mutual funds outflowed $6.8 billion), cash inflowed $400 million, gold inflowed $200 million, cryptocurrency outflowed $1.1 billion, and bonds outflowed $7.4 billion, marking the first instance since April 2025.
In detail, emerging market debt outflowed $7.5 billion, the largest since April 2020; investment-grade bonds outflowed $700 million, the first time in two months; TIPS outflowed $22 million, the first time since January 2026; European equities inflowed $1.5 billion, the largest since February 2026; Japanese equities outflowed $4.2 billion, the largest since May 2026; U.S. growth funds inflowed $9.1 billion, the largest since December 2024; and technology funds inflowed $5.4 billion, marking a consecutive eighth weekly inflow.
With $4.6 trillion in Assets Under Management for private clients, portfolio allocation stands at 65.7% equities, 17.7% bonds, and 9.4% cash, continuing to add to equity positions: equity ETF shares have increased 1.1% over the past four weeks and 9.5% year-to-date. Over the past month, private clients purchased bank loan, TIPS, and high-yield bond ETFs while selling utilities, consumer discretionary, and energy ETFs.
For all of 2026, annualized inflows into global equity funds set a record of $1.5 trillion, global bond inflows reached $909 billion, U.S. equities $751 billion, U.S. large-cap equity funds $669 billion, investment-grade bonds $443 billion, U.S. Treasuries $243 billion, technology funds $229 billion, and Korean equities $79 billion; consumer-focused funds recorded a record outflow of $20 billion.
In the November Fund Manager Survey, investor expectations for 2027 call for a global economic soft landing, lower inflation, and slowing AI capex growth; positioning favors long equities, commodities, emerging markets, healthcare, and industrial sectors, while remaining short cash, bonds, REITs, consumer discretionary, and energy. They view international equities (36%) and U.S. equities (24%) as the top-performing asset classes, the Nasdaq (21%) and MSCI Emerging Markets (21%) as the strongest equity indices, and the Japanese yen (42%) as the best currency. For year-end 2027 target prices, the survey median points to a 10-year Treasury yield of 4.9%, EUR/USD at 1.12, S&P 500 at 7,926, and gold at $4,341/oz.
BofA's stance on this is to wait. If a soft landing materializes—meaning lower inflation, stable employment, and visible productivity gains become apparent next spring, with EPS growth maintaining above 10%—then valuations of 16x for the S&P 500 Equal Weight Index, 15x for mid-cap stocks, and 12x for MSCI ACWI ex-US do not appear frightening. At that point, one simply needs to wait for the narrative to flip from rate hikes to rate cuts, then buy cyclical C-starting assets: cryptocurrencies, chips, copper, consumer goods, and apartments. Until then, preserve principal and wait for fear to surface more clearly.