Stablecoin Economics: In 2026, Who Really Profits from Digital Dollar Flows?
Author: insights4vc
Translated by: TechFlow
TechFlow Summary:In the first three quarters of 2026, the global gross on-chain transaction volume of stablecoins approached $98 trillion. Yet, after filtering out internal hedging and automated routing, the actual volume serving commercial payments remained under $482 billion. Concurrently, despite ostensibly substantial reserve interest income, issuers are compelled to cede more than half of these profits to dominant distribution channels such as Coinbase. This report provides an in-depth dissection of the competitive dynamics across every segment of the stablecoin value chain, arguing that on-chain transfer volumes alone cannot support high valuations. Ultimately, only entities capable of controlling low-cost fiat settlement rails, compliant on-and-off-ramp networks, and high-retention merchant ecosystems will capture genuine profits amid interest rate cuts and intensifying spread wars.

The stablecoin market is facilitating larger capital flows, yet the total capital locked within the ecosystem has not seen significant growth.
As of late September 2026, the total circulating supply of stablecoins reached $304.9 billion, marking only a marginal 0.4% increase compared to December last year. However, according to data analytics firm Allium, stablecoin transfers classified under payment attributes during the first nine months of this year totaled a staggering $482 billion, representing a substantial 45.4% year-over-year increase. While overall capital stock remained largely stagnant, the estimated usage scale in actual payment scenarios achieved a substantive leap. [1]
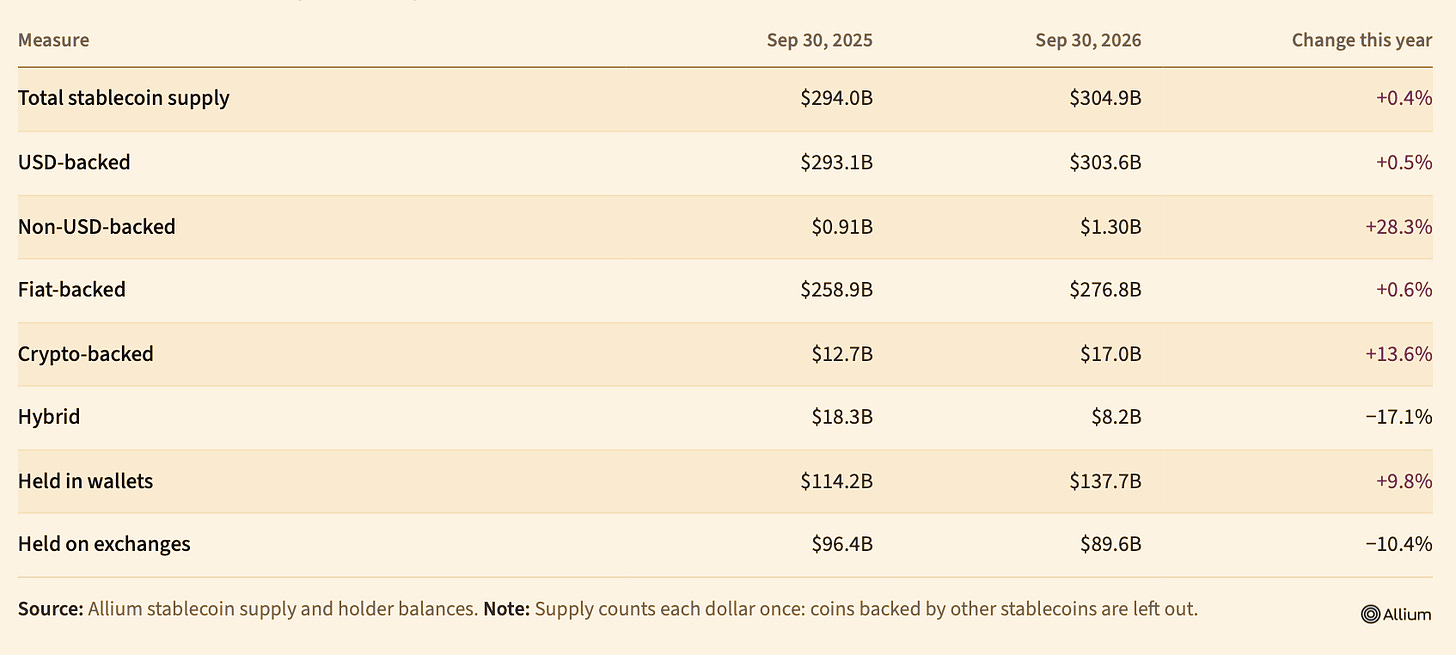
Figure 1: Core Stablecoin Metrics: Stock Balances and Market Capitalization Distribution
For investors, this raises a deeper question than “how large can the stablecoin market ultimately become”: As digital dollars continue to circulate, who is actually capturing real economic value?
Consider this scenario: A client receives salary compensation in stablecoins, holds the balance in a payroll application, and eventually spends it via a bank card swipe. Along this chain, the stablecoin issuer earns interest income backed by its reserve assets; the payroll app manages the end-customer relationship; and the payment processor handles currency conversion and clearing/settlement. Multiple institutions participate in the same transaction, yet their underlying economic models and profitability profiles differ drastically. The issuer with the largest supply scale does not necessarily emerge as the biggest winner in capturing commercial value.
However, behind these gleaming growth figures lies a blind spot. The $482 billion payment total estimated by Allium is derived from modeling wallet tag classifications and on-chain transaction behavior patterns, rather than being verified against actual invoices or merchant receipts. Although its methodology filters out significant automated arbitrage and bot-driven operations, it still cannot definitively prove the true commercial intent behind every on-chain transfer. Recognizing this fundamental distinction is crucial, especially when numerous startups leverage on-chain transaction volumes to justify inflated valuations or claim rapidly expanding market shares in the global payments landscape. [1–3]
Examining the underlying economic models is far more compelling than fixating solely on transaction scales. Issuers generate returns based on reserve balances and macroeconomic interest rates; distribution channel partners negotiate with issuers to split this interest income leveraging their customer acquisition advantages; and payment clearing houses charge tolls for services like fund circulation, currency conversion, and banking infrastructure connectivity. The same digital dollar can repeatedly generate revenue across different business layers, which easily leads to overestimations when assessing the industry’s aggregate profit pool.
Moreover, the most commercially valuable segments of the payment workflow often lie entirely outside the blockchain on-chain transfer itself. Seamless integration into local banking settlement rails, provision of robust fiat foreign exchange conversions, accurate reconciliation, compliance with stringent regulatory requirements, and efficient processing of refund workflows for failed transactions constitute the core moats that are difficult to replicate.
This research report aims to thoroughly dissect the actual flow of stablecoin profits, analyze which institutions wield strong bargaining power to retain earnings, and evaluate whether various stakeholders’ profitability can withstand future interest rate cuts, margin compression, and escalating market competition.
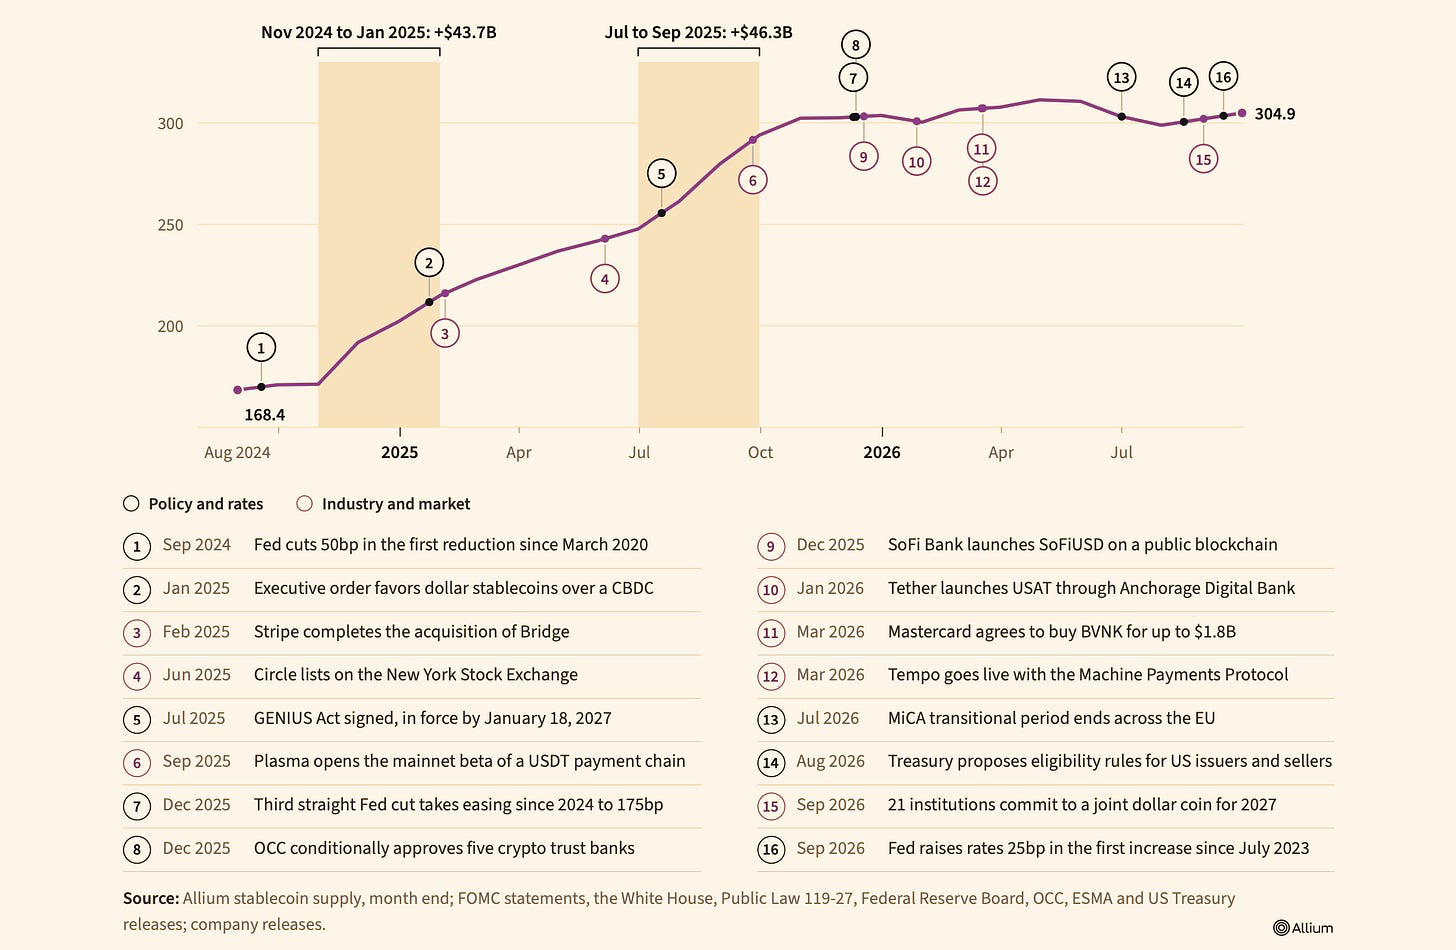
Figure 2: Schematic of Stablecoin Value Chain Segments and Revenue Distribution
Piercing the $98 Trillion Illusion: How Large Is the Real Payments Market?
Blockchain can faithfully record token transfer ledgers with high fidelity, yet rarely attaches direct proof of underlying commercial fulfillment. From an on-chain event perspective, a genuine purchase payment to a supplier looks almost identical to an internal position adjustment among market makers. Automated routing mechanisms in smart contracts can multiply recorded transactions, whereas net settlement mechanisms may compress multiple actual procurements into a single on-chain transfer. In all debates surrounding the commercial adoption of stablecoins, this fundamental discrepancy directly dictates the accuracy of the denominator used in calculations.
According to Allium’s report, the gross on-chain transfer volume for global stablecoins during the first nine months of 2026 reached a staggering $97.9 trillion. Of this, Allium attributes $59.3 trillion to underlying infrastructure interactions and $36.2 trillion to liquidity shuffling between centralized and decentralized exchanges. After deducting these, only approximately $2.4 trillion of adjusted real activity remains. It then further defines $482 billion—accounting for roughly one-fifth of the adjusted total and less than 0.5% of the original figure—as actual payment activity. Each step in this analytical pipeline functions as a funnel-based data filter. This $482 billion represents merely a model estimate based on Allium’s monitored assets, entity recognition, and classification rules, rather than an independent audit sum of globally settled commercial obligations. [1]
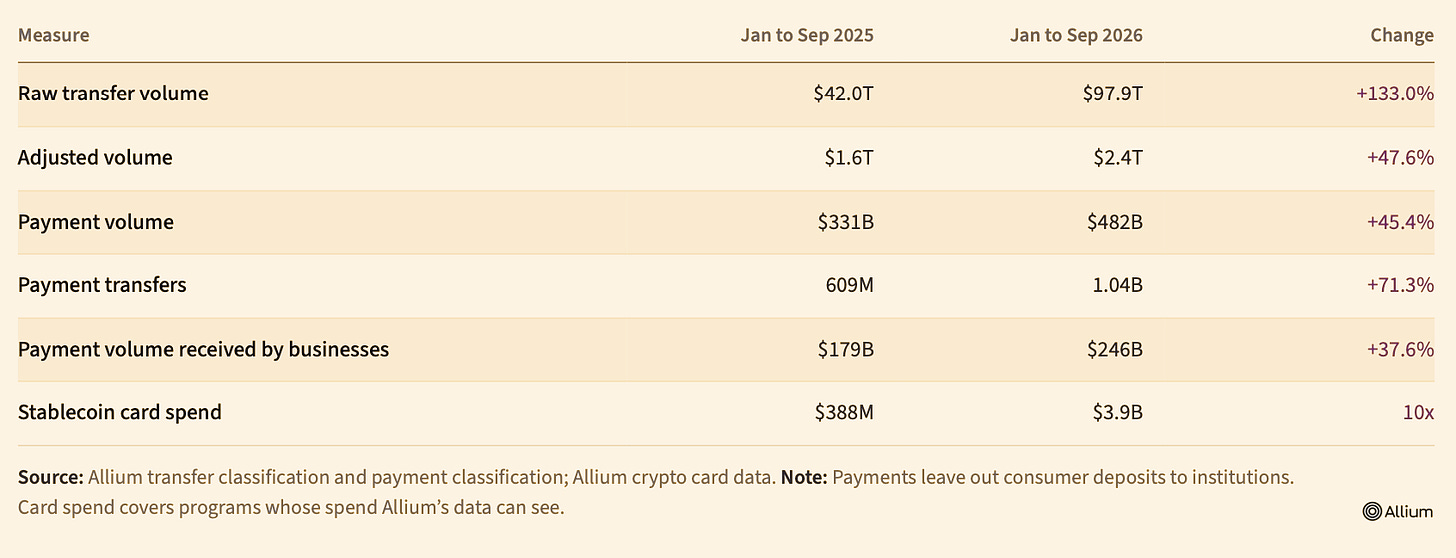
Figure 3: Stablecoin Transaction Activity and Fund Flow Distribution Across Different Scenarios
While this funnel-based filtering undoubtedly represents a major advancement over crude native on-chain transfer statistics, its precision remains fraught with uncertainties. Allium combines proprietary address tagging, wallet categorization logic, and behavioral rules, using the first matching classification as the final arbiter. However, transfers between two identified corporate entities could either be settling a commercial invoice, rebalancing internal treasury accounts, or moving funds between affiliated parties. Allium has not yet published an amount-weighted error research report capable of measuring the false positive and false negative rates within this $482 billion payment sequence.
A working paper from the Bank for International Settlements (BIS) brings this issue into sharper focus. Researchers extensively analyzed 593 million stablecoin transfer events across 141 million transactions on the Ethereum network, discovering that nearly 60% of transfer events were nested within complex multi-step transaction calls. The sample was derived from three USD-pegged stablecoins operating on Ethereum in 2025. It powerfully exposes the severe fallacy of equating on-chain interaction events directly with independent payment actions. However, due to differing coverage dimensions, it cannot serve as a direct correction factor for adjusting Allium’s macroeconomic dataset. [2]
A second layer of complexity arises when conducting cross-period historical data comparisons. On September 18, 2026, Visa updated the classification methodology for its on-chain data dashboard, dramatically expanding its tagged address library from approximately 15 million to 600 million and incorporating heuristic routing algorithms. This update successfully identified and filtered out additional automated machine interactions. Since Visa’s dashboard directly ingests Allium’s underlying data inputs, the alignment between the two firms’ metrics cannot function as independent cross-validation. Any rigorous growth calculation must be built upon unified and continuous underlying tagging and exclusion rules. [3]
Two Issuers Dominate an Increasingly Crowded Market
As of the end of September, Allium data shows Tether’s circulating supply at $184 billion and Circle’s at $85.6 billion, together commanding 88.5% of the total market share. Ranked third is Sky’s USDS at $8.2 billion, followed closely by PayPal’s PYUSD at $3.2 billion. Other issuers collectively hold $23.9 billion. The total circulating supply of all tracked assets stands at $304.9 billion, up slightly from $303.7 billion in December 2025. [1]
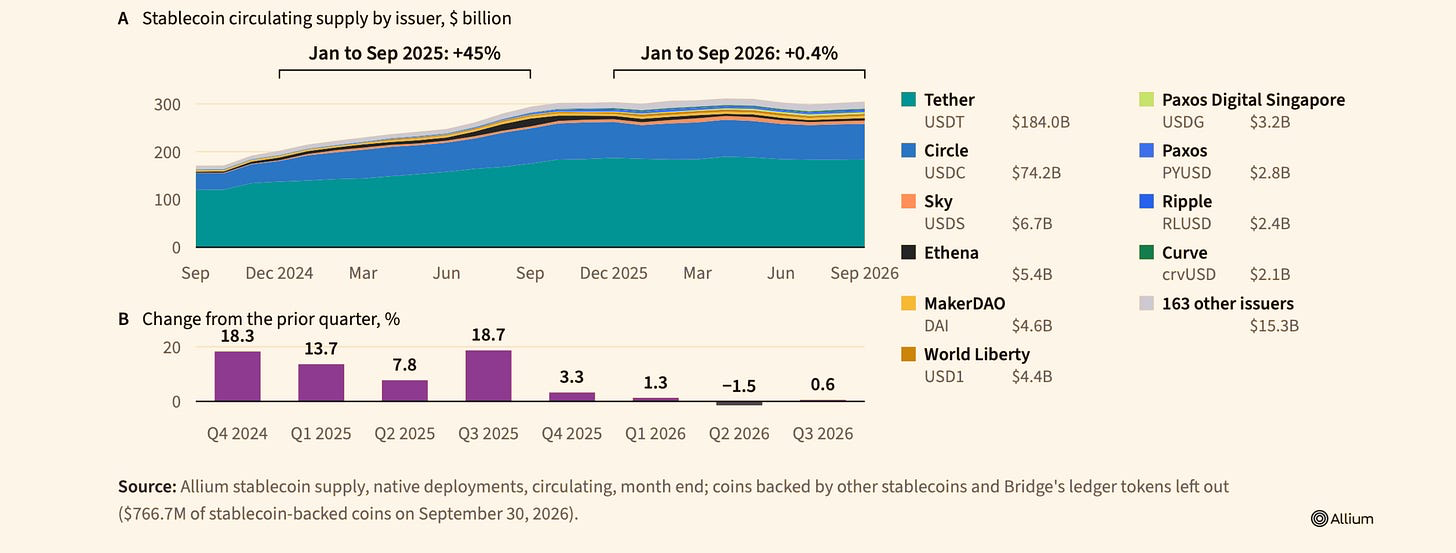
Figure 4: Share of Stablecoin Circulating Supply by Issuer
Beneath the seemingly calm overall stock, the $11.4 billion in incremental gains captured by emerging expansionist issuers is nearly offset by the $10.2 billion drained from incumbent sectors. A wave of new entrants like USDG, RLUSD, and USD1 rapidly absorbed balance holdings, often at the expense of siphoning funds from legacy tokens. Relying solely on macro-level issuance data makes it difficult to determine how much of this shift reflects genuine new demand from external clients versus mere treasury rebalancing, short-term subsidy incentives, or internal churning between two USD-pegged tokens. Billions in newly issued supply sometimes merely represent repackaged legacy dollar assets with a fresh token facade. [1]
Furthermore, not all co-branded tokens can simply be aggregated with their underlying collateral assets. Some enterprise partnership stablecoins directly utilize existing market stablecoins as reserve collateral. Counting both wrapped tokens and base tokens simultaneously would create an illusion of artificial market growth. Allium excludes such wrapping structures from its supply metrics, yet its report presents two contradictory figures for the September exclusion amount: $766.7 million in the issuers section versus $872 million in the branded tokens section. This discrepancy likely stems from differences in statistical scope or accounting classification, which the original report does not reconcile. Therefore, we adhere to the publicly available consolidated data and strictly avoid double-counting wrapped assets. [1]
Low-frequency circulating dormant balances warrant particularly close attention. A digital dollar may quietly sit idle in an exchange account serving as derivative margin collateral, act as a safe-haven savings vehicle for households in remote regions, or continuously earn interest as part of a broader asset reserve portfolio. An issuer’s annual net profit depends more directly on the aggregate size and duration of these capital deposits rather than weekly on-chain transfer frequencies. The commercial value differs drastically between a retail user voluntarily choosing to hold tokens long-term for six months and a channel partner momentarily hoarding inventory ahead of a promotional campaign.
Tether’s lead dominance is particularly stark in the payments sector. Within Allium’s classification framework, USDT accounted for $406 billion in payment volume from January to September, commanding an overwhelming 84.2% share. This concentration ratio even far exceeds its advantage in total circulating supply. It fully validates the deep moat forged by robust liquidity, established counterparty networks, and entrenched user habits. However, this does not directly translate to how much clearance fee revenue Tether actually captures. The token issuer, the underlying public blockchain host, and the fiat-onramp merchants converting stablecoins into local currency operate as entirely distinct commercial entities. [1]
Reserve Interest Income After Distributor Commissions
For traditional fiat-reserve stablecoins, the starting point for profitability calculations is the daily average balance of compliant reserve assets multiplied by their realized yield. Subsequently, distribution commissions paid to channel partners and other service providers, along with the company’s own operational overhead, must be deducted. Inferring profits solely from period-end token supply is highly inaccurate, especially during periods of benchmark rate volatility or structural adjustments in channel revenue-sharing agreements. A mere one percentage point (100 basis points) drop in reserve yield capacity could completely obliterate the modest profits generated by several quarters of steady growth in payment volume.
Circle’s financial statements reveal this commission-sharing dynamic with rare transparency. In Q2 2026, Circle reported $667.7 million in reserve interest income and $33.6 million in other operating income, bringing total revenue to $701.3 million. Concurrently, it incurred $412.5 million in costs related to channel distribution, transaction processing, and other associated expenses. The remaining $288.8 million merely represents Revenue Less Direct Channel Costs (RLDC), yielding a pre-operating-expense margin of approximately 41.2%, far from net profit. Most astonishingly, out of the quarter’s $412.5 million in distribution costs, channel sharing paid exclusively to Coinbase amounted to roughly $324.6 million. This fact exposes a brutal commercial reality: even when issuers manage colossal reserve pools, the majority of the resulting interest income ultimately funnels to distribution channel giants possessing direct access to real customers and deposit bases. [4]
This profit-allocation mechanism is logically sound in commerce. Distributors that deliver genuine customer bases and sustained deposit inflows wield immense bargaining power. For issuers, paying channel fees is often more cost-effective than building consumer-facing wallets, developing payment platforms, and navigating complex regulatory licensing across multiple jurisdictions from scratch. Nevertheless, distributors can switch underlying suppliers or even enter the fray themselves to launch independent tokens. Consequently, an issuer’s true moat hinges entirely on substitution friction costs, migration difficulty, the depth of its own liquidity network, market-recognized underlying security, and brand equity.
We can grasp these microeconomic shifts through a simplified sensitivity model: assuming a daily average reserve of $1 billion and a 3% realized annual yield, gross pre-cost interest income stands at $30 million. If the issuer retains half after revenue sharing, $15 million remains before covering internal overhead. With total capital and split ratios held constant, a mere 1 percentage point drop in realized yield causes retained earnings to plummet by $5 million; increasing distributor cut requirements by 10 percentage points would shrink retained income by another $3 million. These figures serve only as basic arithmetic simulation models and do not reflect confidential contractual terms for any specific enterprise.
Tether adopts a vastly different disclosure posture. In its reserve attestation report audited by BDO, Tether disclosed approximately $1.5 billion in operating net profit for Q2 2026 alongside a $4.11 billion excess reserve buffer. Earlier this August, Tether officially announced that KPMG had issued an unqualified audit opinion on the 2025 financial statements for its subsidiary Tether International. Notably, annual financial statement audits cannot be conflated with routine quarterly reserve attestations; our team did not independently verify the signed audit documents during preparation. Furthermore, the long-held narrative that “Tether has never undergone formal financial auditing” is evidently outdated without acknowledging this recent announcement. Due to varying disclosure standards and accounting scopes, Tether’s data cannot be directly benchmarked against the quarterly filings submitted by the publicly traded Circle. [5–6]
Distribution Agreements Determine Who Retains Spread Profits
Most contemporary commercial battles are fought within familiar software ecosystems. Wallet applications dictate default USD token recommendations, exchanges steer liquidity depth for core trading pairs, and corporate treasury platforms deeply integrate specific tokens into underlying payment flows. It is precisely these front-end business decisions that ultimately determine which issuer’s reserves continue to expand and which asset retail users firmly adopt.
The Global Dollar Network engineered an ecosystem partner revenue-sharing incentive model based on USDG minting, custodianship, and merchant acceptance activity. Open USD (OUSD) illustrates a different collaborative model: Open Standard handles product conception and standard formulation, Bridge acts as the regulated issuer, and Stripe comprehensively embeds OUSD into its global payments and financial infrastructure matrix. Qualified Open Standard partners receive corresponding rewards proportional to their OUSD business contributions. Stripe co-founded the standard as a founding member rather than holding exclusive ownership. These diverse cooperative frameworks unequivocally demonstrate that giants controlling distribution channels possess immense pricing power over revenue splits, though public documentation does not allow outsiders to accurately calculate each partner’s actual retained margins and precise distribution breakdowns. [7–8]
Co-branded product partnerships introduce another layer of accounting complexity. A platform might externally market a USD-pegged product under its own brand, yet in reality, a separate regulated licensed entity backs the underlying liabilities, manages reserve asset investments, and processes fund redemptions. Merely looking at the external product name reveals nothing about the intricate contractual rights and obligations beneath. When analyzing token supply, researchers must pierce through superficial packaging to view underlying collateral assets directly; when dissecting actual profitability, one must traverse contract texts to trace the authentic flow of investment interest, channel rebates, and service fees.
Vertical business integration improves the ecological positioning of operating institutions, but mere equity acquisition absolutely guarantees neither high profit margins nor immediate success. Mastercard announced the completion of its wholly-owned acquisition of stablecoin infrastructure provider BVNK in August. The strategic intent lies in bridging cross-border orchestration capabilities between traditional card payment clearing networks and digital asset circulation. However, this announcement merely marks transaction closure; it does not equate to instantaneous cost advantages, successful integration, or guaranteed incremental revenue. Concurrently, Stripe’s acquisition of Bridge enables it to seamlessly stitch underlying issuance facilities with a product matrix serving millions of global merchants and developers. Whether such hardware-software integration can defend premium pricing ultimately hinges on absolute service reliability and the tangible value added to corporate client workflows. [8–9]
Enterprise Payments: Limited Validation Under High Valuations
During the first nine months of 2026, Allium attributed a categorized payment total of up to $134 billion to business-to-business (B2B) transfers, representing roughly 28% of the total classified payment scale. Consumer-to-business (C2B) contributed $16.7 billion (34.7%), business-to-consumer (B2C) accounted for $12.8 billion (26.6%), and person-to-person (C2C) transfers reached $5.3 billion (10.9%). These segmented ratios represent merely modeled breakdowns of the $482 billion aggregate figure and absolutely do not constitute externally audited commercial invoices or corporate payroll records. [1]
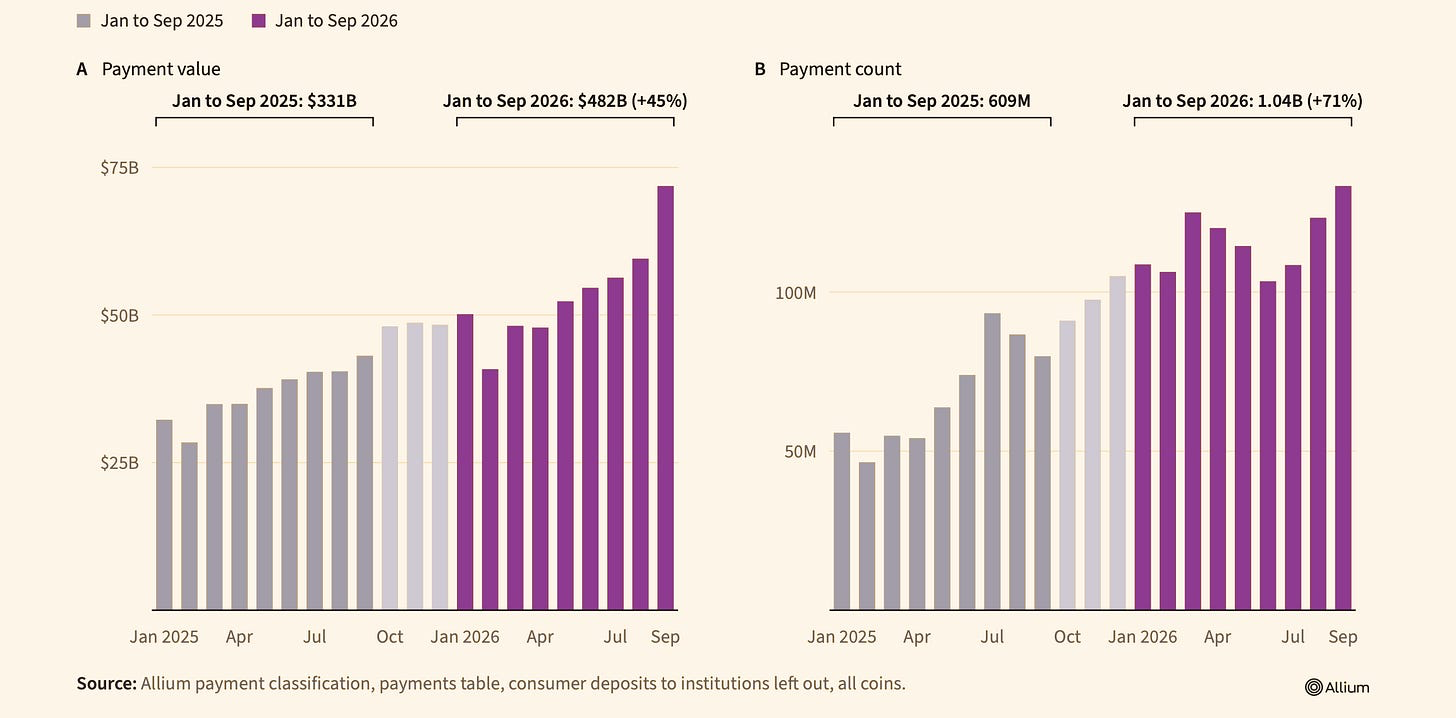
Figure 5: Trend of Monthly Stablecoin Payment Volumes and Transaction Counts
Allium also modeled the commercial purposes of various on-chain transfers: actual goods and services procurement accounted for $111.8 billion, corporate daily working capital movements totaled $116 billion, while financial operations reached a staggering $122.9 billion. Including such a high proportion of financial activities within total payment volumes aligns perfectly with prior authoritative industry research. BIS academic papers on Ethereum stablecoin transfers indicate that the vast majority of on-chain stablecoin interactions primarily support exchange trading, decentralized liquidity market-making, and cross-market hedging rather than retail terminal procurement. Market observers habitually narrow the concept of “payments” to merely “buying things”, yet within the data classification system, a substantial portion actually consists of pure financial allocations and liquidity maintenance operations. [1–2]
Short-term high-viability payment scenarios typically cluster in areas where traditional financial systems operate sluggishly, carry exorbitant fees, or face strict geopolitical restrictions. Cross-border corporate procurement settlements, multinational freelancer and remote employee payroll disbursements, digital virtual goods markets, and transnational supply chain vendor payments represent major pain points characterized by intense friction within traditional correspondent banking clearing systems. While stablecoins can significantly accelerate capital transit times and bypass predatory correspondent banking fees, they do not automatically eliminate off-chain heavy asset barriers such as fiat foreign exchange volatility risk, local cash-out acceptance losses, corporate tax invoicing reconciliation, and jurisdictional compliance reporting.
From a commercial evaluation standpoint, the most persuasive core benchmark metric is the high-frequency repeat purchase behavior driven by the same cohort of KYC-verified corporate clients. However, this critical data is scarcely ever disclosed in standard public marketing narratives. Surge in high transaction volumes fueled by short-term corporate acquisition subsidies utterly fails to reflect customer retention rates or actual unit economics. A rigorous industry analyst ought to interrogate: What exact number of corporate entities executed more than two repeat payments over consecutive three-month periods? How much net profit does a service provider genuinely extract per successfully completed merchant invoice? And what channel costs were surrendered to local banks or licensed partners to facilitate off-chain fiat withdrawals?
Hidden Payment Costs Invisible on Blockchain Ledgers
Low public blockchain network transfer fees (Gas) indeed mark a vital milestone in blockchain technology development. According to Allium’s comparative data from September this year, the median single-transfer fee on the Tron network falls under 10 cents, Ethereum hovers around $1.50, and Solana requires merely approximately 0.5 cents. The pronounced disparity in public chain fee structures reasonably explains why developers deploy extensive high-frequency automated transfers on certain networks and how small retail users vote with their feet. Nevertheless, public chain Gas fees absolutely cannot represent the comprehensive cost of a genuine commercial payment.
An enterprise procuring payment clearing services genuinely cares about how much usable capital arrives punctually and securely into the ultimate beneficiary’s account. Blockchain network Gas fees usually constitute only a trivial fraction of this comprehensive bill. The bulk of costs hide beneath fiat foreign exchange (FX) bid-ask spreads, fiat withdrawal/deposit handling charges, capital-in-transit float costs, fraud/risk management and anti-money laundering screening expenses, and enterprise-grade financial reconciliation software. Across numerous cross-border payment corridors involving emerging market local currency clearing, FX conversion costs alone can range from 50 to 200 basis points. By contrast, on-chain transfer fees account for less than 5% of the total comprehensive cost.
Taking a hypothetical $100,000 cross-border supply chain vendor procurement invoice as an example: even if the stablecoin transfer cost on Tron amounts to a mere $0.10, compared to a 0.75% fiat FX spread ($750), a $25 local bank wire fee, and two days of capital-in-transit opportunity cost, these few cents saved on-chain are practically negligible. If an infrastructure institution offers purely on-chain token transfer tracks, it sells highly commoditized bulk pipeline services. Conversely, only comprehensive solution providers capable of efficiently managing FX conversions, ensuring compliant invoice fulfillment alignment, and deploying funds promptly into vendors’ local bank accounts at highly competitive exchange rates can command substantial service premiums within this complete commercial workflow.
For multinational corporations, working capital tie-up costs often far exceed nominal payment service fees. A multinational processing massive scattered outgoing payments daily typically must pre-fund substantial position reserves with local intermediaries across numerous countries and regions. A stable and reliable stablecoin clearing link can unlock this frozen idle capital, substantially improving corporate liquidity turnover efficiency. Yet in illiquid edge emerging markets, service providers themselves must hold additional local liquidity buffers to guard against cash-out channel runs or settlement delays. Consequently, these capital cost savings must be integrated into holistic treasury management models and dynamically quantified based on genuine liquidity needs and actual transaction volumes.
Payment processors themselves face grimmer marginal calculations: assume a payment institution earns 10 basis points (0.1%) in gross service fees on $10 billion in annual qualified settlement volume, totaling $10 million in gross revenue. Various financial counterparties and variable settlement expenses consume 6 basis points ($6 million), leaving a mere $4 million in marginal contribution profit before deducting fixed corporate overhead and bad debt losses. Should vicious industry competition compress the blended take rate down to 8 basis points while underlying rigid costs persist at 6 basis points, maintaining the original $10 billion volume would slash actual contribution profit directly in half to $2 million. To preserve the initial $4 million contribution total, the institution would be forced to double its processed volume to $20 billion. This derivation model assumes constant unit costs and temporarily ignores additional operating leverage effects; it does not represent industry-fixed public rates.
Liquidity, Not Gas Fees, Dictates Network Competition Tiers
During the first nine months of 2026, the Tron network commanded approximately two-thirds of Allium’s adjusted transfer total and monopolized a staggering 66.6% share of the categorized payment volume. Ethereum remains the largest reservoir for total native stablecoin supply, while Solana and the BNB Chain carve out larger slices in specific transfer count dimensions. Each metric paints distinctly different competitive facets: supply volume represents the genesis origin of underlying assets; floating balances reveal deep-water zones of liquidity accumulation; and payment transfers depict inferred subsets of active capital circulation. None of these isolated indicators can be directly equated with terminal user satisfaction or the inherent commercial profitability of the public chain protocol itself. [1]
Tron’s hegemonic status cannot be explained solely by cheap Gas fees. The exceptionally high penetration of USDT, a globally pervasive existing acquirer network, deeply embedded mainstream exchange channels, and ingrained habitual transfer behaviors form a powerful gravitational pull driving repeated user return. An emerging public chain with lower fees remains utterly unattractive to merchants facing actual clearing demands if it lacks local fiat on-ramp and cash-out channels. Conversely, a mature public chain with higher execution fees can easily erase costly fee friction if it possesses unparalleled deep liquidity, rigorous system reliability, mature risk control frameworks, and enterprise-grade integration capabilities, thereby generating sufficient aggregate commercial value.
A recently launched batch of emerging blockchain networks exposes this divergence clearly. As of late September, Allium data shows $1.73 billion in stablecoin balances accumulated on Plasma, $831 million on Robinhood Chain, $718 million on Tempo, and $528 million on Circle’s newly launched Arc chain. In its September categorized payment statistics, Plasma recorded $168 million in payment flow, Tempo logged $24 million, while Arc and Robinhood data remain under classification verification. Missing data does not equate to zero genuine demand. Moreover, on-chain floating balances must be strictly distinguished from native issuance volumes, as substantial deposited assets frequently originate from cross-chain bridging from other mature mainnets. [1]
Early-stage paper liquidity data struggles to prove genuine user retention capability. Only after completing a full financial reporting quarter can objective measurements of daily active balances across chains, verifiable counts of actual paying customers, monthly repeat transaction frequencies per funding account, and the geographic breadth of global fiat cash-out networks truly gauge each public chain’s authentic market penetration. At the investment thesis level, analysts must construct more rigorous financial accounting models: explicitly itemizing public chain network fee captures, validator node revenues, official ecosystem subsidies, and ultimate free cash flows returning to token holders. Relying exclusively on hollow nominal settlement principal totals can never directly derive fair investment valuations for underlying tokens.
Bank Cards Connect Stablecoin Balances with Established Merchant Networks
For everyday retail consumers, the most intuitive and lowest-barrier stablecoin product is invariably a standard-looking bank debit or credit card. Customers top up spending accounts using digital dollars; offline and online merchants process transactions via accustomed card network architectures and routinely receive local fiat settlements into their accounts. The entire acceptance closed loop unfolds seamlessly atop existing acquiring institution networks. For end merchants, the underlying stablecoin circulation process remains entirely transparent and imperceptible.
Allium estimates that globally monitorable stablecoin-backed card swiping consumption reached $3.9 billion between January and September 2026, surging approximately tenfold compared to the comparable 2025 baseline in its dataset. KAST, Ether.fi, and Karta have emerged as leading card issuance programs in public monitoring. However, this aggregate figure blends disparate statistical methodologies: only roughly 19% of consumption amounts are supported by line-by-line genuine merchant procurement flows, while the vast majority rely mainly on backend clearing and settlement netting data inference. Such netting settlements often obscure the underlying actual transaction counts and average order values. Therefore, this data merely reflects performance within the monitored sample set, not a comprehensive exhaustive tally of all global stablecoin card consumption. [1]
Its granular single-transaction consumption samples correspond to radically different denominator baselines. Across key card projects comprising 36% of total consumption volume, the study captured 23.8 million independent transaction samples. Micro-payments under $50 per transaction accounted for roughly 83% of total transaction counts but represented only 17% of aggregate transaction value; conversely, high-value swipes exceeding $1,000 comprised a meager 0.7% of transaction counts yet absorbed a staggering 39% of total consumption value. These figures vividly map sample user behaviors across daily essentials versus large-ticket purchases. Yet casually extrapolating these localized patterns across the entire $3.9 billion aggregate without monetary weighting would undoubtedly fabricate artifacts of data overfitting. [1]
The commercial benefit chain behind bank cards is exceedingly complex. A card issuance program might extract swipe fee sharing, monthly account management fees, or fiat conversion spreads; simultaneously, it must pay channel costs to issuing processors, card network clearing houses, and FX liquidity counterparties, while distributing cashback rebates back to cardholders. When clients top up stablecoins, an on-chain hash record is generated; subsequent card swiping triggers a bank authorization record; and final clearing days later posts an accounting settlement entry. These three distinct watermarks objectively point to the singular real-world consumption event. Without reconciliation verification spanning procurement to settlement, blindly adding raw card business data directly onto routine on-chain payment totals inevitably invites severe double-counting risks.
Diverse Competition Surrounding Digital Dollar Yield Rights
USD stablecoins, tokenized bank deposits, and tokenized money market funds frequently share identical smart contract invocation interfaces at the blockchain layer, yet legally confer entirely distinct claim rights to holders. Stablecoin holder equity generally relies on the issuer’s redemption payout architecture and the safety qualifications of its compliant reserve assets; tokenized deposits essentially constitute direct commercial bank liabilities strictly bound by prudential banking regulations, contract limitations, and customer account accession protocols; tokenized funds represent explicit securities investment fund shares governed by specific portfolio investment directives and fund subscription/redemption statutes. These financial instruments exhibit pronounced disparities in redemption windows, on-chain transfer restrictions, interest distribution mechanics, and investor compensation protection tiers during extreme stress events. [11, 14]
When Chief Financial Officers make asset allocation decisions, their choices depend entirely on specific operational requirements regarding underlying claims: if a freely liquid, instant-settling tool with broad counterparty networks is required, public chain stablecoins boasting robust payout histories decisively take the lead; if the profile aligns with traditional mature multinational enterprises, tokenized deposits operating within existing corporate banking credit frameworks may enjoy stronger risk management approval; and if the objective targets idle liquidity seeking yield optimization, tokenized money market funds along with corresponding subscription/redemption clauses emerge as core targets. Although these financial innovations run on shared underlying tokenization technologies, they are absolutely not perfectly interchangeable homogeneous substitutes when evaluated across legal attributes, monetization liquidity, and actual risk exposures.
This multifaceted financial competition profoundly reshapes the balance sheets of modern banking systems. The underlying reserves backing stablecoins inherently typically contain commercial bank deposits and short-term US treasuries; thus, surging stablecoin issuance volumes do not imply all associated capital is completely extracted from traditional banking channels. What actually shifts is the depositor base migrating from fragmented retail citizens to concentrated institutional giants, alterations in underlying liability maturity structures, and questions regarding who ultimately partitions macro spread revenues. If retail depositors physically withdraw checking deposits to purchase stablecoins fully backed by short-term US treasuries, the shock to a bank’s liability-side lending capacity transmission path diverges sharply from investors converting idle brokerage account funds or legacy crypto tokens into stablecoins. The generalized assertion that “every newly issued stablecoin purely strips bank deposits on a 1:1 basis” is fundamentally untenable in finance.
Traditional commercial banks possess ample motivation to issue proprietary tokenized liabilities and strong mandates to provide custodial and on/off-ramp services to leading stablecoin issuers. Banks’ core moats rest on massively protected government and corporate client networks, mature treasury cash pooling capabilities, credit asset valuation and pricing authority, compliant anti-money laundering risk control hubs, and direct access to traditional central bank-grade large-value payment clearing systems. In contrast, native stablecoin tech firms wield agility advantages in open public chain distribution breadth and 7×24-hour uninterrupted operation. Neither paradigm holds absolute supremacy. Ultimately, victory hinges on the degree of on-chain permission openness, customer qualification accession thresholds, recipients’ preferred terminal settlement assets, and the aggregate comprehensive cost per transaction.
USD Reserve Demand and Cross-Border Settlement Belong to Distinct Markets
Although acquiring USD reserve assets and executing cross-border fund settlements intersect operationally, they must absolutely never be conflated in commercial analysis. In hyperinflation-ridden nations, ordinary households hold USDT primarily to hedge against catastrophic local currency depreciation risks; crypto derivatives traders maintain stablecoin positions as leveraged margin collateral on exchanges; foreign trade export enterprises receiving overseas remittances may opt for long-term retention without triggering secondary cross-border capital reallocations. Even if these tokens never execute a single retail merchant terminal consumption payment, they undeniably fulfill extraordinarily crucial economic reservoir functions.
The most geographically indicative flow data in Allium’s report originates from a sampling of self-custody non-custodial wallets where both incoming and outgoing fund endpoints successfully achieved IP geo-tagging. This subset comprises merely ~3% of the total categorized payment scale. Within this heavily constrained sample, 42% of B2B payment value, 39% of C2B consumption value, 34% of B2C disbursement value, and 22% of C2C transfer value qualify as cross-border capital movement. These figures accurately depict only locally pinpointed fragments. They cannot serve as authoritative proxies for deducing the true proportion of cross-border transactions across all global stablecoin payments. The prevalence of custodial centralized wallets, blurred geographic coordinates for certain nodes, and objective discrepancies in address tagging practices across jurisdictions could drastically skew aggregate statistical outcomes. [1]
The commercialization pathways nurtured by these two business scenarios possess intrinsic differences: overseas retail demand for USD asset savings accumulation continuously feeds issuers massive reserve interest yields regardless of low transfer frequency; conversely, penetrating cross-border correspondent banking clearing relies on achieving ultra-high-frequency capital turnover across relatively lightweight revolving pools to densely pocket payment toll fees. Public on-chain data faithfully records interaction trajectories for both activity types yet struggles to financially decouple them. An issuer securing valuation through a “reserve interest income” core narrative must endure stringent tests of long-term capital stickiness; whereas a fintech定位 as “cross-border payment clearing” must validate itself using completed customer payment fulfillment records across all clearing corridors and actual retained profit margins per transmission route.
Regulatory Frameworks Reshape Compliance Costs for Holding and Transferring Dollars
Both the United States and European Union are rapidly consolidating profoundly impactful regulatory legislative frameworks. These regulations will completely redefine who qualifies to issue stablecoins, what assets reserves can allocate toward, what derivative financial services institutions may distribute externally, and what statutory protections terminal users enjoy. The US GENIUS Act formally became law in July 2025. Comprehensive implementation of its provisions hinges on statutory timelines and supplementary rulemaking progressions, adhering to whichever occurs first: 18 months post-enactment or 120 days following publication of final implementing regulations. The legislation establishes explicit red lines concerning licensure qualifications for permitted payment stablecoin issuers, liquidity reserve asset composition, statutory redemption timeframes, and prohibitions on issuers distributing risk-free dividends directly to token holders. Regulatory proposals published by the US Office of the Comptroller of the Currency (OCC) and the Treasury Department during 2026 requesting public comment merely represent ongoing legislative consultation phases; prior to formal signing, they absolutely should not be rashly treated as finalized enacted statutes. [11–12]
Under the EU’s Markets in Crypto-Assets Regulation (MiCA) framework, Electronic Money Tokens (EMTs) and Asset Reference Tokens (ARTs) fall squarely within highly specialized and stringent administrative licensing regimes and conduct-of-business codes. In October 2026, the European Securities and Markets Authority (ESMA) further clarified overarching market supervisory expectations regarding the provision of unauthorized stablecoin-related crypto-asset services to EU residents. Regardless of how massive trading volumes some token or financial service command in other offshore markets globally, this absolutely cannot serve as justification for inferring lawful standing within specific compliant jurisdictions. Legitimate terminal customer accessibility heavily relies on concrete issuer credentials, registered domicile, intermediary licenses, and authorized operational scopes. [13–14]
Compliance acts simultaneously as a crushing expenditure and a natural competitive barrier. It solidifies into formidable moats effectively shielding entrenched incumbents already possessing regulatory approvals and core clearing house partnerships; concurrently, it tightly binds innovative business models reliant on high-yield interest pass-throughs, risky underlying investments, or unlicensed open distribution networks. A stablecoin issuer actively preparing to apply for a trust bank charter currently occupies merely the application submission phase, falling infinitely short of actually securing the license. When forecasting permissible future operational scopes for respective platforms and performing valuation pricing for their compliance ecosystem premiums, drawing a stark dichotomy between “applied” and “approved” represents worlds apart.
Service availability and absolute reliability in payout quality sufficiently dismantle simplistic rate-based price wars. When payees agonize waiting for funds to clear due to bank system downtime, compliance AML and sanctions list screenings, underlying public chain congestion halts, or fiat on-ramp acquirers experiencing liquidity runs, the issuer’s marketed so-called “excess reserve assets” do absolutely nothing to alleviate urgent cash flow crises. Within commercial agreements, determining ultimately which party frontloads failed transaction losses, processes refund compensation, and shoulders systemic disaster recovery dictates foundational trust. When evaluating a payment tech firm’s commercial value, investors must scrutinize loss-sharing and risk-management backstop clauses embedded deep within foundational contracts, going far beyond obsessing over glossy brochure promises of “instant settlement.”
Surge in AI Agent Payment Volumes Lacks Robust Commercial Monetization Evidence
Within Allium’s research reports, the domain exhibiting the most staggering percentage growth unquestionably belongs to automated payment flows targeting AI Agents, yet its absolute monetary scale remains minuscule. Data indicates machine-initiated transfer volumes directly doubled from 34.1 million in the preceding quarter to 68.3 million in Q3 this year; however, the aggregate involved amount paradoxically contracted from $3.9 million in Q2 to a mere $3.7 million. Average ticket sizes hover around a paltry $0.05 per transaction, with median amounts dropping even lower in September. While transaction counts exploded twofold, actual cleared aggregate value regressed inversely. [1]
The x402 protocol alongside Stripe and Tempo’s jointly initiated Machine Payments Protocol aims to deliver frictionless payment support for autonomous software procurement of data APIs, compute resources, and assorted microservices. Such protocols effectively eradicate exorbitant corporate account opening friction confronting sporadic, non-cyclical micro-transactions. However, utilizing entirely disparate filtration and statistical rules within Allium’s dual data sequences, the overwhelming majority of recorded on-chain interactions are effectively monopolized by a handful of gateway nodes. How much genuine capital ultimately filters down to independent terminal merchants currently lacks definitive evidentiary backing. While these cutting-edge protocols eloquently validate underlying technological feasibility, proving authentic sustainable market willingness-to-pay requires substantiation grounded in merchant-tier commercial deployment datasets. [1, 15]
Evaluating this nascent market scientifically necessitates tracking core metrics including: verifiable external deposit-independent customer counts, merchants generating repeat purchases, organically grown transaction volumes stripping away official subsidy stimuli, refund dispute rates, and platform-net realized commission take rates. Thousands of micro-calls initiated via a single internal integration channel, while technically validating architectural functionality, likely generate minimal actual revenue for service providers—even potentially dwarfed by a single baseline legacy enterprise SaaS subscription fee. Long-term monitoring of AI Agent on-chain clearing as frontier next-gen infrastructure warrants continued observation, yet relying exclusively on current illusory volume explosions absolutely cannot serve as a robust foundation for projecting mid-to-short-term financial profitability.
The True Touchstone of Profitability
The stablecoin underlying infrastructure has now successfully anchored colossal digital dollar asset volumes. Under Allium’s classification taxonomy, genuine commercial payment activities display formidable growth resilience, while Circle’s meticulous financial disclosures unreservedly expose the massive scale of reserve interest income yielded to channel distribution conglomerates. Tether’s dominating tier-one advantage within categorized payment totals underscores the unshakeable long-term value of deep-water liquidity and mature counterparty networks within global finance. Card-based issuance programs successfully leverage merchant acquiring networks established decades prior to blockchain, extending stablecoin payment reach into millions of households. Collectively, these concrete empirical datasets affirm that the stablecoin ecosystem absolutely avoids monolithic winner-take-all dynamics across entire industrial chains, instead nurturing distinctly divided symbiotic commercial structures across every value tier. [1, 4]
Our baseline assessment remains cautiously qualified: issuers commanding massive highly-sticky retained capital pools sustain consistently lucrative reserve spread yields, though their terminal profits harbor extreme sensitivity toward macrobenchmark rate trajectories and distributor renegotiation conditions; front-end platforms directly governing customer ledger systems, payroll engines, corporate treasury workflows, and POS checkout terminals possess extraordinarily broad diversification avenues for commercial monetization, yet must rigorously validate inherent value through verifiable retention metrics and positive unit economic contributions; deeply entrenched infrastructural providers steadily secure resilient service premiums provided they genuinely shoulder labor-intensive burdens encompassing intricate compliance auditing, liquidity swapping, and automated reconciliation chores; meanwhile, middleware vendors offering merely homogenized routing algorithms or elementary token transfer protocols confront the industry’s most brutal margin erosion and race-to-the-bottom competitive pressures.
The aforementioned judgments may be fundamentally recalibrated should end-users demonstrate vehement brand loyalty toward specific issuers. If retail patrons maintain steadfast preferences for legacy tokens based on profound confidence in payout quality and liquidity density—even as distributors aggressively upsell proprietary co-branded alternatives—core bargaining leverage forcefully re-concentrates within issuer hands. Conversely, integrated ecosystem platforms face equally acute reverse vulnerabilities: capital accumulations artificially inflated by short-term exorbitant subsidy incentives evaporate instantaneously once promotional tides recede, causing payment profit margins to rapidly deteriorate post-discount expiration. As individual payment processors progressively align on-chain categorized transfer logs against offline genuine invoices, authentic merchant GMV, and customer remittance confirmations through rigorous reconciliation protocols, the foundational commercial reality spanning the entire sector inevitably undergoes decisive truth-extraction recalibration.
Investment evaluation checklists verifying this venture’s viability remain remarkably transparent: tracking daily average floating balances alongside realized net reserve interest profits after channel deductions; precisely aligning on-chain transfer logs against actual customer fulfillment remittances purged of reversal/cancellation noise; calculating net contribution profits per payment net of variable channel costs while persistently monitoring genuine repeat purchase cadence within identified clientele cohorts. Only through these cardinal metrics can both extremities of this commercial flywheel interlock flawlessly—one anchor point capturing static asset accruals generated by dormant dollars, the opposing pole extracting mobility tolls extracted from velocity-driven circulation.
The ultimate economic touchstone of any viable business model ultimately boils down to residual interest generation per unit of client capital retained post-partner sharing, coupled with tangible contribution profit accumulation secured per completed authentic payment. Only those enterprises capable of staunchly defending aforementioned core fiscal benchmarks amid converging tempests encompassing descending benchmark rates, contracting payment take-rates, and tightening global compliance oversight truly deserve their stated valuations and market capitalizations. Illusory prosperity fabricated exclusively through raw on-chain bookkeeping transfer volumes can absolutely never crown an artificially inflated valuation throne.
Data Sources & Research Methodology
Core Data Source: https://www.allium.so/reports/state-of-stablecoins-and-payments-q3-2026
[1] Allium Research, "State of Stablecoins and Payments: Through Q3 2026", October 2026. Categorized payment amounts, use cases, and geolocations within the report are model estimates, not audited customer fulfillment proofs. https://www.allium.so/reports/state-of-stablecoins-and-payments-q3-2026
[2] Bank for International Settlements (BIS), "The Anatomy of Stablecoin Transactions", Working Paper No. 1359. Sample derived from Ethereum network transaction data. https://www.bis.org/publ/work1359.htm
[3] Visa Onchain Analytics, "Changelog", September 18, 2026. Utilizes Allium data inputs, not independent data cross-verification. https://www.visaonchainanalytics.com/changelog
[4] Circle Internet Group, Form 10-Q Quarterly Report (for period ending June 30, 2026), filed with the US Securities and Exchange Commission (SEC). https://www.sec.gov/Archives/edgar/data/1876042/000187604226000248/crcl-20260630.htm
[5] Tether, Q2 2026 Financial Data and Reserve Announcement, July 31, 2026. Company-disclosed quarterly profit and BDO reserve attestation. https://tether.io/news/tether-posts-strong-q2-performance-generates-1-5b-net-operating-profit-maintains-4-11b-reserve-buffer-and-expands-gold-holdings-to-more-than-146-tons/
[6] Tether, Announces Completion of 2025 Financial Statement Audit by KPMG with Unqualified Opinion, August 13, 2026. https://tether.io/news/tether-completes-the-largest-inaugural-financial-audit-in-history/
[7] Global Dollar Network, USDG Partner Incentive and Network Architecture Overview. https://globaldollar.com/network
[8] Open Standard launches Open USD (June 30, 2026); Bridge launches OUSD (September 30, 2026); Stripe announces OUSD as default stablecoin. https://joinopenstandard.com/blog/introducing-open-usd
[9] Mastercard, Completes Wholly-Owned Acquisition of BVNK to Advance Global Stablecoin Clearing Capability, August 2026. https://www.mastercard.com/us/en/news-and-trends/press/2026/august/mastercard-completes-acquisition-of-bvnk-to-advance-global-stabl.html
[10] World Bank, Remittance Prices Worldwide: Methodology. https://remittanceprices.worldbank.org/methodology
[11] US Congress, GENIUS Act (Public Law 119-27), signed July 18, 2025. https://www.govinfo.gov/content/pkg/PLAW-119publ27/html/PLAW-119publ27.htm
[12] US Office of the Comptroller of the Currency (OCC), Seeks Public Comments on Implementing the GENIUS Act; US Treasury Proposed Rulemaking. https://www.occ.gov/news-issuances/news-releases/2026/nr-occ-2026-9.html
[13] European Securities and Markets Authority (ESMA), Sets Out Supervisory Expectations for Services Related to Unauthorized Crypto-Assets, October 8, 2026. https://www.esma.europa.eu/press-news/esma-news/esma-sets-out-supervisory-expectations-services-related-unauthorised
[14] EU Markets in Crypto-Assets Regulation (MiCA), EUR-Lex Legal Text. https://eur-lex.europa.eu/legal-content/EN/TXT/?uri=CELEX:32023R1114
[15] Stripe, Launches Machine Payments Protocol, March 2026; x402 Foundation Specification Overview. https://stripe.com/blog/machine-payments-protocol
Join TechFlow official community to stay tuned
Telegram:https://t.me/TechFlowDaily
X (Twitter):https://x.com/TechFlowPost
X (Twitter) EN:https://x.com/BlockFlow_News
 @insights4vc