Broke below the 200-week iron floor, fear index hits 10. Has BTC really bottomed out this time?
Author: Curie, TechFlow
TechFlow Summary:
On November 16, Strategy founder Michael Saylor publicly recommended the official Bitcoin dashboard, placing special emphasis on four key metrics for evaluating the current market landscape. Data reveals that Bitcoin's current price has broken below the 200-week moving average, a threshold where it has historically spent only 5.6% of its trading time; over the past 30 days, spot Bitcoin ETFs recorded a cumulative net outflow of $2.919 billion, while the Fear and Greed Index simultaneously fell to 10, signaling extreme fear. At the same time, Bitcoin's market cap dominance counter-trendly climbed to 66.9%. This indicates that defensive capital withdrawal by off-exchange institutions has plunged short-term market sentiment to freezing levels, while long-cycle quantitative valuation metrics have likewise stepped into a historically rare low region.
Amid fierce bullish and bearish battles in the market, Bitcoin's staunchest bullish investor opted to gauge the market cycle using the most fundamental on-chain and macroeconomic data.
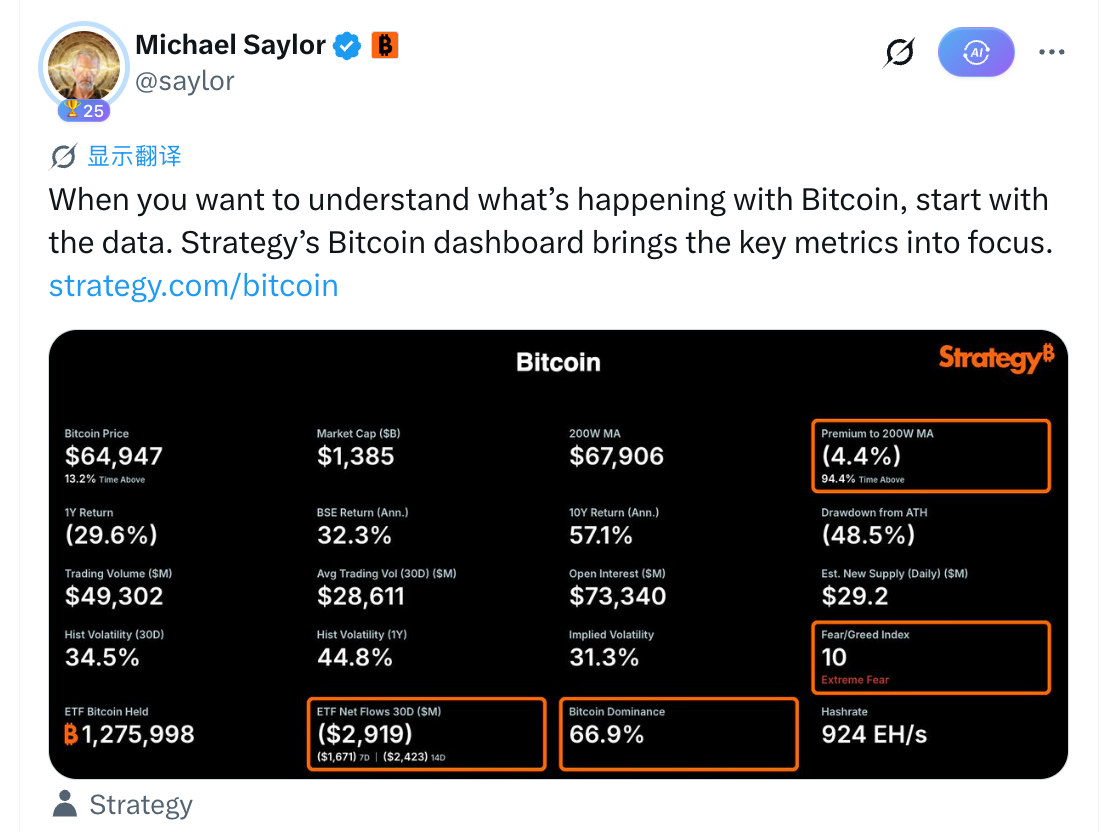
On November 16, Strategy founder Michael Saylor posted on social media platform X stating that to clearly understand what is happening with Bitcoin, one must first look to the data. He simultaneously shared the latest screenshot of Strategy's official Bitcoin dashboard, specifically circling four core indicators with orange borders, which encompass long-term cost moving averages, institutional capital flows, sentiment preferences, and the ecosystem's market cap structure.
Current Price Breaks Below 200-Week Moving Average, Historically Only 5.6% of Time Spent at This Level
The first metric highlighted on the dashboard is long-term price deviation.
According to Strategy's dashboard data, Bitcoin's current price stands at $64,947, while its 200-week moving average (200W MA) rests at $67,906, resulting in a discount rate of -4.4% relative to the 200-week average.
The data further indicates that throughout Bitcoin's historical trading period, prices have remained above the 200-week moving average for 94.4% of the time. Within cryptocurrency quantitative models, the 200-week moving average is typically regarded as a long-term valuation watershed spanning multiple bull-and-bear cycles. A breach below this moving average often signifies that secondary market prices have thoroughly unwound mid-to-short-term speculative bubbles, reverting toward the long-term average cost basis of underlying long-term holders.
ETFs Withdraw $2.9 Billion Over 30 Days, Fear Index Drops to 10
Corresponding to the breach of the long-term moving average is the sustained exit of off-exchange institutional capital.
According to Strategy's tracked ETF fund flow metrics, spot Bitcoin ETFs recorded a cumulative net outflow of $2.919 billion over the past 30 days. Zooming into shorter timeframes, outflows amounted to $2.423 billion in the preceding 14 days and $1.671 billion over the last 7 days, indicating that institutional distribution activity has recently become more concentrated.
Heavy pressure on the liquidity front has directly translated to market sentiment. The Fear and Greed Index featured on the dashboard currently reads a mere 10, classified as "Extreme Fear". This composite indicator factored in volatility, trading volume, social media hype, and Google Trends. Falling to 10 suggests that profit-taking and risk-averse behavior among market participants have reached a temporary extreme.
Nevertheless, the derivatives market has not completely settled down. Dashboard data reveals that Bitcoin's global futures open interest remains elevated at $73.34 billion, reflecting substantial capital deployment and intense positioning from both bulls and bears around the $64,000 level.
Dominance Rises Counter-Trend to 66.9%, Capital Accelerates Concentration Amid Drawdown
The fourth dimension specially highlighted is the divergence in internal capital structure within the crypto ecosystem.
Data indicates that Bitcoin Dominance has climbed to 66.9%. Regarding overall market performance, Bitcoin's current price has retraced 48.5% from its all-time high (ATH), posting a cumulative return of -29.6% over the past year.
This stark contrast indicates that amidst a broad-based correction across crypto assets, capital is rapidly rotating out of altcoins and seeking refuge in Bitcoin for liquidity safety. Bitcoin's dominance nearing 67% does not stem from absolute price appreciation, but is rather a passive consequence of altcoin liquidity facing a more severe squeeze.
While the indicators Saylor selected may seem like well-worn metrics that few traders monitor systematically on a daily basis, analyzing them collectively effectively aligns long-term valuation moving averages, institutional capital flows, market sentiment, and capital allocation preferences.
Grasping these four data sets clarifies Bitcoin's true positioning within the broader cyclical framework. In an era where AI monitoring poses little challenge, traders currently positioned in the market can more easily gauge prevailing market conditions by reviewing this data daily through AI-generated market briefings.
Join TechFlow official community to stay tuned
Telegram:https://t.me/TechFlowDaily
X (Twitter):https://x.com/TechFlowPost
X (Twitter) EN:https://x.com/BlockFlow_News
 深潮TechFlow