Kalshi Applies to List 58 Stock Perpetual Contracts as Bets on Fed Rate Hikes Continue to Heat Up
Author: Flow Brief by Alea Research
Translated by: TechFlow
TechFlow Summary: While Kalshi applies to the CFTC to list perpetual contracts on 58 stocks including Apple and SpaceX, it has pushed the probability of a Fed rate hike in October from 31% to 55%. Prediction markets are shifting from "event betting" to "macro pricing tools," creating new opportunities for traders and industry professionals.
On September 18, Kalshi submitted an approval application to the CFTC for 58 U.S. stock perpetual futures, with underlying assets including Apple, SpaceX, and the SPY ETF, while self-certifying the relevant rule sections. Within this same nine-day window, the exchange positioned itself on the Fed, pushing the October rate hike probability to 55%, and saw open interest rise by 16.0%, half of which consists of football parlay markets that reset every Sunday.

Chart: Trading volume across contract categories within nine days (including beginning and ending changes per category).
Kalshi is applying to become a stock trading venue. On September 18, 58 U.S. stock perpetual futures were submitted to the CFTC, covering Apple, SpaceX, SPY, and QQQ. No announcements were made upon submission, and trading has not yet commenced.
The exchange decoded the Fed, then bet that the cycle isn't over. September rate hike contracts closed at 88% the day before the unanimous 25-basis-point hike was passed, while October rate hike probabilities jumped from 31% to 55%.
The market is pricing in more tightening than the committee itself. With 55% for October and 67% for December, the two meetings imply a cumulative 1.22 hikes of 25 basis points, whereas the median committee expectation is only one.
Half of the growth comes from the parley cycle. Open interest closed at 1.417 billion, up 16.0%. Excluding football parlays, the rest of the exchange grew by 8.0% with no weekend pullback.
The deepest order books belong to markets that no one trades. Election contracts account for 24.9% of open interest but only 0.2% of volume. Of the ten markets capable of absorbing a $5,000 trade with price impact under 2%, six are nomination contracts.
What Launched, What the Court Said
Three days altered the exchange's positioning and what it may sell.
On September 18, Kalshi submitted approval applications to the CFTC for 58 U.S. stock perpetual futures: 55 common stocks, Alibaba ADRs, and the SPY and QQQ funds. The list spans from Apple to ExxonMobil, and includes SpaceX. Each contract covers 100 shares, with minimum client margin set at 15.50% of current market value, determined by the exchange rather than traders. These are security futures products, regulated by both the SEC and CFTC. Kalshi has registered as a national securities exchange via notification to trade these instruments. Currently, there is no trading, no set launch date, and no public announcement.
Two days prior, the Ninth Circuit Court in Blue Lake Rancheria v. Kalshi stated that "the sports event contracts offered on Kalshi's contract market are essentially sports gambling, regardless of whether Kalshi calls them swaps," overturning the ruling denying a preliminary injunction and remanding the case. Nothing was ordered by the court to stop, and no products were delisted. Sports and football parlays account for 63.8% of open interest.
Funds, and What They Bought
Over eight days covered by cash and contract records, traders paid $3.50 billion, compared to $3.34 billion in the previous eight days, an increase of 4.6%, while the exchange reported a 12.3% growth in contract volume.

Chart: Relationship between funds, contracts, and their spread over eight days.
The most active day for funds was Sunday, September 13, reaching $547.3 million, accounting for 15.6% of the eight-day total, coinciding with the full NFL schedule weekend.
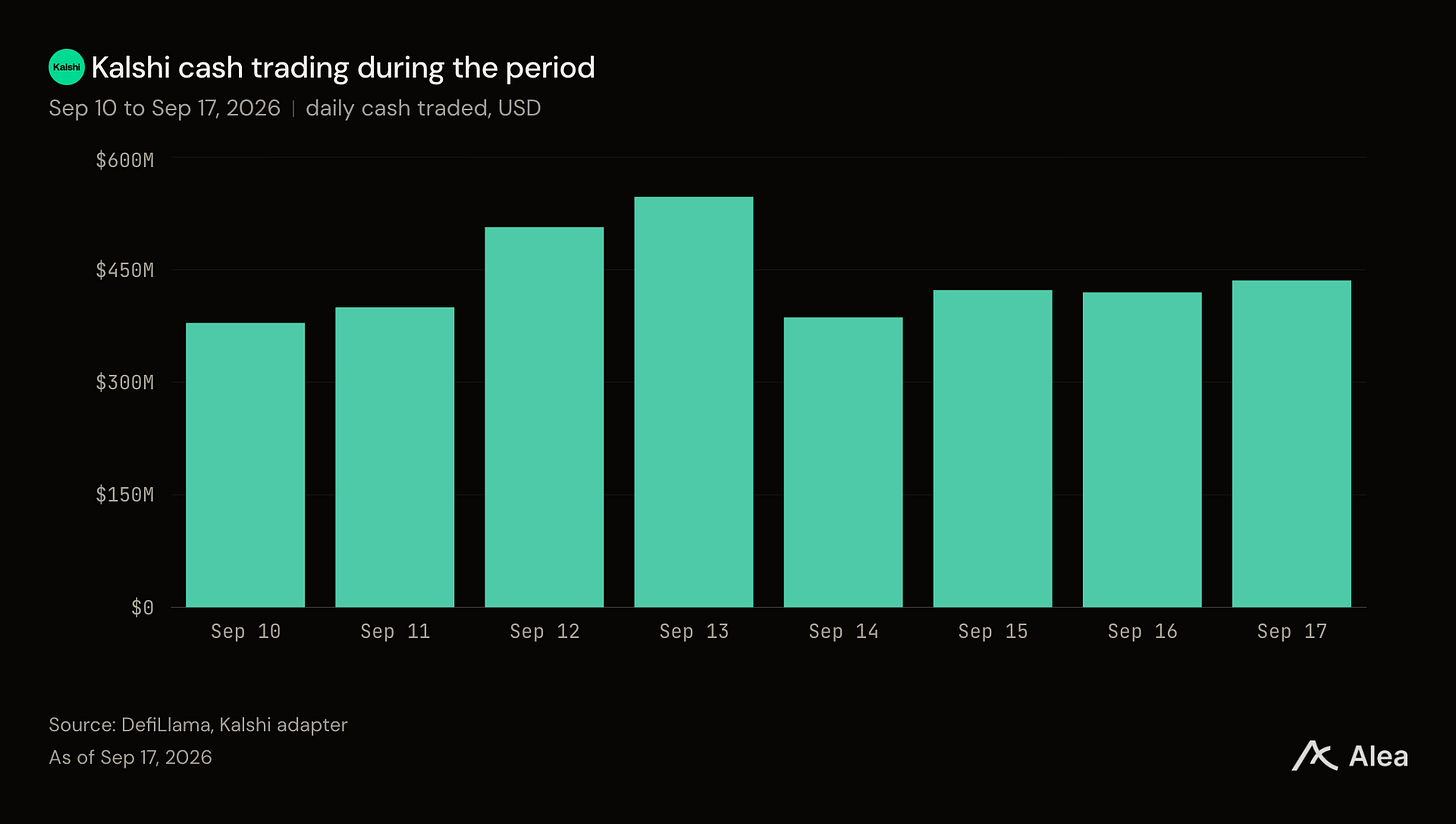
Chart: Daily fund transaction size, with the top two days corresponding to the full schedule Saturday and Sunday.
Two Businesses, One Exchange
Kalshi's volume and Kalshi's conviction reside in different places, and the gap is hardly subtle. Football parlays account for 58.0% of contract volume but hold 33.0% of open interest. Cryptocurrency makes up 14.7% of volume but holds 1.6%. Elections form the mirror image: 0.2% of weekly volume yet holding 24.9% of every open position. Nobody trades it. Everyone holds it.

Chart: Same category group ranked by holdings (not trading volume).
Turnover turns these into numbers. Crypto turned over its average holdings 115.7 times over nine days, with an average holding of 22.33 million contracts. Football parlays turned over 34.7 times, holding 294.87 million. Election turnover runs roughly one-tenth of its order book.
The fast half of the exchange carries the volume; the slow half carries the forecasts.
The Record That Isn't a Record
Open interest closed at 1.417 billion, up 16.0% from 1.221 billion nine days earlier. Half of that growth stems from the cycle of a single product.

Chart: Daily open interest, Sunday troughs and Friday peaks driven by parley cycles.
Football parlays are built and dismantled every week. Holdings stood at 431 million contracts on Friday, Sept 11, dropped to 89 million by Sunday, Sept 13, and returned to 468 million by Friday, Sept 18.
Excluding parlays, the exchange rose from 879 million in contract holdings to 949 million, an 8.0% increase, with no weekend pullback across the entire sequence. The Friday close of 1.417 billion marked the highest daily close of the period, but excluding parlays, Friday remained below Thursday.
The Profitable Forecast

Chart: Daily closing prices of Kalshi's September rate hike contracts since August 1, overlaid with August PPI, CPI, and the decision.
Kalshi's September rate hike contracts opened August at 56%, fell to 26% on Aug 14, and held at 30% on Aug 27. The next day it jumped to 50%, just hours after Fed Chair Kevin Warsh spoke at Jackson Hole. The climb from there was mechanical: August PPI was released on Sept 10, +5.4% YoY, diesel up 24.1%, contracts closed at 63%; August CPI followed on Sept 11, +3.4% YoY, gasoline up 3.9%, contracts closed at 79%. By Sept 15 it reached 88%, where it held through the decision.
The committee voted unanimously 12-to-0 to raise the target range by 25 basis points to 3.75–4.00%. Warsh linked the decision to his August remarks: "As I said at the Jackson Hole policy symposium, I have difficulty characterizing broadly available financial conditions as tight. The committee broadly agrees. So we're taking a dose off the table." Two months prior, the same committee split 9-to-3, with Hammack, Kashkari, and Logan dissenting in favor of hiking. Kalshi's prices tracked the resolution of that debate, climbing from 26% to 88%.
Then the Market Looked to October

Chart: Four meetings quoted by Kalshi (Sept 18 close vs. first close of the period), upward trend in October and December, downward in March.
The Fed released projections alongside the decision, a data set hawkish across the board: growth revised up, inflation revised up, rates revised up, unemployment revised down by two percentage points. Median participants priced the federal funds rate at 4.1% by end-2026, up from 3.8% in June. Warsh rejected it all outright. "I don't do forward guidance," he said, and regarding the projections, "those aren't my projections. Those are my 18 colleagues' projections." He submitted none himself.
The distribution below the median is where the story lies. The lowest of the eighteen individual forecasts was 3.9%, rounding to the new midpoint, with zero participants forecasting a cut this year. Twelve of the eighteen landed on 4.125%, the midpoint of the 4.00–4.25 range, implying exactly one additional hike across the remaining two meetings.

Chart: Pricing paths for the next six FOMC meetings, normalized to 100% for cuts / hold / hikes.
Kalshi October contracts closed at 55%, December at 67%. Combined, the exchange prices in 1.22 movements of 25 basis points across these two meetings, while the committee median expects one. Two-thirds of the committee supported a year-end hike, while pricing for the next meeting sits just above even odds.
This repricing is easier to attribute than most. The Fed maintained a blackout period from Sept 5 to Sept 16, with only Bowman's Sept 18 comments on banking regulation following afterward. As October pricing moved from 45% to 55%, no policy communication accompanied the shift. Another explanation lies in同期 data: initial jobless claims fell to 196,000 on Sept 17, and August retail sales rose 1.2%.
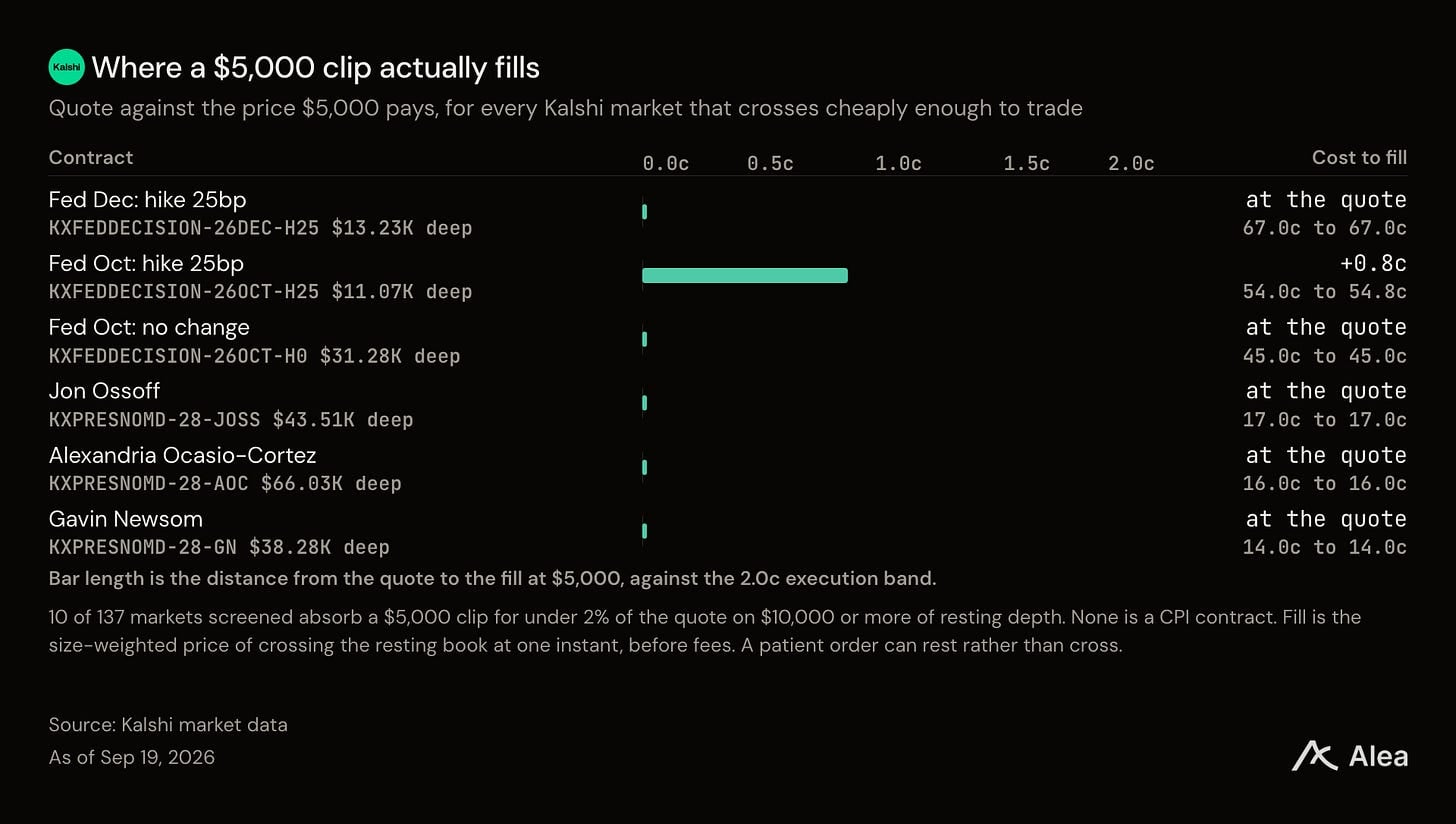
Chart: Cost to cross the order book by $5,000 (Fed contracts and the three deepest markets).
Of the 137 Fed, CPI, and Democratic nomination markets traversed on Sept 19, ten could absorb a $5,000 trade at a cost of under 2% of the quote, with order book depth exceeding $10,000. None of those ten were CPI contracts. The October rate hike contract carried the highest cross-cost among survivors, adding 0.8 cents to a 54-cent quote, precisely because it bore this week's repricing.
The exchange's deepest order book belongs to a market traded by almost no one.
What the Decision Did to Open Interest
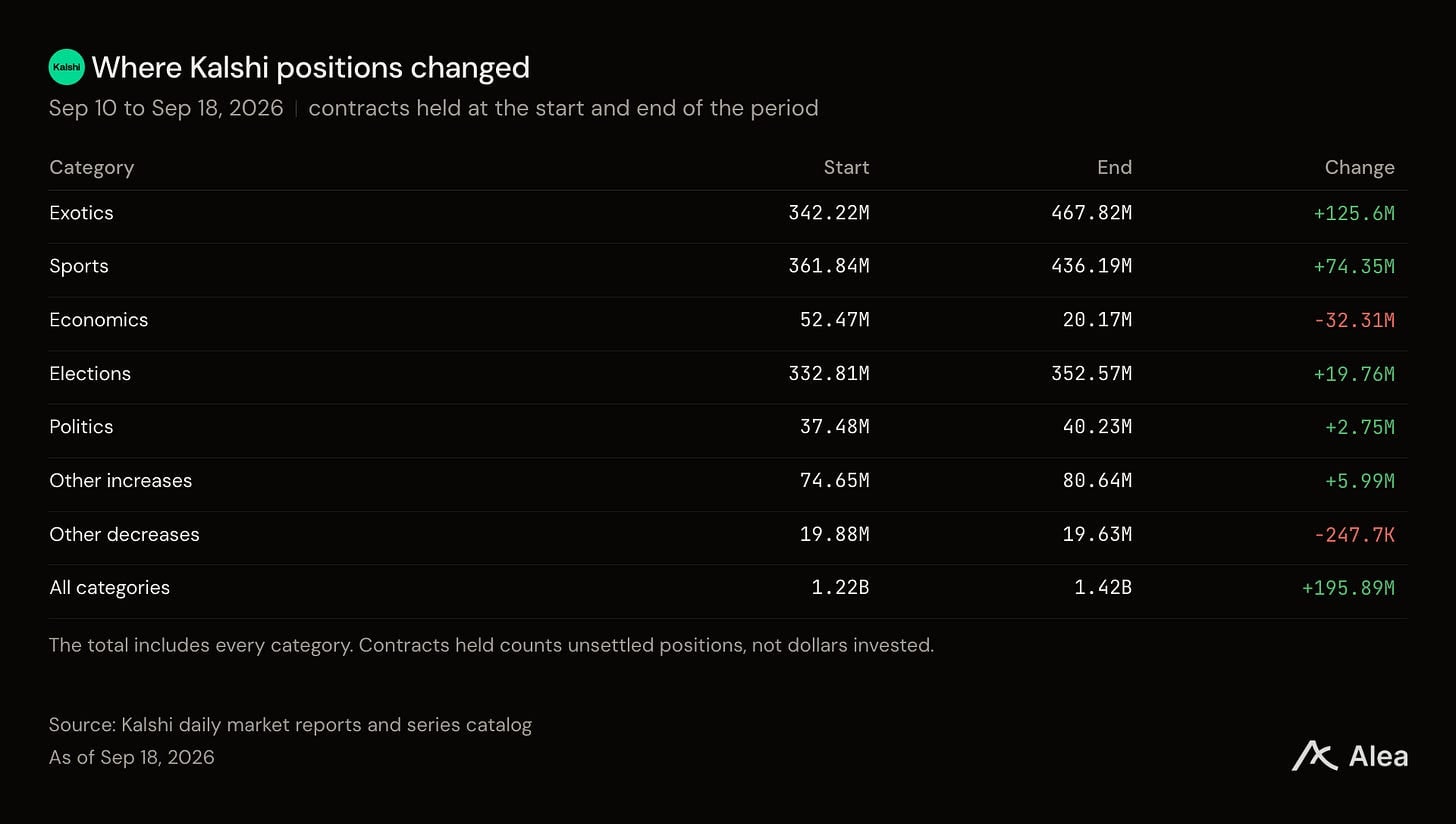
Chart: Beginning and ending contract holdings and changes across categories during the period.
Economics was the loudest category this week, and the biggest loser. Contract volume surged 152.1% to 81.7 million, while open interest declined by 32.3 million. This occurred because September Fed contracts traded 62.3 million positions, dropping open interest from 32.5 million to 1.8 million post-settlement. Interest hasn't abandoned the category; whatever everyone held settled, and funds followed. The only meaningful new build at the bottom is KXRATECUTCOUNT, which asks how many moves rather than whether, adding 1 million.
What People Actually Bought
KXMVECROSSCATEGORY, the football parley ledger, traded 9.52 billion contracts, comprising 54.1% of the exchange's total volume, closing with 362.5 million in holdings. These are combined contracts for NFL and NCAA, settled by the leagues governing the events.
KXPRESNOMD, the Democratic nomination, traded 6.8 million contracts, added 6.6 million to holdings, closing at 144.6 million. Almost every traded contract is retained, whereas parlays require twenty-six trades for every single position held.
In other areas, the Super Bowl added 21.4 million holdings, the World Series shed 6.4 million, and both U.S. Open singles ledgers zeroed out entirely at the conclusion of the tournament.
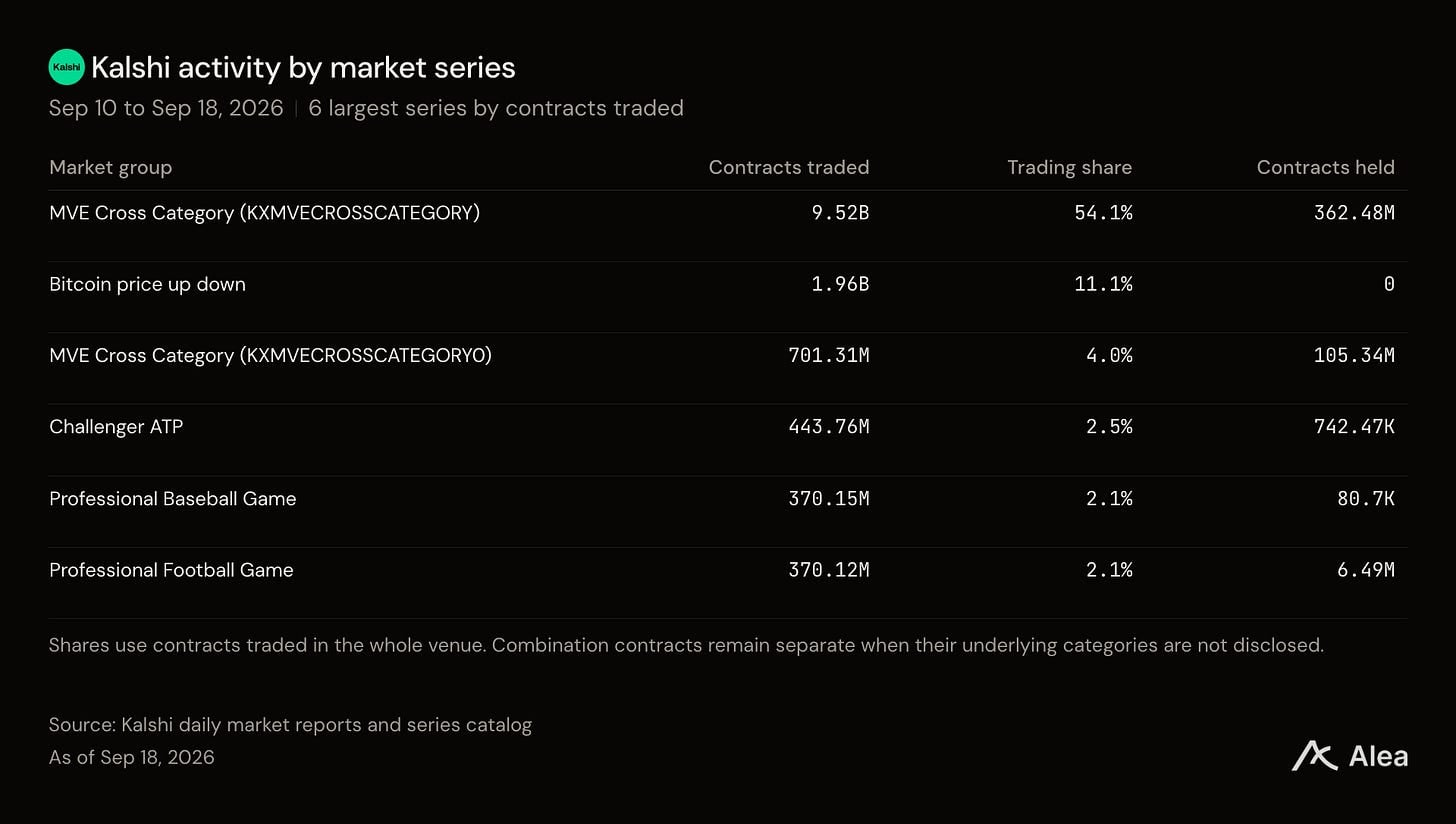
Chart: Top series by volume over nine days, one line claiming over half.
The Other Ledger
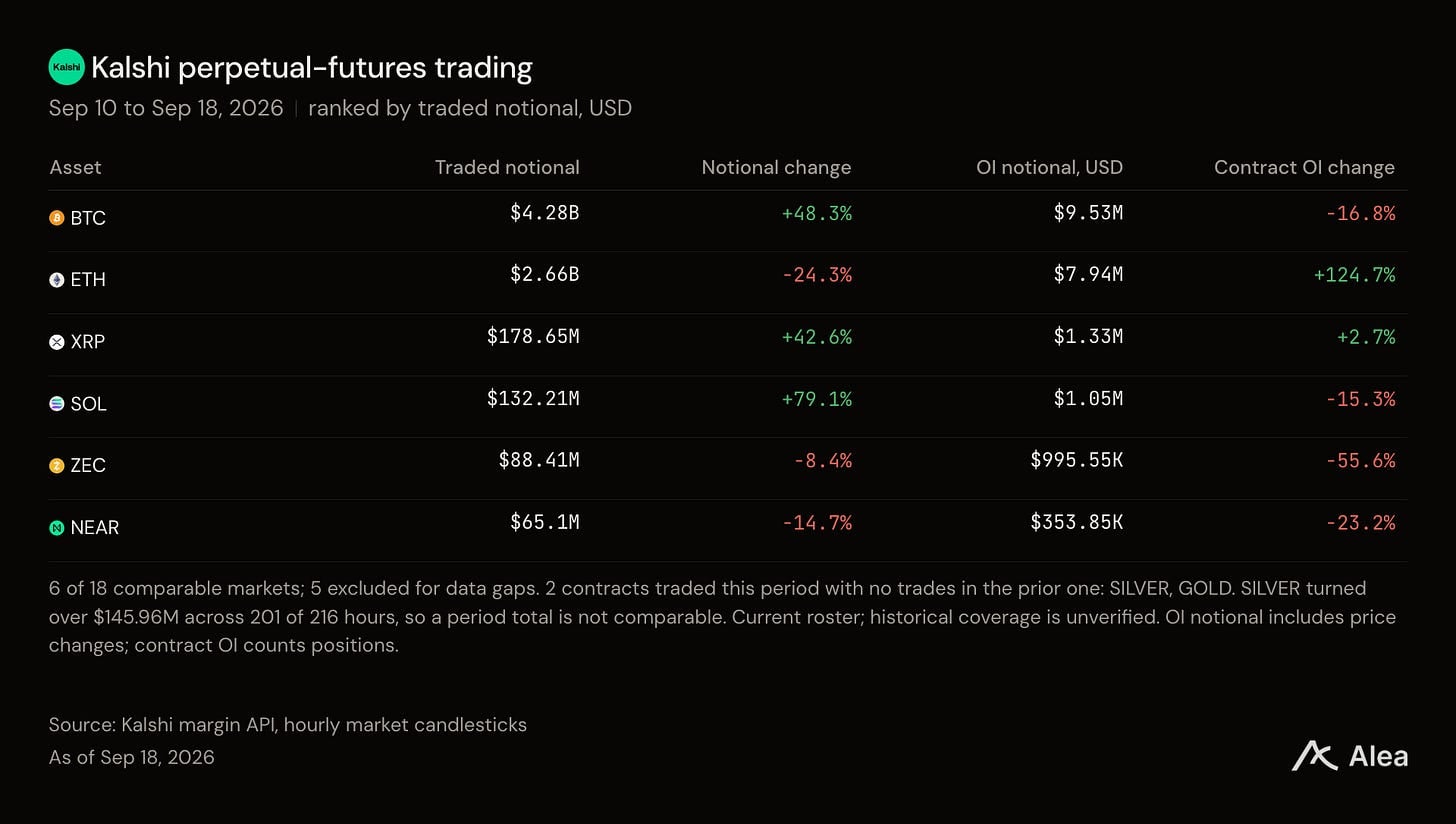
Chart: Kalshi perpetual futures ranked by traded notional value and changes.
Kalshi's perpetual futures traded $7.62 billion in notional value, up 8.6%. This is roughly double the cash turnover of event contracts. They aren't the same metric: notional value represents the price exposure of leveraged contracts, while cash is the actual money paid for a given contract.
Within that ledger, the two largest markets moved in opposite directions. Bitcoin's notional value rose 48.3% to $4.28 billion. Ethereum fell 24.3% to $2.66 billion, while its corresponding open contracts surged 124.7%. Declining turnover paired with rising holdings indicates this is a building-position ledger rather than a trading ledger, marking the clearest position shift in this week's perpetual portfolio.
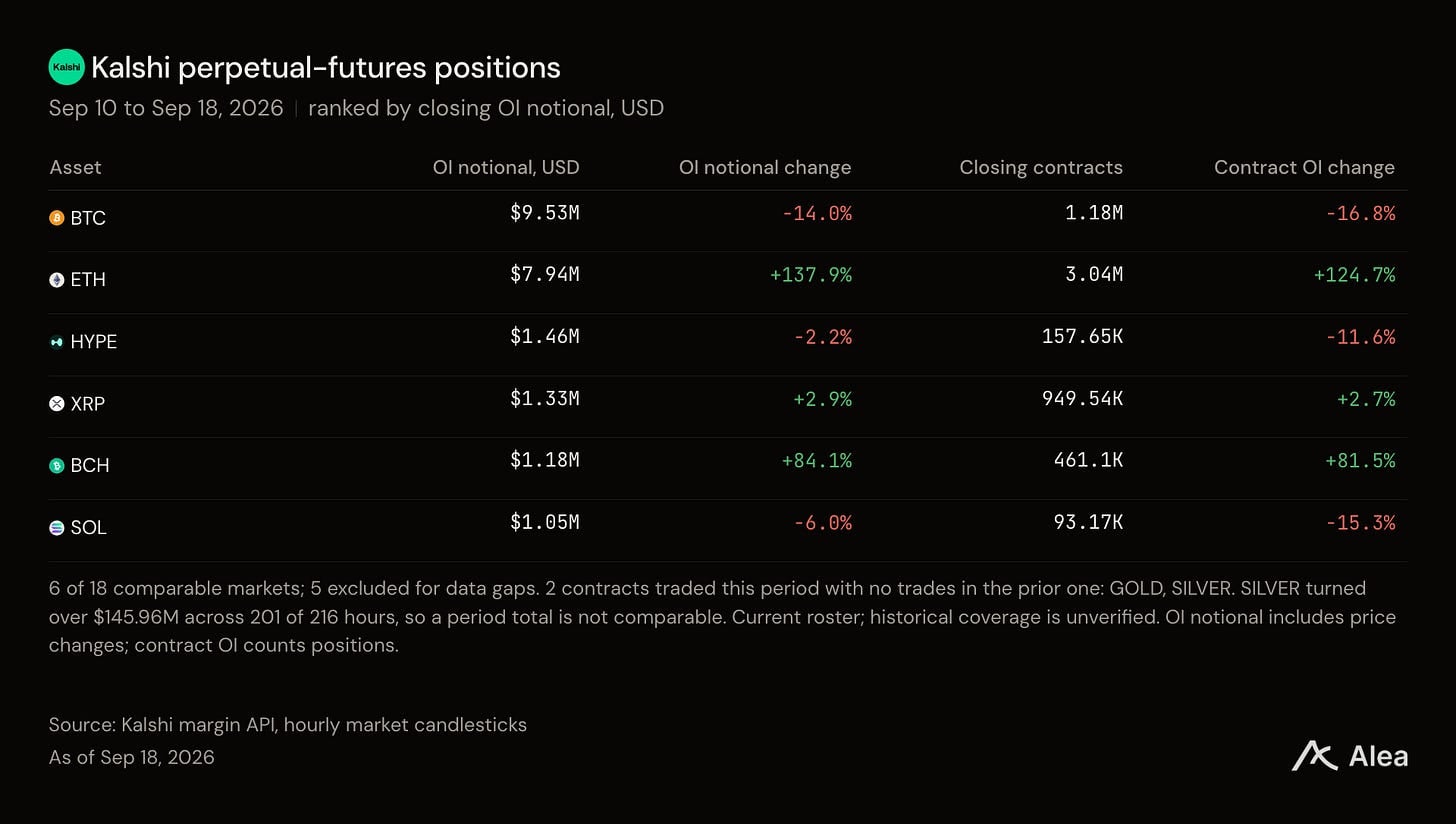
Chart: Same ledger ranked by holdings (not volume), with Ethereum leading.
The product is only sixteen weeks old. Kalshi launched America's first perpetual futures on May 29, breaking $1 billion in its first week, and added gold and silver on Sept 10—its first non-crypto perpetual contracts. The metals also triggered the only two fee adjustments in the window, both setting the market maker fee multiplier for certain metal contracts to zero at 04:00 UTC on Sept 10, neither revoked. Silver subsequently traded $145.96 million over 201 of the 216 hours in the period, while gold covered 202 hours.
New Listings, and What Remained
513 series traded this period but not the last, calculated by first observed trade rather than exchange listing dates. This wave is primarily sports: 176 are Sports series, led by golf with the PGA Tour ledger at 26.76 million contracts, followed by boxing, WNBA, UEFA Europa League, AFC Champions League, and hourly temperature markets for New York and Chicago.
A contrast within this cohort mirrors the entire period: PGA Tour holds 16.67 million of its 26.76 million contracts, while the Davis Cup match market traded 26.18 million but held only 140,000. Nearly identical volume, yet a retention gap of 119 times.
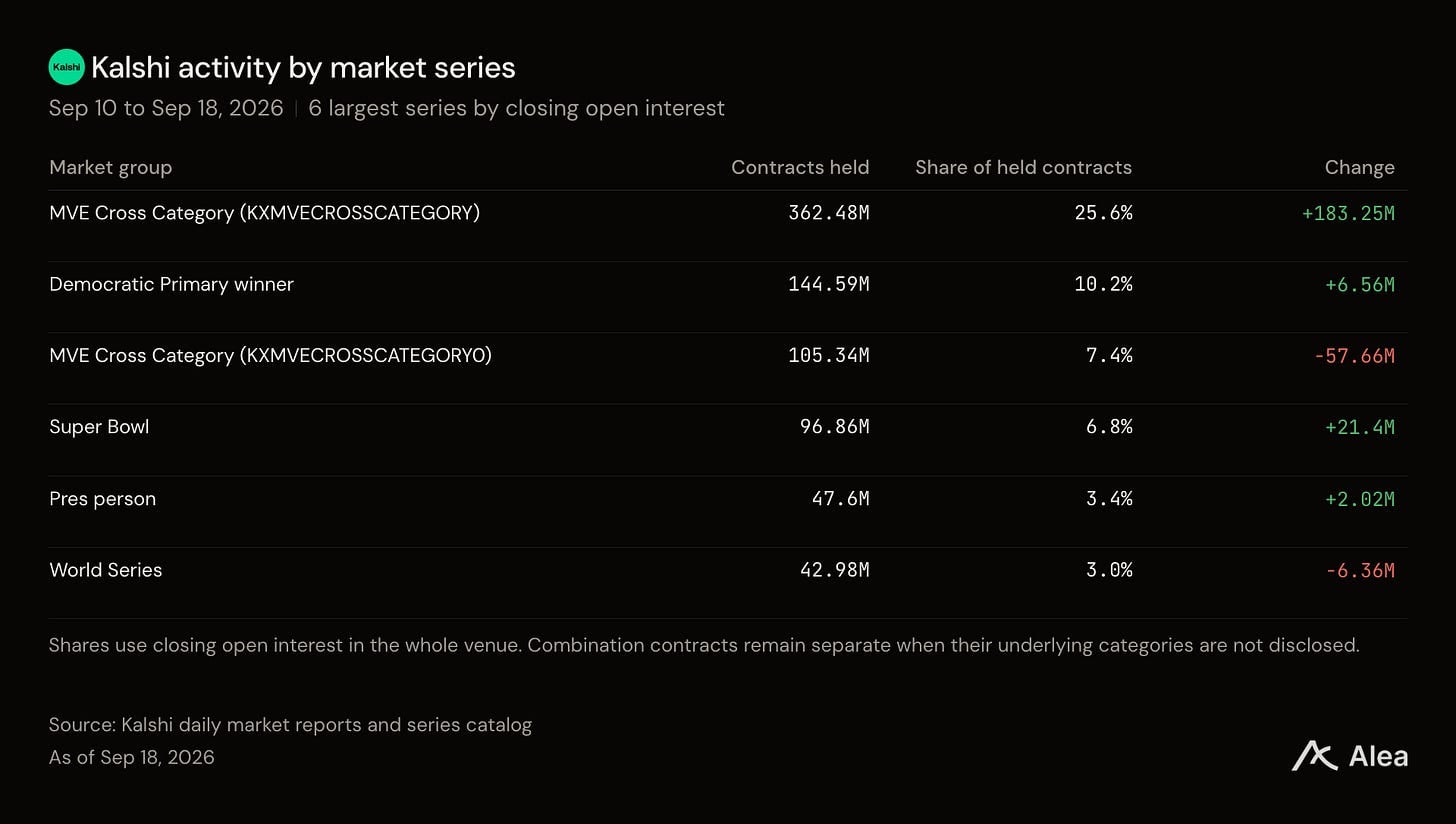
Chart: Series with the highest contract holdings at Friday close, ranking largely independent of trading desks.
Was the Crowd Right, What Settles Next
Last week, one forecast resolved early: the Fed would hike on Sept 16 at 88% probability. The Fed hiked on Sept 16. Among contracts settling this period, ranked by volume, they were the September Fed decision, two U.S. Open singles championships, and that week's Champions League matches.
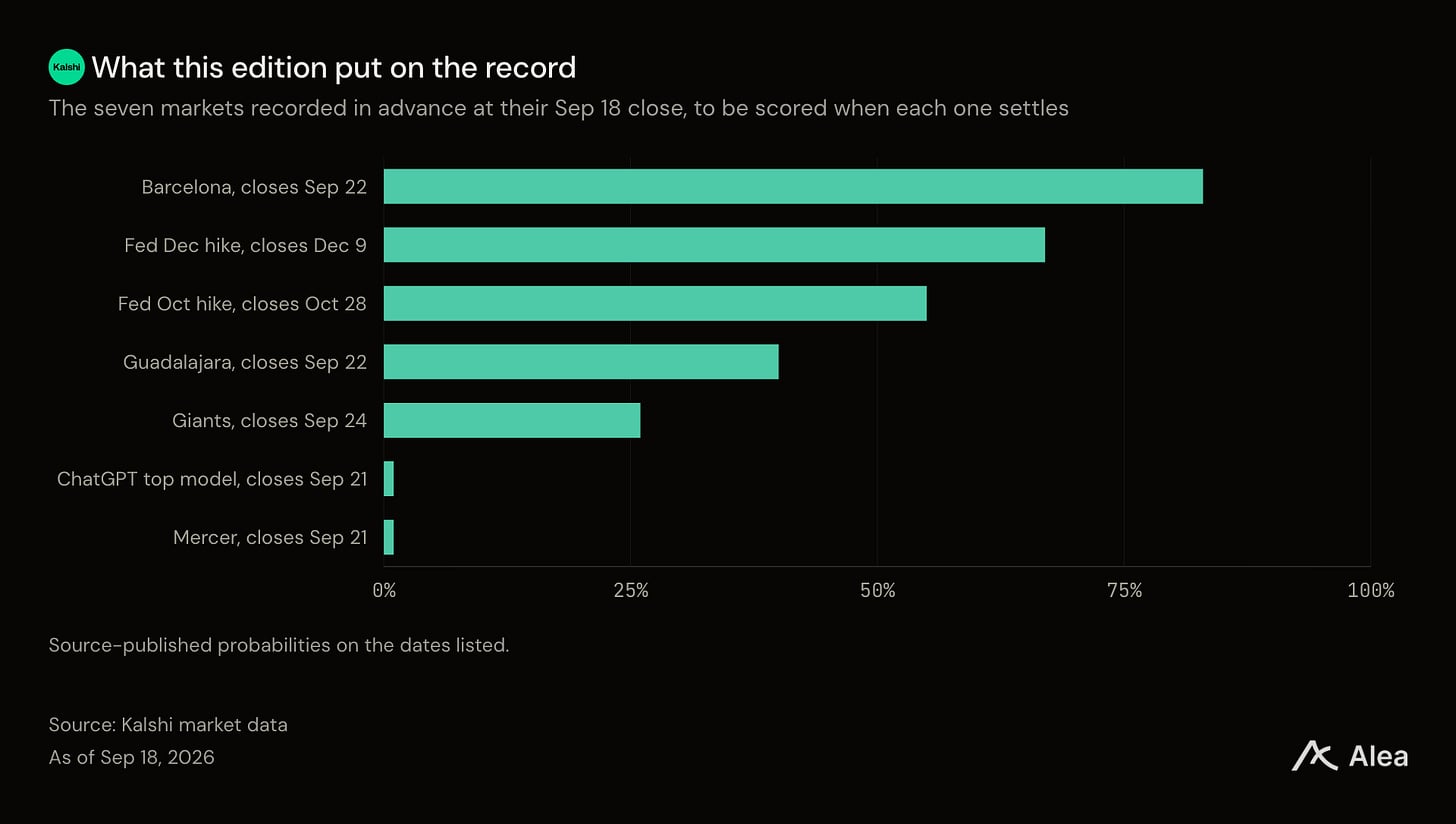
Chart: Performance of seven early-resolving Kalshi markets as of Sept 18 close.
Kalshi's pricing for an October hike closed at 55%, its first time above 50%, compared to just 31% nine days ago. Twelve of the eighteen FOMC participants still included another hike in their projections, with two meetings left to act. October contracts settle on Oct 28. December contracts are priced at 67%, settling on Dec 9.
Join TechFlow official community to stay tuned
Telegram:https://t.me/TechFlowDaily
X (Twitter):https://x.com/TechFlowPost
X (Twitter) EN:https://x.com/BlockFlow_News
 @AleaResearch