Morpho Stablecoin Yield Strategy: Same Curator, Yield Difference Between 3.96% and 7.7%
Written by: Daii
A stablecoin curator managing $2.2B offers its most conservative vault with a 7-day average annualized yield of 3.96% for depositors; another vault under the same curator averages 5.09%, while the pool they've allocated nearly $10M into averages around 7.7% over the same period.
Those extra few percentage points aren't pocketed by anyone; they're the premium you pay for having decisions made for you and for shielding yourself from direct collateral risk. The gateway to that pool is effectively locked behind the default interface.
This mispricing won't vanish once subsidies dry up; it will be slowly arbitraged away as more users push that door open.

Figure 1: Morpho official vault list, search for Steakhouse. The entire Curator column belongs to the same entity, with APY sorted from 15.74% down to 3.71%.
1. Where does this extra yield actually come from?
Let's be clear upfront: there are no token emissions, loyalty points, or airdrop expectations here. Every figure above represents hard-paid interest from borrowers—the cleanest form of yield in this system. Precisely because it's clean, it won't suddenly drop to zero like a subsidy; but precisely because it's clean, it comes at a cost.
In these permissionless lending systems, depositors actually face three paths, not two.
Path one is the default: hand your funds to a conservative vault managed by a professional team. The team selects pools, diversifies, monitors activity, and rebalances during stress events. You receive a blended average yield, net of the team's performance fee and drag from idle cash reserves kept on hand to guarantee instant redemptions.
Many don't know path two exists: the same team usually runs a higher-risk vault. Monitoring and diversification remain, but the eligible pool list is widened. The entire Curator column in Figure 1 belongs to one group, yet yields range from 3.71% to 15.74%. The difference isn't managerial skill; it's which underlying markets each vault is permitted to access.
The third path is depositing directly into a single market. No middlemen, no performance fees, no idle cash drag—you capture the full current interest rate of that specific pool. The catch? The default interface deliberately hides this path. It's not a technical limitation; it's an intentional product design. While this objectively protects the majority, the trade-off is stripping you of the right to choose your own risk tier.
The essence of this spread isn't hidden money; it's a premium paid by the market for assuming the collateral risk that professional teams refuse to expose their conservative vaults to. This is the only sentence you need to remember from this article.
2. The headline number is not what you'll actually get
This is where details quietly erode returns, worth isolating for discussion. And this time, the interface explains it better than I could.
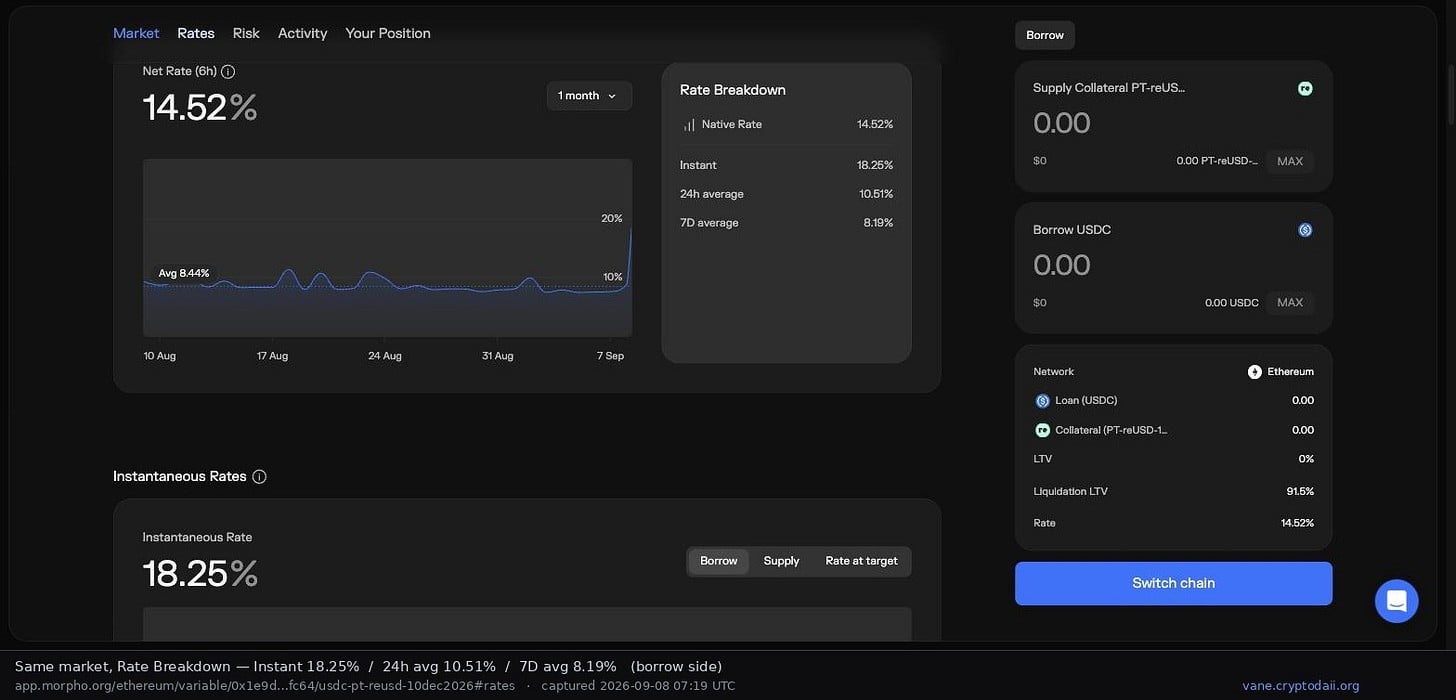
Figure 2: Same pool, same timestamp. The official page displays three metrics side-by-side: instantaneous 18.25%, 24-hour average 10.51%, and 7-day average 8.19%.
These three figures represent three different interpretations of the exact same pool at the exact same second. If you see someone marketing 18.25% elsewhere, they aren't fabricating data; they're cherry-picking the metric that best suits their narrative. From headline to net return breakdown, this article exclusively uses the 7-day average, because it's the only metric you can verify retroactively.
Why the double-digit discrepancy? Rates in these pools are utilization-driven: higher loan-to-supply ratios trigger steeper rate hikes, especially past the optimal threshold. The moment your deposit hits the pool, the supply denominator inflates, utilization drops, and rates immediately compress. In short, the attractive number you see on the dashboard reflects pre-deposit conditions. The instant you deposit, that number vanishes. Larger positions cause greater compression.
The classic trap looks like this: a pool advertises four-figure APY, but clicking through reveals less than $1 in withdrawable liquidity. The board isn't lying; it's just never intended for latecomers.
Therefore, due diligence before entering isn't about reading the sign; it's about inputting your position size into the interest rate curve to calculate the post-deposit reality. That's precisely why I built this tool. Section 6.2 details the exact methodology.
3. When will this gate close?
Structural arbitrage has no hard expiration, but convergence is inevitable. Three pathways to flattening, ordered by probability:
First, crowding. As direct pool depositors increase, utilization dilutes, pulling high-yield pool rates down toward vault averages. This is the mildest and most certain mechanism.
Second, productization. Once the default interface enables direct market access, or superior third-party frontends emerge, friction costs plummet, and spreads will be rapidly arbitraged away.
Third, fee compression. Custodians proactively slash performance fees to retain capital, eroding the service fee component first.
My monitoring cadence is weekly review, not daily chasing. The real danger isn't disappearance tomorrow; it's lingering exposure to old risk premiums after the spread has already collapsed.
Three risks you must accept first
First, diversification and active management disappear. The pool selection, daily monitoring, and emergency rebalancing handled by professionals cease when you bypass them. You hold concentrated exposure to a single market. This is the primary consideration for the yield premium.
Second, exit may be impossible. In this example, the pool totals ~$83M, but only $4.16M (~5%) is immediately withdrawable. If borrowers haven't repaid and others are withdrawing simultaneously, you're stuck in line. Not a bug—it's inherent to lending mechanics.
Third, collateral degradation. Time-bound structured products, yield-bearing stablecoins, and cross-chain wrapped assets each carry distinct depeg and maturity risks; oracles can fail during extreme volatility. Upon bad debt realization, losses are distributed pro-rata across all suppliers. Full principal recovery becomes mathematically impossible.
Only proceed if you accept all three. This article does not constitute financial advice, safety endorsements, or return guarantees.
4. Under the hood: protocol disclosure & tooling
Critical disclosure upfront: The tool referenced below, Vane (https://vane.cryptodaii.org/), was built and deployed by me. As its author, I charge a small fee on every transaction. This creates a conflict of interest. I've therefore structured this section so you can replicate the workflow independently without ever touching the tool.
The protocol is Morpho. Markets are permissionlessly creatable, meaning pool quality varies wildly. The official frontend funnels depositors into curator vaults. Direct market provision lacks a default UI entry point, though the protocol itself remains fully open.
All data derives from the Morpho official interface snapshot dated 2026-09-08. Every image includes its source URL and capture timestamp for verification. If reading days later, treat these figures as methodological demonstrations, not live quotes.
Three-tier yield ladder, calculated using 7-day averages.
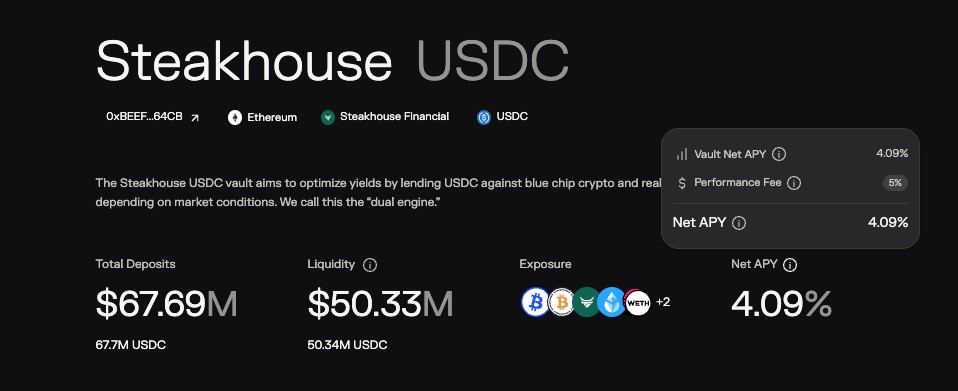
Figure 3: Steakhouse USDC. Curator: Steakhouse Financial. Total deposits: $67.69M. Performance fee: 5%. Returns tab shows 7-day average APY of 3.96% (large text indicates instantaneous rate).
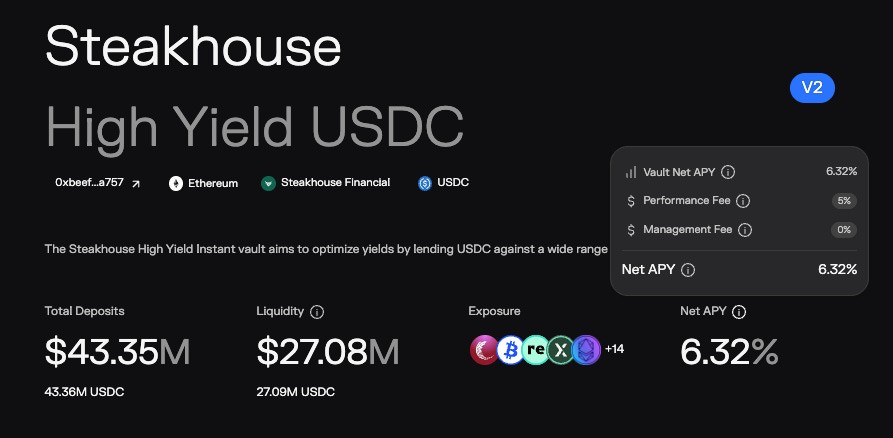
Figure 4: Steakhouse High Yield USDC under the same curator (Ethereum, $43.35M deposits). 7-day average APY: 5.09% (large text = instantaneous).
Tier three is direct pool deposition. Target market: USDC / PT-reUSD-10DEC2026 on Ethereum.
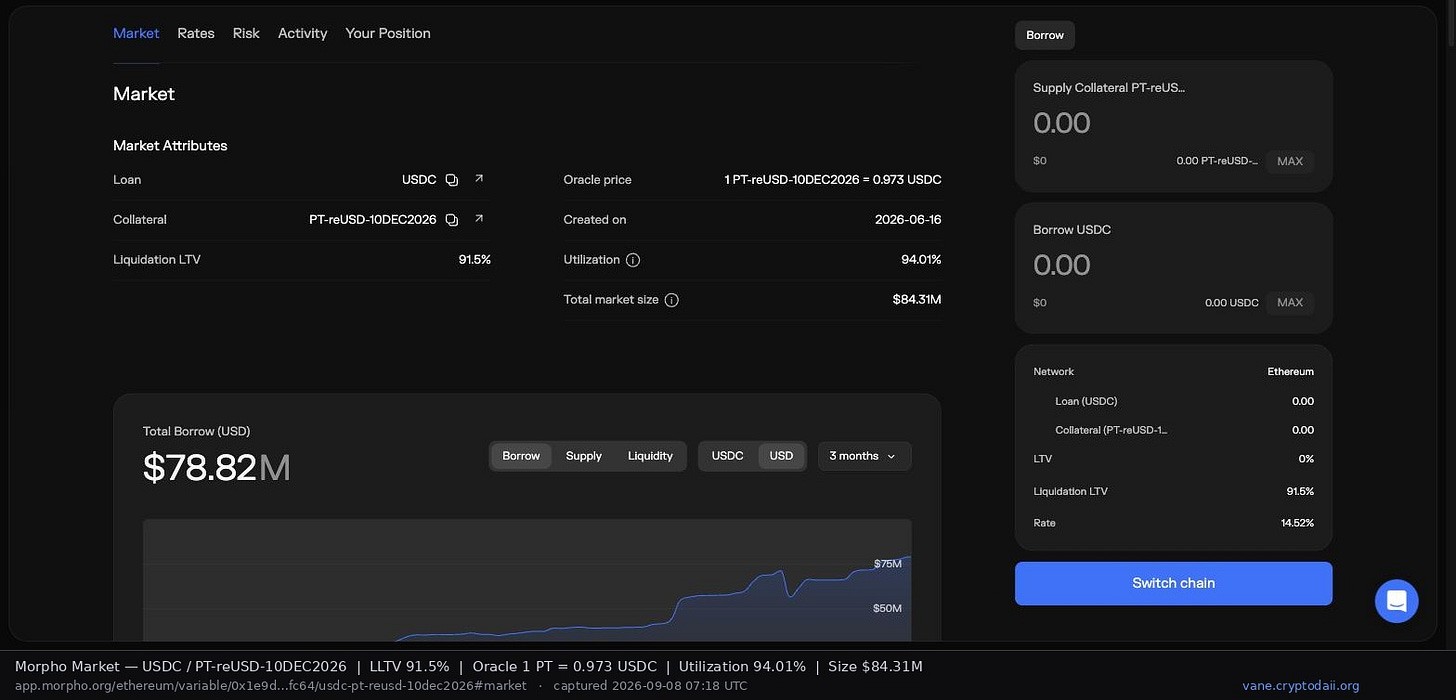
Figure 5: Liquidation threshold: 91.5%. Oracle price: 1 collateral unit = $0.973 USDC. Pool creation date: 2026-06-16. Utilization: 94.01%. Total size: $84.31M.
The supply-side 7-day average isn't explicitly displayed, so I'll show the math: Borrower 7-day average is 8.19% (Fig. 2). Multiply by 94.01% utilization. With zero market fees, supplier 7-day average lands at ~7.7%. Verify independently; you don't need to trust my arithmetic.
Comparing tiers: Conservative vault 3.96%, aggressive vault 5.09%, direct pool deposition ~7.7%. Each step upward demands explicit compensation.
5. My screening methodology: count verifiable backers
Permissionless access defines this space, but unfiltered deployment isn't blindness. I use exclusion, not scoring—strictly for rejection, never endorsement. The strongest signal is tracking how many verified curator vaults have deployed actual capital into the target pool.
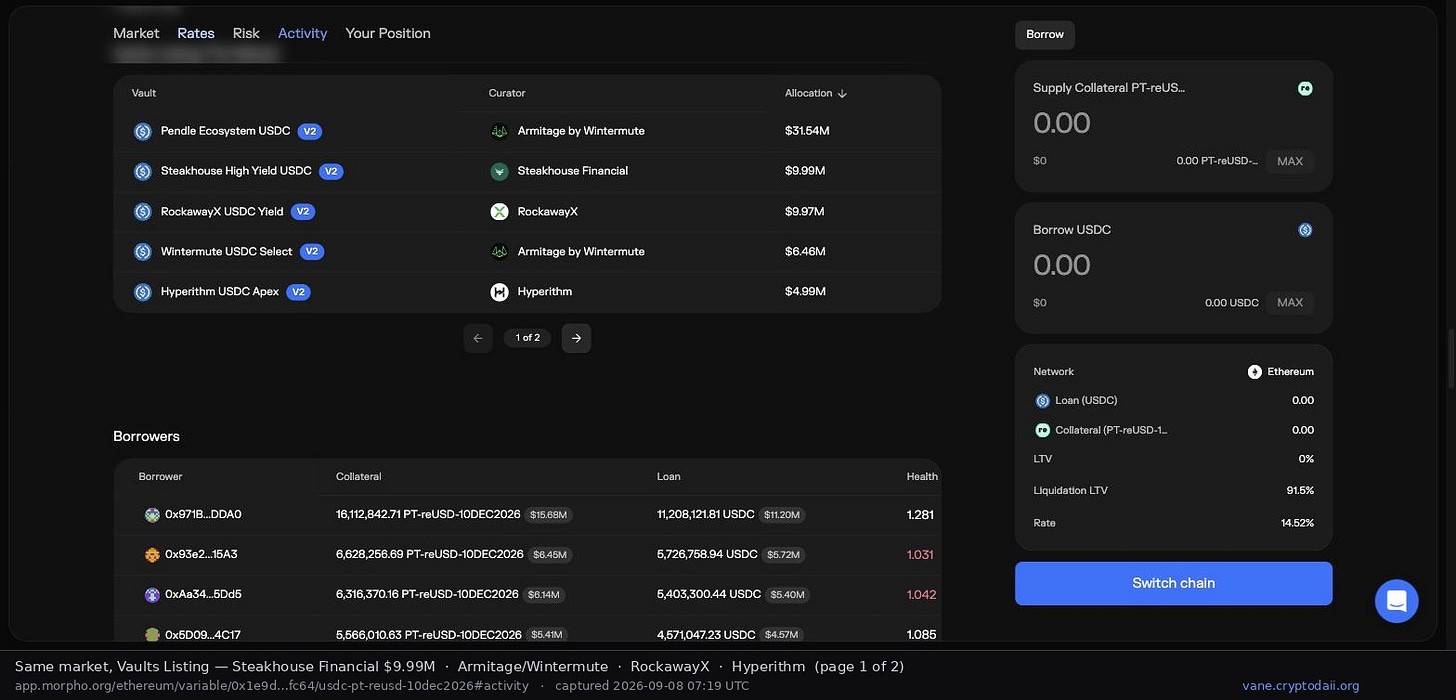
Figure 6: Top-page depositor vaults for this market. Armitage by Wintermute dual vaults total $38M. Steakhouse Financial: $9.99M. RockawayX: $9.97M. Hyperithm: $4.99M.
This screenshot addresses two critical points. First, the pool underwent independent due diligence by at least six verified curators willing to deploy capital. Second—and note row two—the conservative vault yielding 3.96% (Sec. 3) and the vault allocating $9.99M to the 7.7% pool belong to the identical curator. The heading is literal, not metaphorical.
Contrast this with negative examples. On the same market list, some pools advertise four-figure APY, display a single Trusted By icon, hold < $1 withdrawable liquidity, and record total borrowing of merely tens of dollars. Those extra percentage points often correlate with five fewer professional teams willing to endorse them. This is the most actionable heuristic I recommend. Crucially, it functions solely as a rejection filter: six endorsements don't guarantee safety, only six independent assessments. Zero endorsements paired with high rates warrant immediate deletion.
Secondary but highly informative: check the curator-imposed allocation cap. For the aggressive vault in Fig. 4, the absolute limit for this market is $10M. Current allocation sits at $9.99M—maxed out. Meanwhile, this pool represents only 23% of their total portfolio. A team willing to deploy capital but strictly capping exposure provides better reference signals than one running heavy concentration. Optimize against their caps, not their floors.
Additional automatic rejections include: single-source or upgradeable oracles, shallow chain-level collateral depth preventing orderly liquidations, minimal borrowing volume indicating zero organic demand, and critically low withdrawable liquidity ratios. The final criterion alone deducts points here; 5% supply availability is tight.
Technical footnote for data extraction: Morpho operates dual vault generations. New chains predominantly host Gen-2, storing curator metadata in separate fields. Querying only legacy fields generates false negatives—"no curator" hallucinations. My tool recently missed a backed pool due to this exact flaw and has since patched it. Custom scripts must parse both generations.
6. Execution workflow
6.1 Select pool & verify parameters on-chain
Finalize asset selection first (recommend starting with familiar mainstream stablecoins). Filter candidates using Sec. 5 exclusions. Before broadcasting any transactions, fetch the five core parameters (supply asset, collateral type, oracle contract, interest rate model, liquidation threshold) directly from-chain and cross-reference against frontend displays.
Added risk: Frontend data may lag or mismatch. Skipping validation risks depositing into unintended markets. My tool enforces real-time parameter fetching and cross-checking prior to approvals/deposits, rejecting execution on discrepancies. Manual operators must implement this manually.
6.2 Calculate post-deposit yield, ignore advertised rates
Input your intended deposit amount into the utilization curve to derive post-deposit rates, then benchmark against current live metrics.
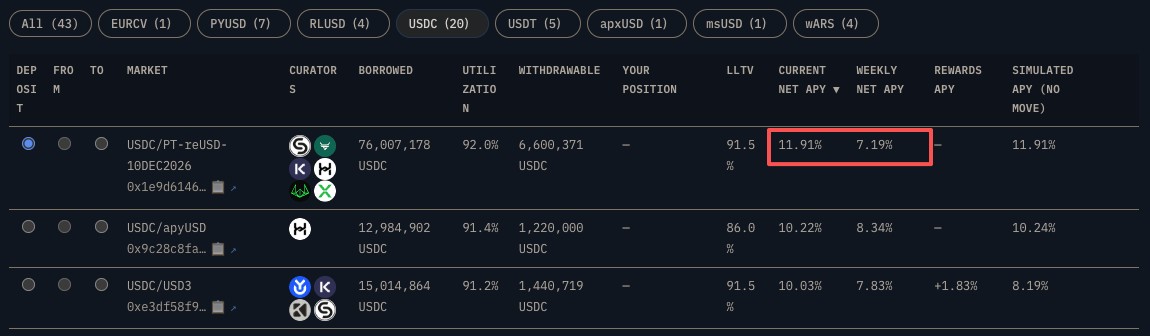
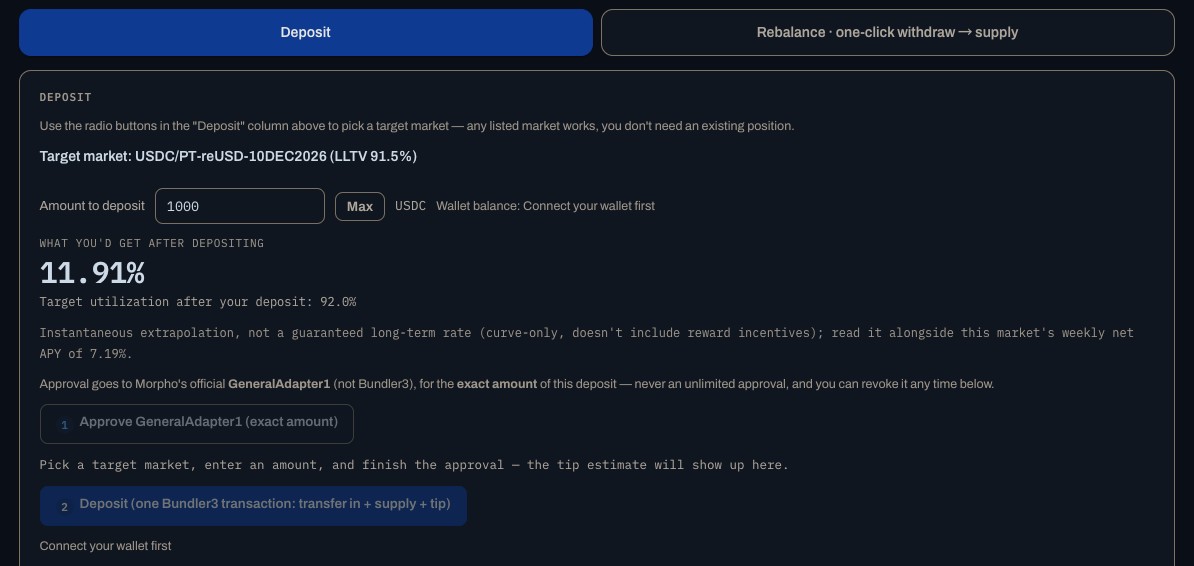
Figure 7: Vane computes projected APY pre-deposit, displaying it adjacent to advertised weekly averages. Explicit warnings trigger on severe mismatches.
Personal threshold logic: I require minimum 200bps improvement (7-day avg basis) post-deposit versus current holdings. Below that, round-trip fees plus incremental risk premium aren't justified. This example shows 7.7% vs 3.96%—a 3.7pp gain marginally clearing the threshold. But as the next section proves, theoretical viability ≠ economic efficiency.
Added risk: Post-deposit projections rely on static public curve extrapolation. They omit dynamic rate adaptation and aren't protocol-official figures. They only solve the advertising deception problem; long-term realization isn't guaranteed.
6.3 Execute & codify exit parameters
Deposition requires approval + deposit. Critical controls: approve only the protocol's official adapter contract, not arbitrary addresses. Authorize exact transaction amounts rather than infinite allowances. Frontend compromises would then cap loss exposure to the specific transaction size.
Cross-market rebalancing demands comprehensive single-signature approval covering all positions on the target chain—authority scope vastly exceeds initial deposits. Verify meticulously before signing. My tool hardcodes protocol official adapters and publishes complete chain-specific contract address lists with verification links for character-by-character matching. This constitutes maximum transparency; blind trust based on developer claims is inadvisable.
Added risk: Approvals expand attack surfaces. Infinite allowances, unvetted contract permissions, and cross-chain signature errors represent the three most common exploit vectors.
7. Net yield breakdown: entry barriers lower than assumed
Baseline scenario: $10,000 principal targeting said pool. Lock term fixed first: collateral maturity hits 2026-12-10. Per breakout protocols, withdrawals must initiate ≥14 days prior, leaving a ~2.5 month window. I model conservatively at 2 months for buffer. Sequence matters: expiry constraints dictate holding duration before economics are evaluated. Never reverse-engineer optimal APY to fit artificial holding periods.
Nominal returns (7-day avg): Direct pool deposition yields ~7.7% APY → ~$128.30 over 2 months. Equivalent conservative vault allocation yields 3.96% APY → ~$66.00. Gross differential: $62.30. Zero emission tokens require liquidation, eliminating secondary market slippage risks. This tailwind distinguishes structural opportunities from speculative airdrop farming.
Four deduction categories follow. All assumptions explicit for independent recalculation.
1. Gas. Full lifecycle requires 3 on-chain txns: approval, deposit, withdrawal. Mainnet snapshot (2026-09-08): Etherscan gas price 0.051 Gwei, ETH ≈ $2,470. Based on actual broadcast costs, ~$0.30 per txn → ~$0.90 total.
2. Tool fee. Flat % of gas cost with floor pricing. At current gas levels, ≤$0.30 per cycle.
3. Slippage. Zero—no swap execution involved.
4. Opportunity cost. Already embedded in vault-comparison baseline. Double-counting excluded.
Total cycle cost: ~$1.50. Net alpha: ~$61.00.
Minimum viable position? Premium APY spans 3.74pp, translating to 0.62% principal over 2 months. Breakeven capital = Cost / Premium Ratio:
Current rate tests ($1 total cost) establish ~$160 breakeven. At 10 Gwei gas, threshold jumps to ~$1,800. At 30 Gwei, ~$5,400—that matches my previous rough estimate, which was calibrated to a gas environment that no longer exists.
Put differently: thresholds scale entirely with spot gas prices, not base-layer identity. "Mainnet too expensive, migrate to L2s" holds false as of September 2026—native mainnet costs are currently depressed. Volatility remains imminent. Monitor gas at broadcast timestamps, not static dollar benchmarks. This temporal awareness replaces the arbitrary numbers abandoned in draft iterations.
结论: At current fee structures, cost ceases to be the barrier; risk assumes control.
Math validates $10,000 sizing. Hesitation should stem exclusively from Sec. 3.1 triple-threats: 5% withdrawable liquidity, singular collateral exposure, absence of institutional monitoring.
Stress test liquidity queues and bad debt tolerance before calculating efficiency. Invert sequence, and cheap gas funnels capital into structurally unsound markets.
8. Every breaking point threshold
8.1 Collateral maturity (time-bound structured assets)
Underlying collateral features explicit maturity dates encoded in tickers: 2026-12-10. Pre-maturity price action shifts dramatically; discount rates widen unpredictably, altering pool risk profiles. Mitigation: initiate withdrawal ≥14 days prior. Avoid terminal phase speculation.
8.2 Collateral depeg
Oracle feed currently prices collateral at 1 unit = $0.973 USDC, embedding implicit discounts alongside a 91.5% liquidation threshold. Depegs here represent realized historical precedent—not theoretical edge cases. The pool triggered mechanical liquidations on August 25th.
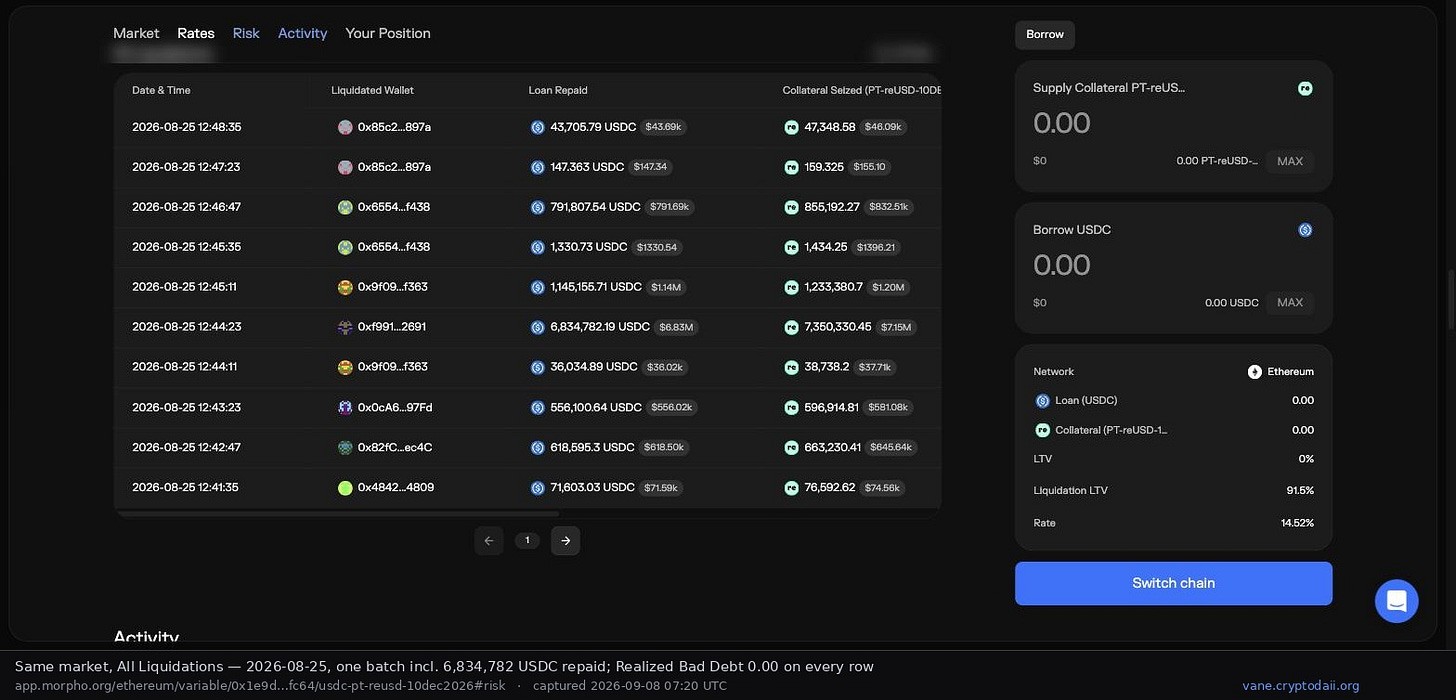
Figure 8: Aug 25 liquidation ledger. Single settlement reached $6.83M. Realized bad debt columns register 0.00 across rows.
Dual interpretation required. Constructive: liquidation engines functioned correctly, multi-million positions resolved cleanly with zero bad debt carry. Destructive: confirms collateral actively trades into liquidation thresholds in bulk clusters. Mitigation: treat oracle pricing as primary telemetry. Withdraw preemptively upon discount widening.
8.3 Peak utilization & withdrawal lockups
Current utilization sits at 94%, exceeding 90% targets. Withdrawable liquidity contracts to 5% of total supply. Higher utilization drives superior APY presentation—and simultaneously creates exit friction. These dynamics share identical origins. Protocol: track withdrawable liquidity ratios rigidly. Queue ahead of thresholds; don't discover blocked exits upon deployment.
8.4 Oracle failure or manipulation vectors
Single-price feeds, upgradeable oracle contracts, and opaque governance triggers automatic rejections. Activation results in total principal impairment with no recovery mechanisms. Defense: filter aggressively during Sec. 6.1 screening. Post-hoc mitigation fails catastrophically.
9. Pre-defined exit triggers
1. Unconditional withdrawal initiation 14 days pre-collateral maturity.
2. Withdrawable liquidity ratio breaches custom thresholds (personal floor: 5%; subject pool already testing boundaries). Initiate queue procedures.
3. Post-deposit yield advantage compresses ≤200bps versus conservative baselines (7-day avg). Premia evaporate; residual risk persists. Holding becomes purely negative expectancy.
4. Verified curator vault allocations contract significantly, or block withdrawals occur. Professional entities signal distress before retail detection windows close.
5. Personal position sizing suppresses realized rates parallel to vault averages. Full risk premium paid; marginal yield absent. Position optimization mandatory.
Signature discipline remains unchanged: map exits before entries. Extract upper quartile gains; leave tail exposure to other market participants.
Data & Source Attribution
All metrics and screenshots extracted from Morpho official application (app.morpho.org). Capture timestamps span 2026-09-08 06:59–07:20 UTC. Image footers contain raw URLs and acquisition times for audit verification. Unified reporting baseline applies 7-day averages; instantaneous values appear solely comparative within Sec. 2.
- Vaults: Steakhouse USDC. Contract: 0xBEEF01735c132Ada46AA9aA4c54623cAA92A64CB. Chain: Ethereum. Version: v1. Total Deposits: $67.79M. Performance Fee: 5%. 7-Day Avg APY: 3.96%. 30-Day: 3.93%. Curator: Steakhouse Financial. | Steakhouse High Yield USDC. Contract: 0xbeeff2C5bF38f90e3482a8b19F12E5a6D2FCa757. Chain: Ethereum. Version: v2. Total Deposits: $43.21M. Performance Fee: 5%. Management Fee: 0%. 7-Day Avg APY: 5.09%. 30-Day: 5.29%. Curator: Steakhouse Financial.
- Markets: Ethereum USDC / PT-reUSD-10DEC2026. Market ID: 0x1e9d614631a7df0ec07fb05b2c8cb2491575fd1a63a33bf187a6afb295a4fc64. Liquidation Threshold: 91.5%. Creation Date: 2026-06-16. Oracle: 0x217d6DdCDB95112C51657F6270e8C079CFDB51f0. Oracle Quote: 1 collateral unit = $0.973 USDC (matches DefiLlama). Interest Model: 0x870aC11D48B15DB9a138Cf899d20F13F79Ba00BC. Target Utilization: 90%. Current Utilization: 94.01%. Total Size: $84.31M. Total Borrowed: $78.82M. Withdrawable Liquidity: $4.16M. Liquidation Penalty: 2.61%. Realized Bad Debt: 0.00. Borrower Rates: Instantaneous 18.25%, 24h Avg 10.51%, 7-day Avg 8.19%. Supplier 7-day Avg derived via multiplier (8.19% × utilization) ≈ 7.7%.
- Supplier Vaults (by allocation volume, Page 1): Pendle Ecosystem USDC $31.45M (Curator: Armitage by Wintermute), Steakhouse High Yield USDC $9.99M (Curator: Steakhouse Financial), RockawayX USDC Yield $9.97M (Curator: RockawayX), Wintermute USDC Select $6.46M (Curator: Armitage by Wintermute), Hyperithm USDC Apex $4.99M (Curator: Hyperithm). Additional pages list Re Ecosystem Vault, Smokehouse USDC, Keyrock USDC, etc.
- Morpho Official Contract Registry: docs.morpho.org/get-started/resources/addresses. | Developer Tool: vane.cryptodaii.org.
Join TechFlow official community to stay tuned
Telegram:https://t.me/TechFlowDaily
X (Twitter):https://x.com/TechFlowPost
X (Twitter) EN:https://x.com/BlockFlow_News
 @yzdxs8