H1 2026 Polymarket Report: High-Frequency Traders or Superforecasters?
Written by: Surf
Key Findings
The following conclusions are based on 787 million deduplicated trades across the Polymarket International Market from January to June 2026, involving 1,733,011 wallets, combined with venue-level data from Polymarket US.
- A second Polymarket is rapidly scaling: The monthly trading volume of the US-regulated market under CFTC jurisdiction accounted for 5% of the international market's volume in January and rose to 47% in June, further reaching 67% in July.
- High-turnover categories drive fee revenue: Sports and crypto markets contributed 98% of the roughly $184 million in gross fees generated by the international market in H1; the crypto market generated $96.3 million in fees from about half the trading volume, surpassing sports at $83.5 million.
- User count and trading volume are highly misaligned: Retail wallets account for roughly 90% of users, while bots and professional users together generate about 80% of taker volume; bots alone (5.9% of wallets) completed approximately two-thirds of all trades.
- Customer acquisition does not rely on a single blockbuster market: The top individual traffic-driving market in H1 brought in fewer than 7,000 new wallets, compared to roughly 1.13 million total new wallets; in any given month, the top 15 traffic drivers accounted for only 8%–19% of that month's new wallets.
- No single market category significantly boosts platform retention: Roughly 51%–57% of monthly active wallets return the following month, but users often leave their initial category and switch to other categories on the platform.
- The bot cohort profits overall, but the median still loses money: Bot samples collectively achieved roughly $108 million in net gains, yet only 27% of wallets were profitable; out of approximately 1.75 million wallets, only 146 maintained positive cash flow for six consecutive months.
Part 1: The Landscape of Two Polymarket Markets
Polymarket US: A Second Market Taking Shape
In H1 2026, Polymarket effectively became two trading venues, though most discussions focused on only one. The international market catering to non-US users continues to operate an off-chain CLOB settled on Polygon, recording $17.9 billion in one-sided volume over six months. Meanwhile, the CFTC-regulated Polymarket US, launched at the end of 2025, climbed from 5% of the international market's monthly volume in January to 47% in June, reaching 67% in July (roughly $2 billion vs. $3 billion).
Both markets share branding and basic order book mechanisms, but do not share order books, user bases, or revenue structures. Like Kalshi, they utilize off-chain matching with central limit order books and apply the same price-dependent fee curve for takers: fee = Θ·C·p(1−p). The distinction lies in settlement rails: the international market publicly settles each trade on Polygon, while the US market clears through a private, regulated ledger.
Cross-platform comparisons require standardized metrics. This article defines volume as one-sided, taker-side, actual traded USD counted once; nominal amounts and bilateral counts typically run 2–3 times higher. Recalculating July data under this metric, the commonly cited figures of $41B / $7B / $5B correspond to approximately $13.3B / $3B / $2B respectively.

Figure 1 | Monthly one-sided trading volume of Polymarket International and US markets
Daily trading volume on the US market grew from around $1 million shortly after launch to $50 million–$100 million in July; daily trade counts surpassed 1 million, with open interest temporarily exceeding $150 million. Fee structures shifted from a fixed-basis-point model in January to a price-sensitive formula implemented in April.
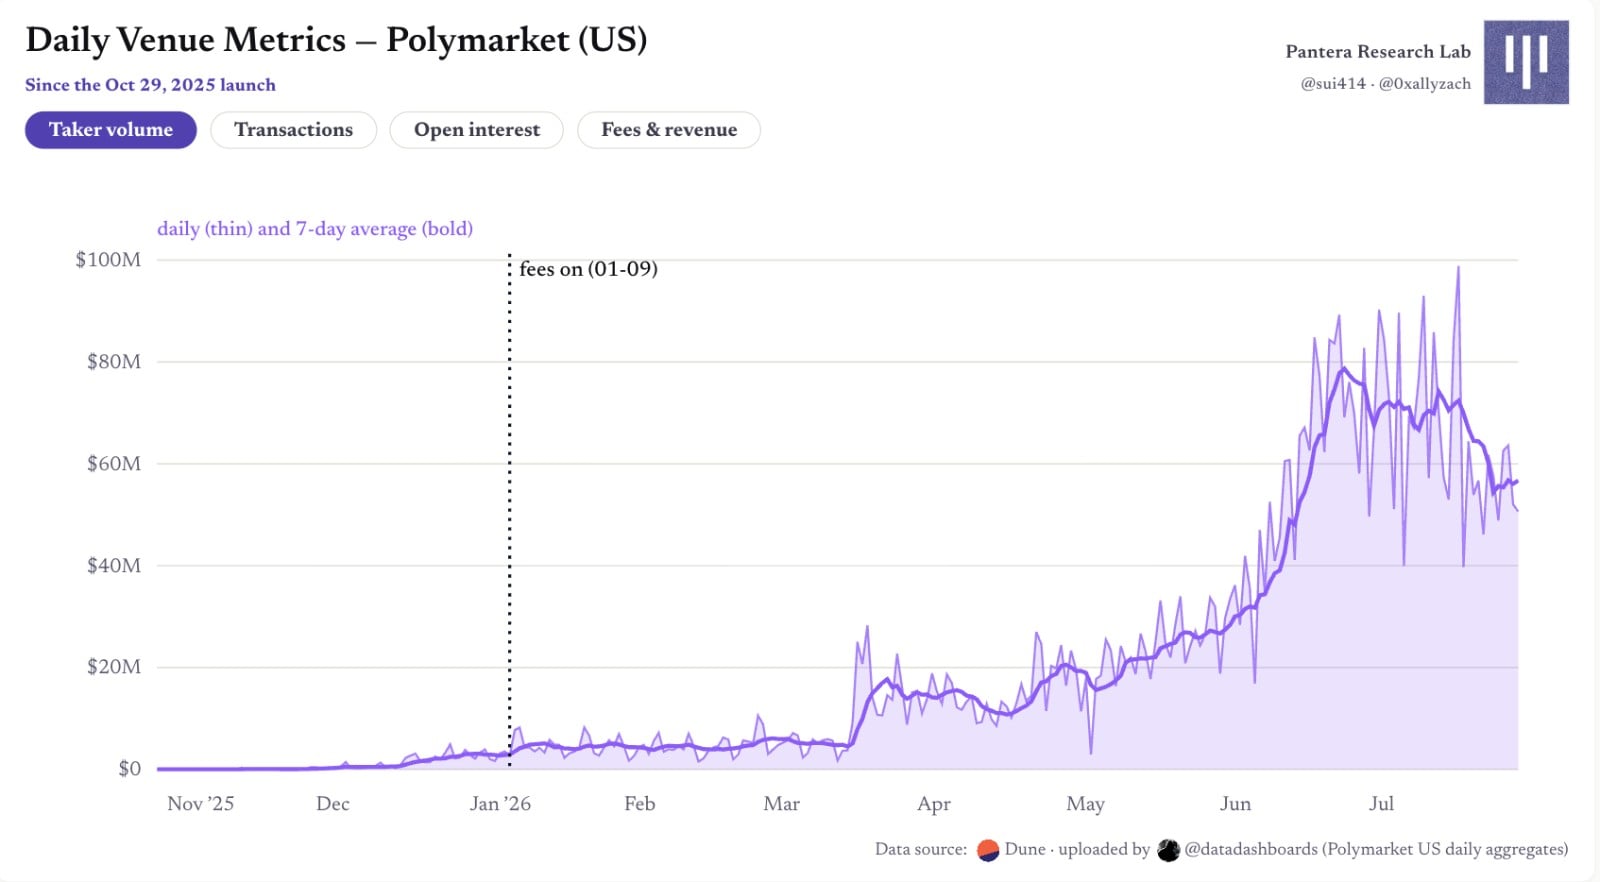
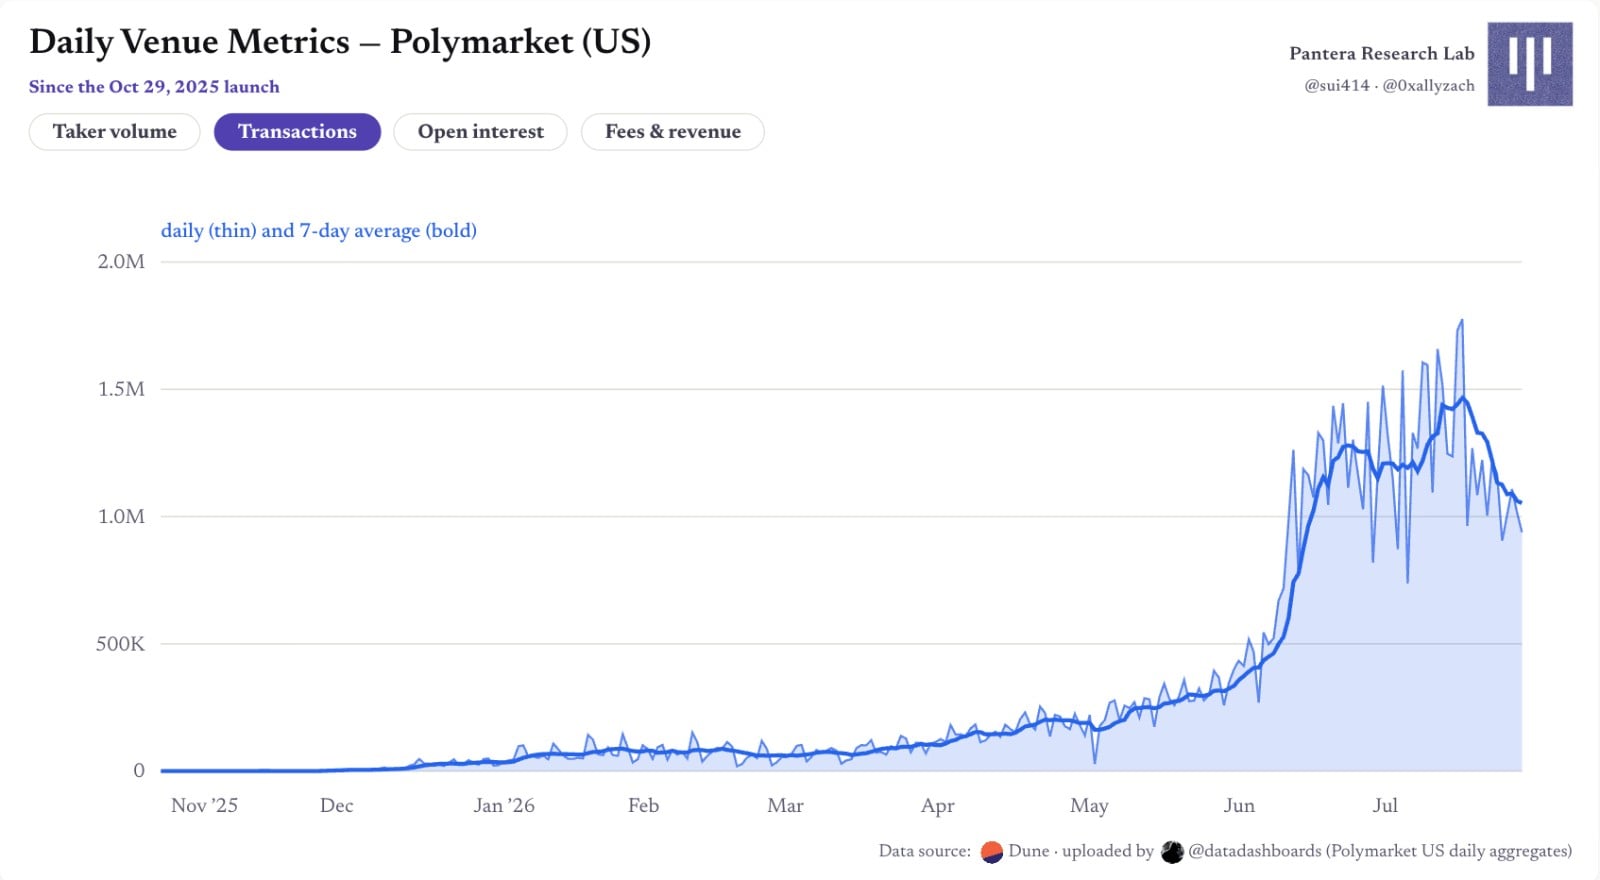
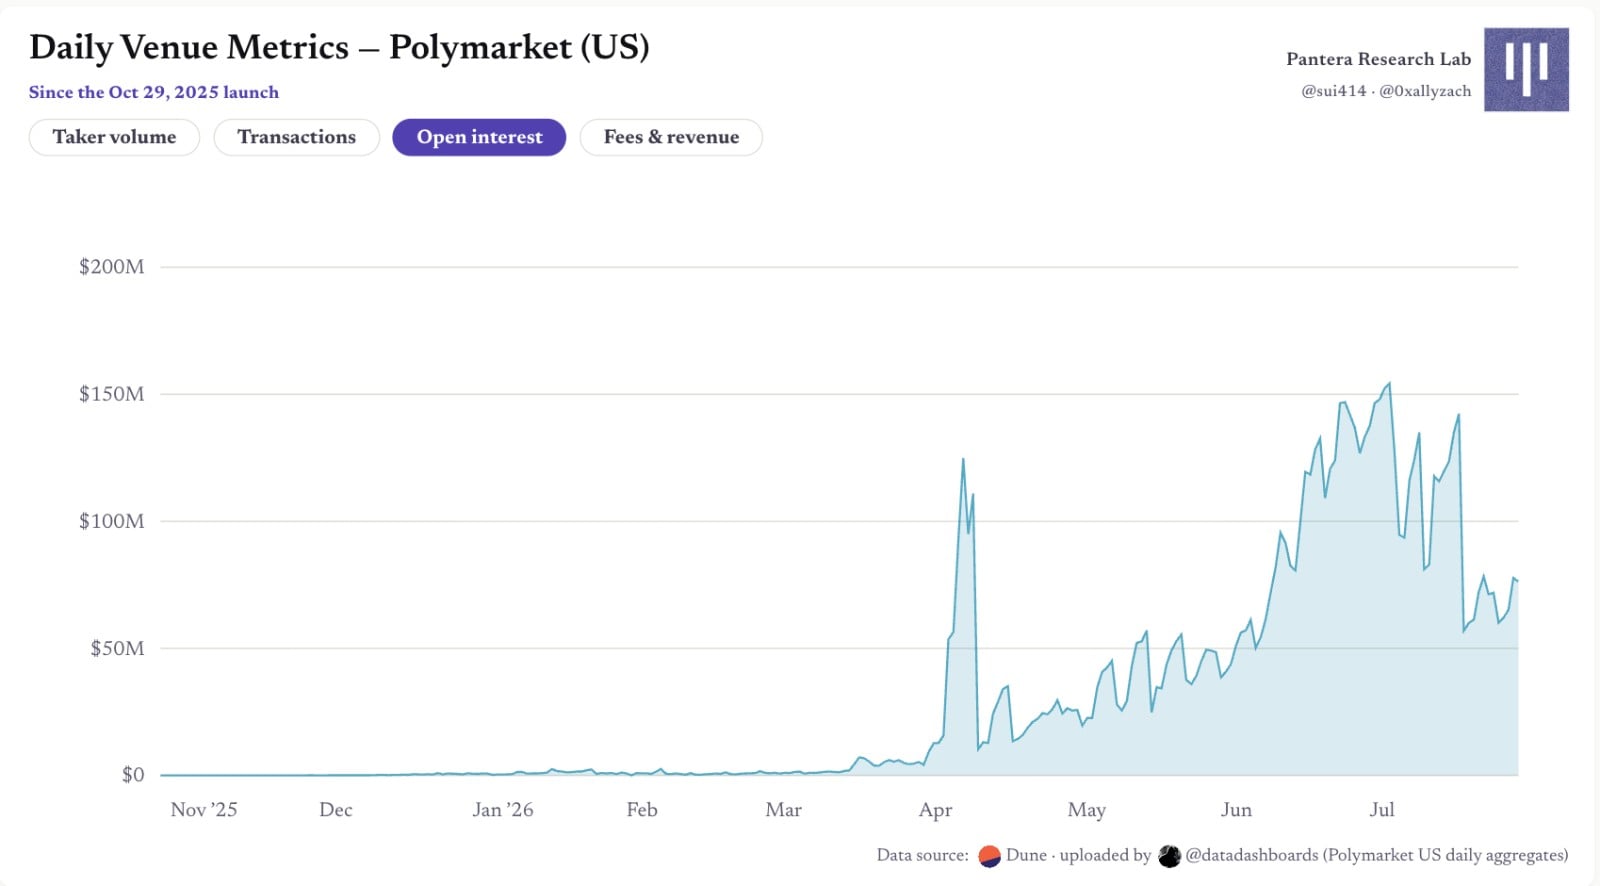
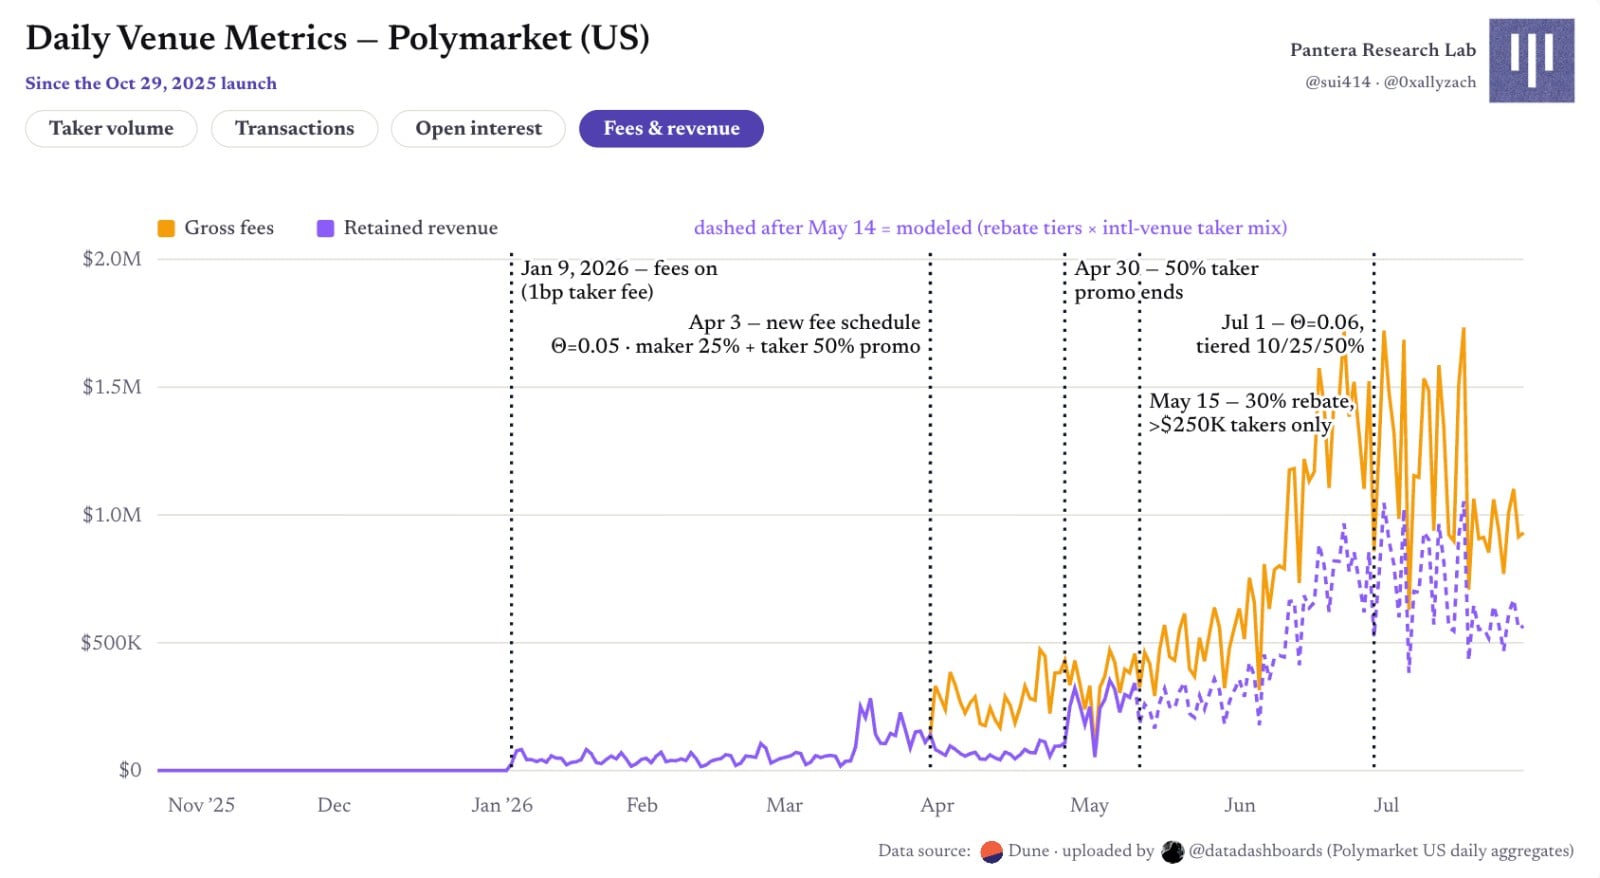
Figure 2 | Polymarket US: Daily venue-level metrics since launch
Fee scales are also larger than estimated by community datasets: In June alone, taker gross fees reached roughly $30 million. Based on the official rebate plan—which returns 25% to makers upon execution, ended a full-taker promotion rebate on April 30, and now tiers rebates by volume—June retained revenue was approximately $17 million, roughly double the fixed 25% assumption used by many trackers. With no user-level data for the US market, tiered qualification for large takers relies on referencing the international market's structure where the top 0.3% of takers contributed about 63% of volume.
The Fee Economics of the International Market
What exactly is traded in the international market? Sports account for about half of total volume; crypto accounts for roughly 30%, predominantly consisting of five-minute binary up/down micro-markets; World/Geopolitics accounts for about 15%. Concentration varies widely by category: the largest sports market represents only 0.27% of its category, whereas in Science & Technology, a single market on "Will the US confirm alien existence before 2027?" captures about a quarter.
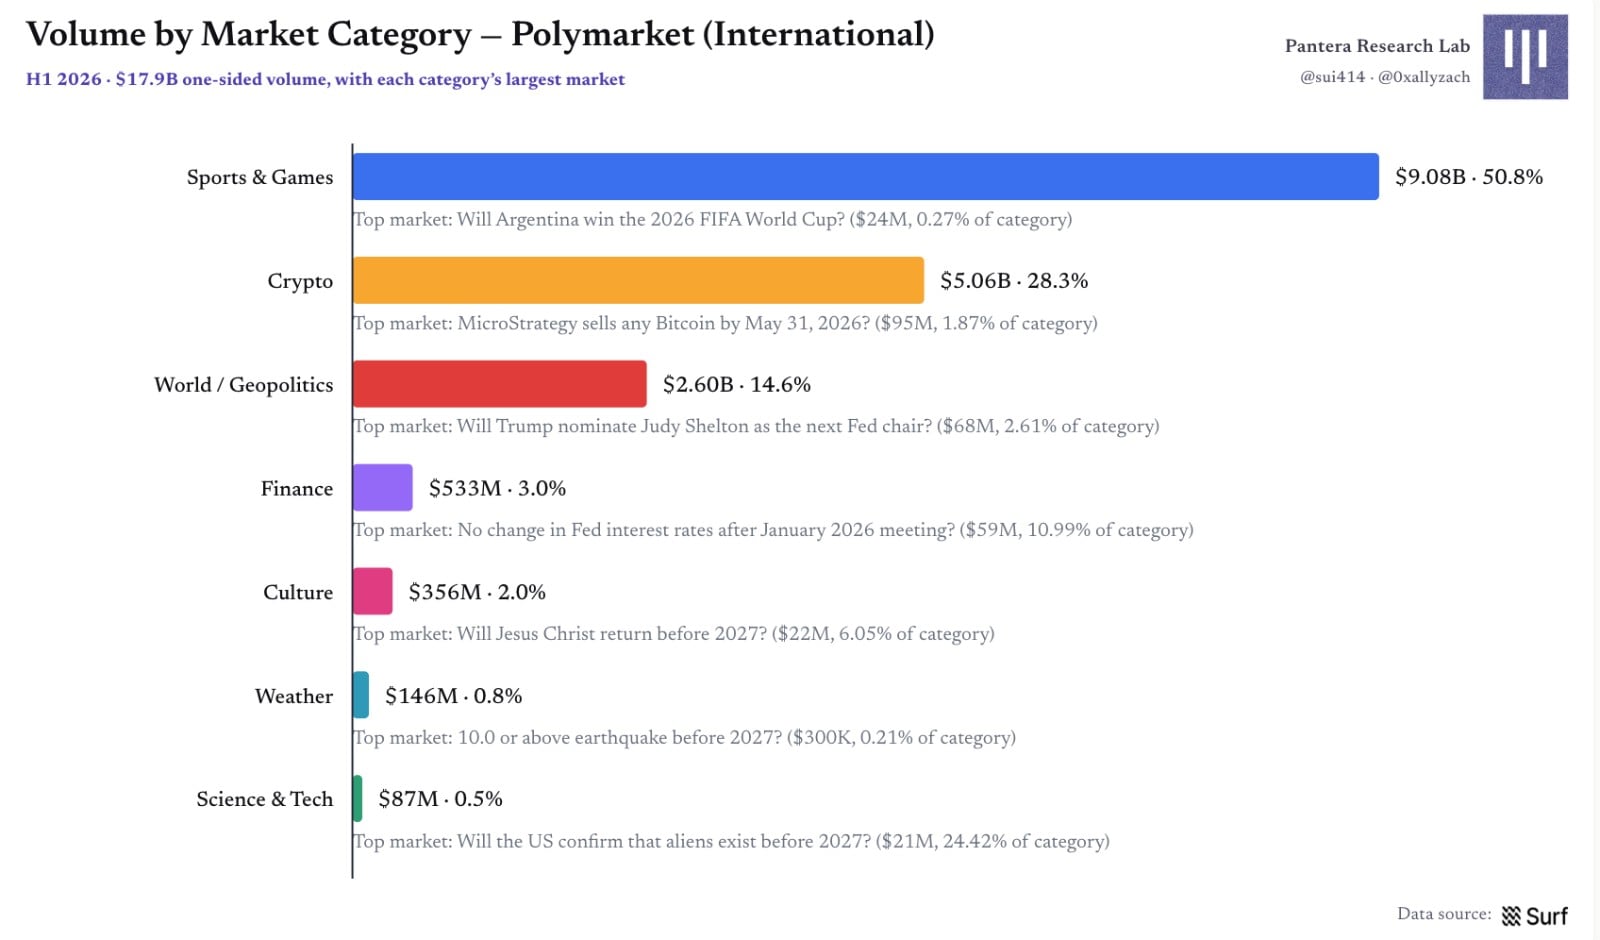
Figure 3 | Polymarket International Market: Volume split by market category
The international market generated roughly $184 million in gross fees in H1, but this is not net revenue after deducting maker rebates and incentives. Despite having about half the volume of sports, the crypto market generated $96.3 million in fees, surpassing sports' $83.5 million; these two categories combined represent 98% of total fees. World/Geopolitics employs a deliberate zero-fee strategy.
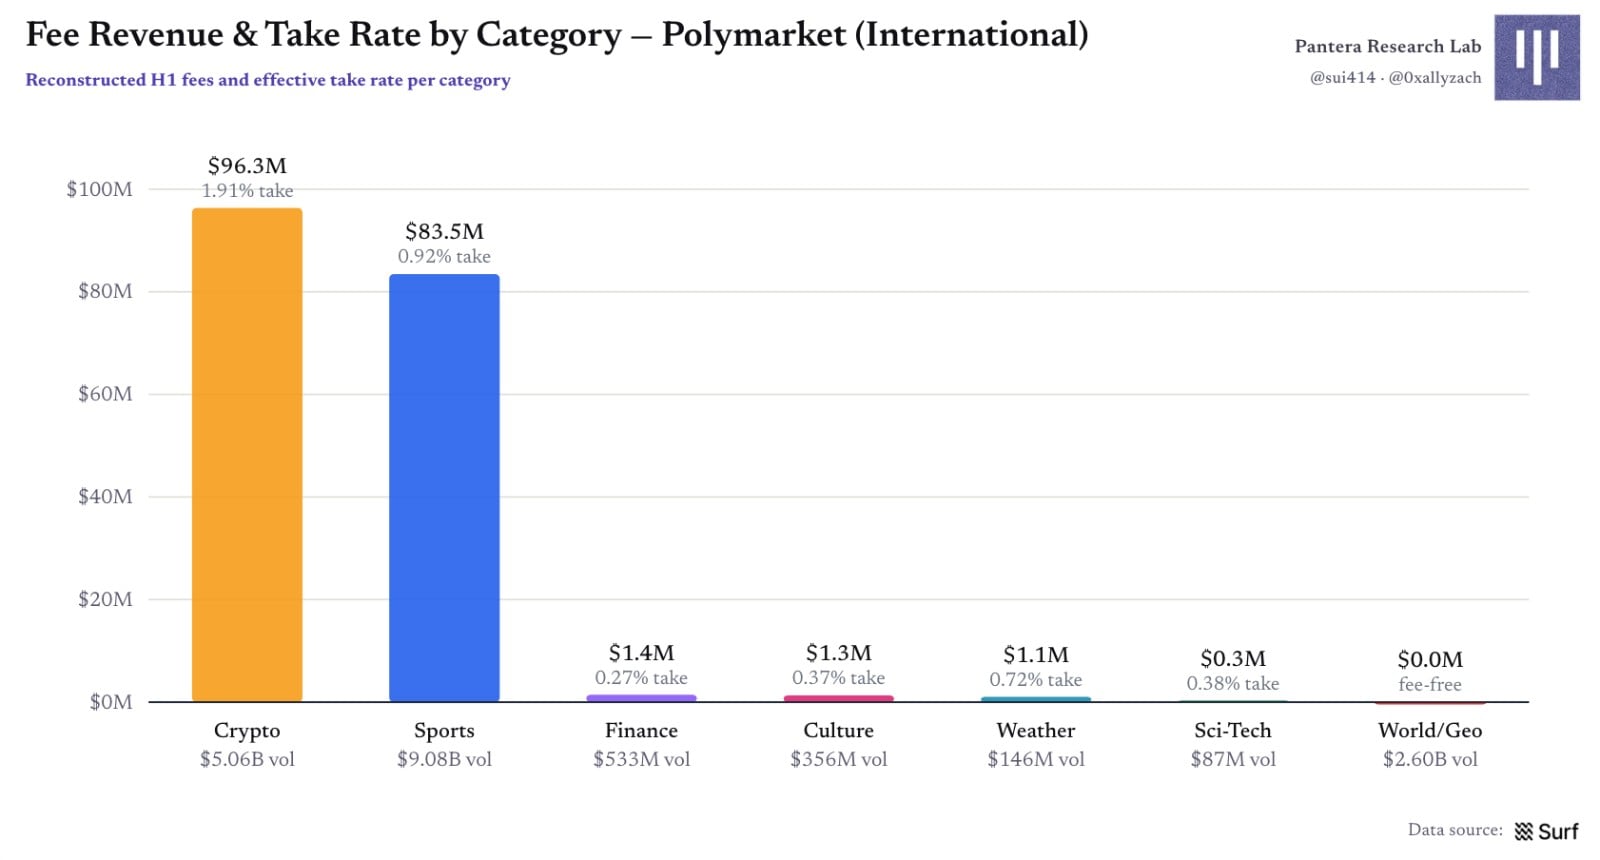
Figure 4 | Polymarket International Market: Category-level fee revenue and effective take rate
High-Turnover Categories Are the Fee Engines
In July, Kalshi's open interest was roughly 2.3 times that of Polymarket's International Market, but its volume was about 4.4 times larger; corresponding daily turnover rates were roughly 0.44× vs. 0.23×. Polymarket US has the smallest capital pool yet runs the fastest with a daily turnover rate of roughly 0.64×. The answer lies not in the platform name, but in what the market directory consists of.
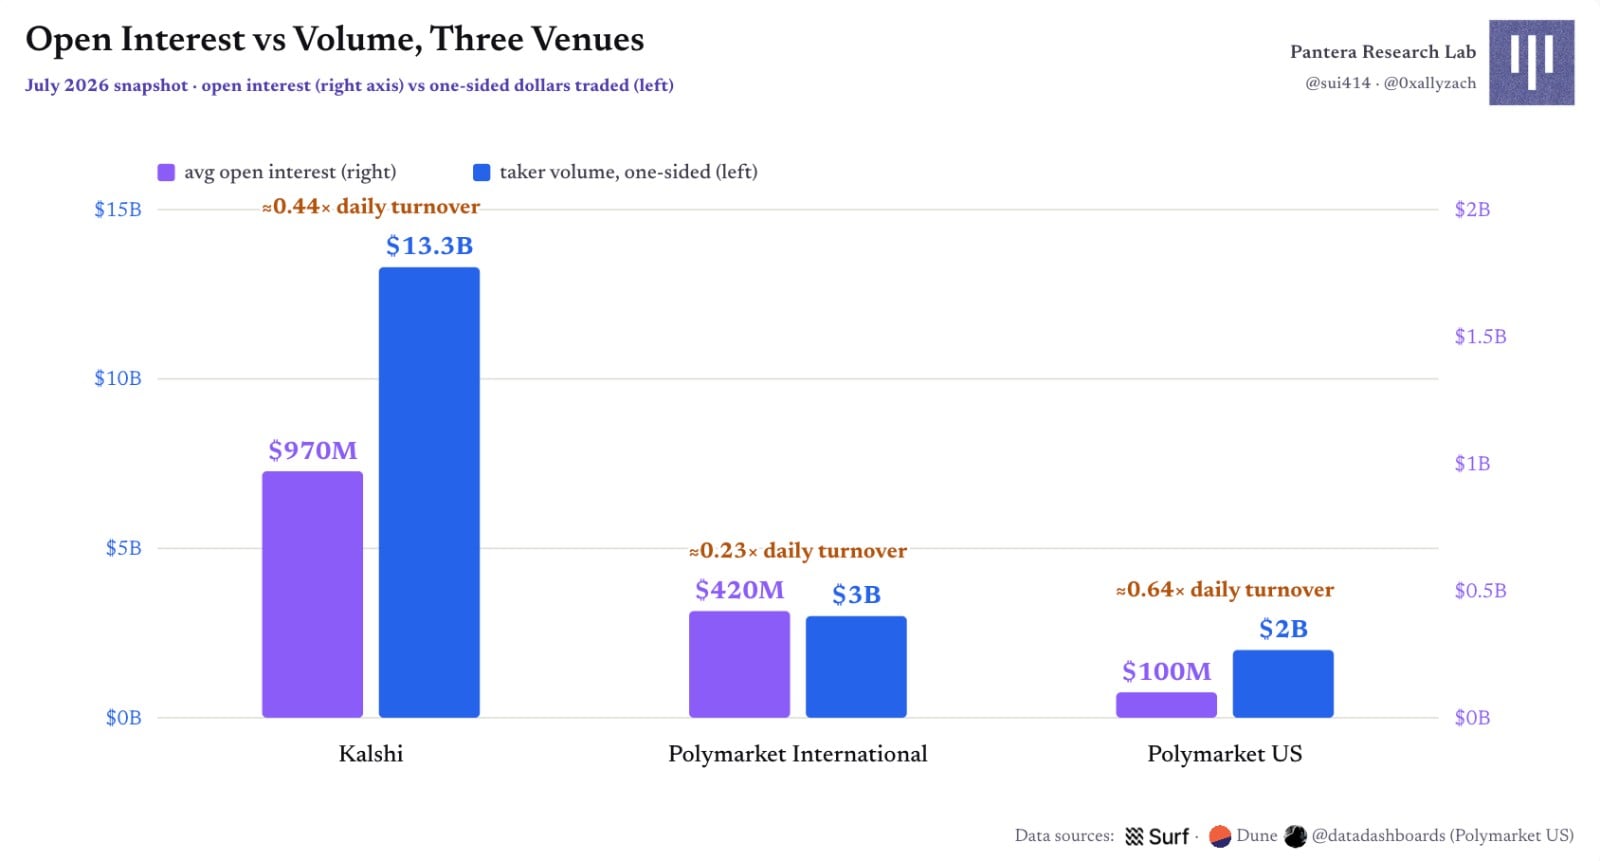
Figure 5 | Open interest and volume across three markets: Capital size does not equal fund velocity
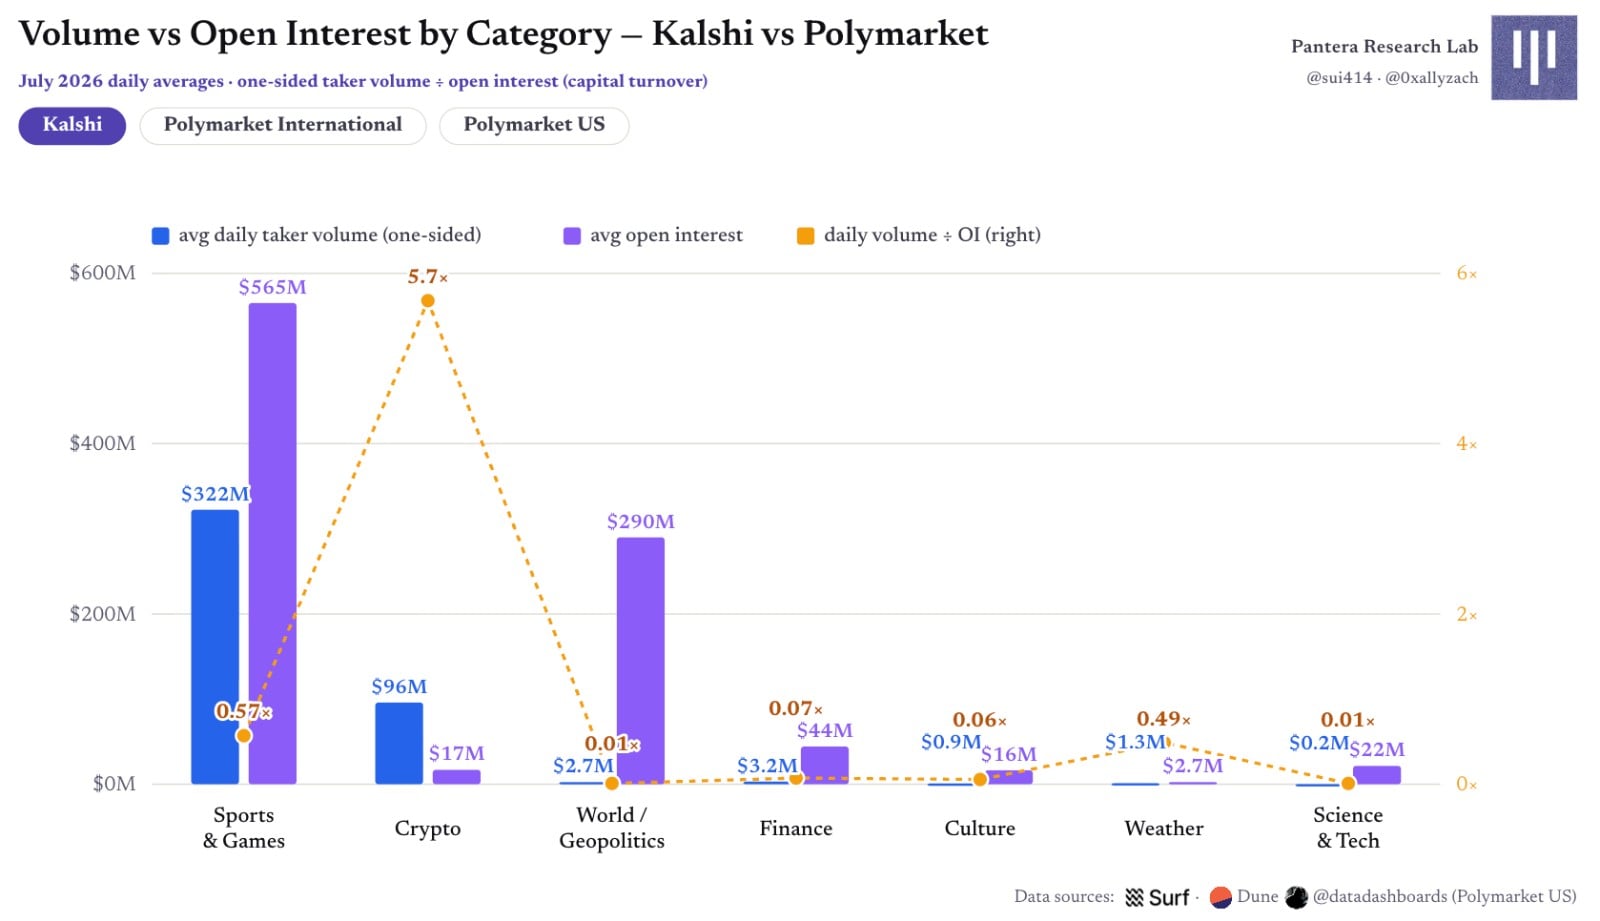
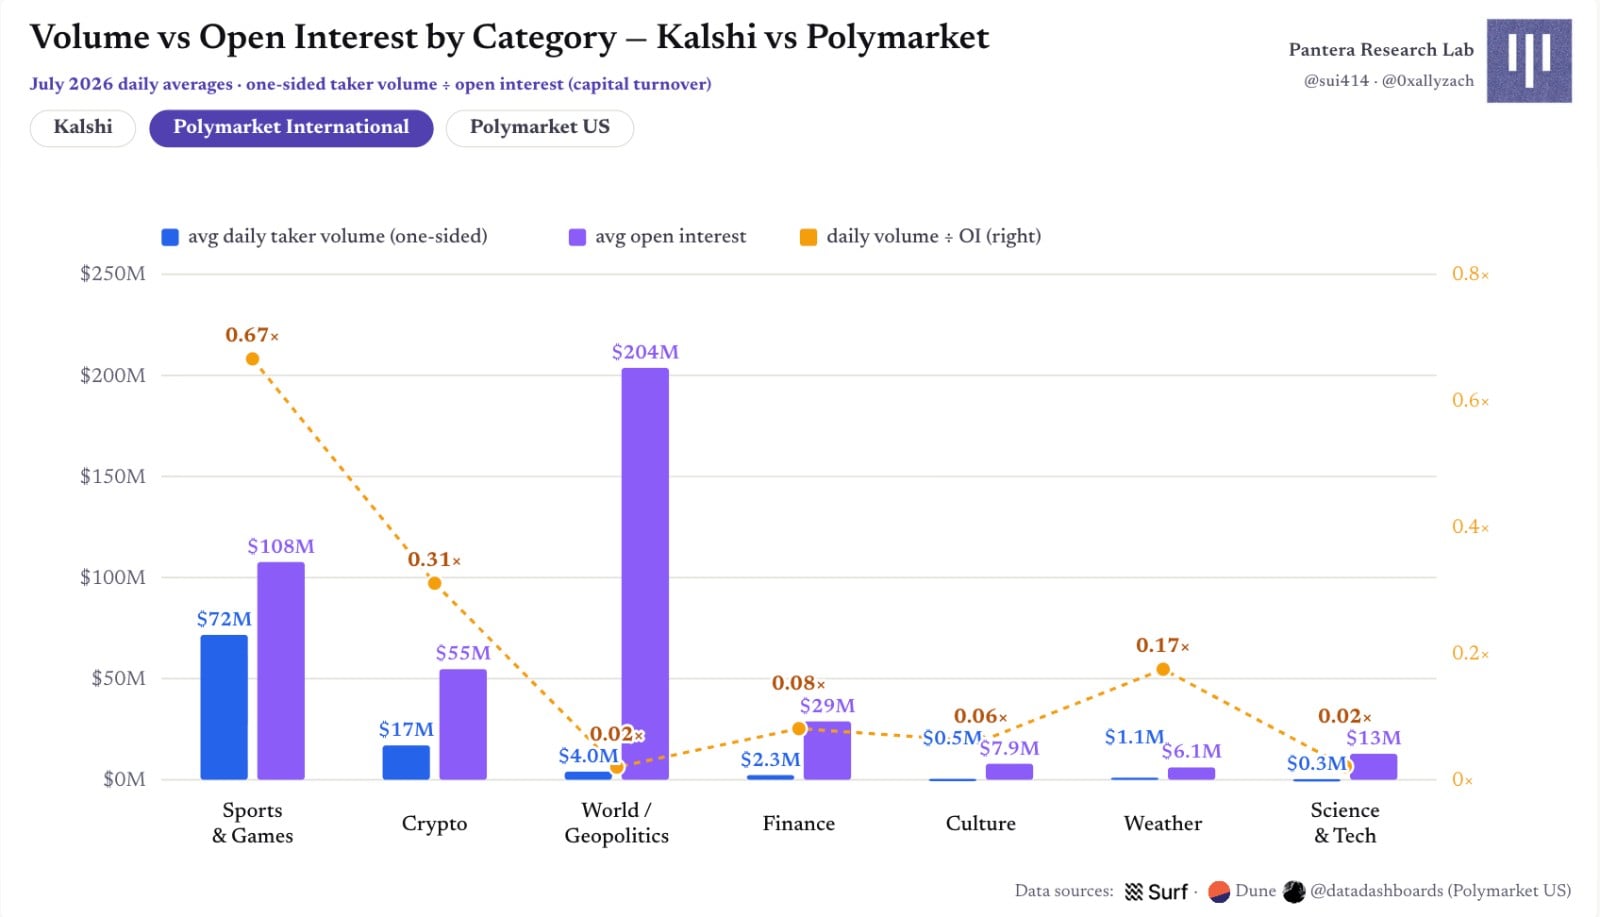
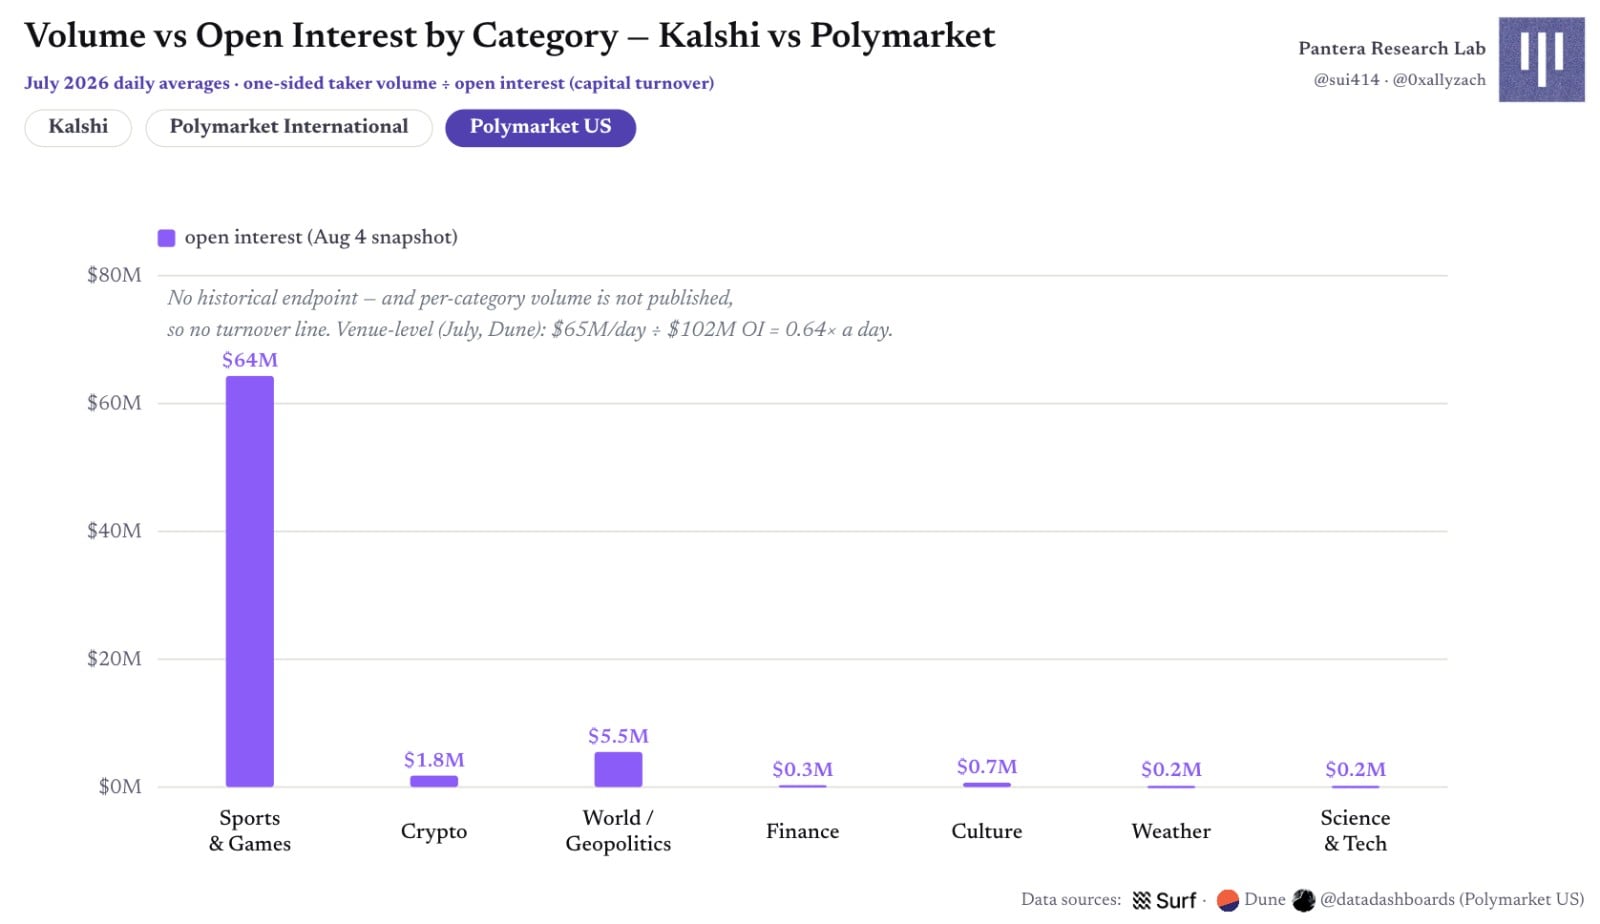
Figure 6 | Comparing Kalshi and Polymarket volume/open interest by category
Sports and crypto are the highest-turnover categories, while World/Geopolitics is the slowest, with daily turnover of only about 0.01–0.03×. Each international market has roughly $200M–$300M in idle capital yet only prints $2M–$3M in daily volume, leading them both to set zero fees for this category. About 88% of Polymarket US's open interest is concentrated in sports, explaining how it achieves higher turnover with less capital.
Kalshi's crypto market is a clear outlier: roughly $17M in open interest corresponds to $96M in daily volume, yielding a daily turnover nearing 6×, with 98% of markets expiring within one hour. Polymarket's crypto turnover appears lower at 0.31× because long-dated threshold markets absorb most of the open interest, while five-minute up/down markets comprise ~90% of volume but lock almost no capital; each such market locks an average of only ~$2,800 in collateral.
Categories tend toward similar speeds across platforms: Sports show daily turnover rates of roughly 0.57× on Kalshi, 0.67× on Polymarket International, and 0.64× on Polymarket US. This reflects category attributes rather than platform attributes.
Part 2: User Growth on Polymarket International
The following user analysis covers only Polygon CTF / NegRisk contracts on the International Market, spanning January 1 to June 30, 2026. Polymarket US and Kalshi settle on internal ledgers, with public trade flows anonymized, making equally deep wallet profiling impossible.
Makers vs. Takers: Different Groups on Opposite Sides of the Order Book
1,733,011 wallets traded on the International Market in H1. Almost every wallet consumed liquidity at least once actively, but fewer than half ever placed a limit order. The maker side is noticeably more professional and smaller; the top 1,000 makers provided most static liquidity. Demand is similarly concentrated: roughly 6% of high-activity wallets executed 80% of taker volume, while a third of wallets traded five times or less over six months.
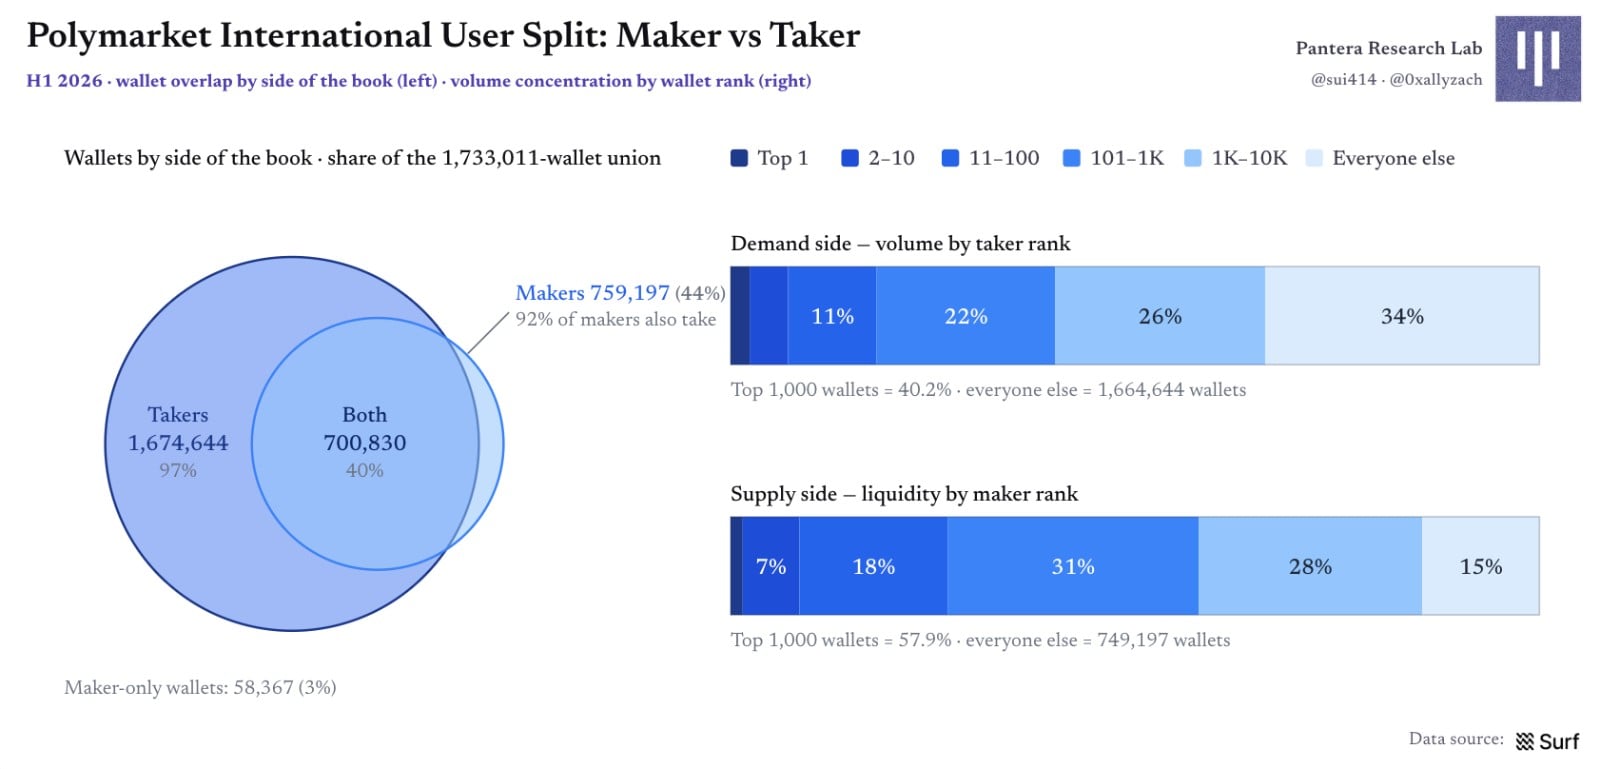
Figure 7 | Wallet structure of Polymarket International: Overlap and concentration between Makers and Takers
User Growth Accounting: Activity Nearly Flatlined
User growth is even less optimistic than volume: Monthly active wallets hovered flat from 580k in January to 594k in June, despite roughly 1.1 million wallets making their first trade. Each month, 43%–49% of previous-month active wallets stopped trading, with churn peaking at 358k in April, requiring continuous inflow of new and returning wallets to fill the funnel.
Three important caveats apply here. Wallets do not equal users; some so-called churn may simply be users switching to new wallets; and our churn metric only denotes wallets stopping transactions, not closed accounts or drained balances.
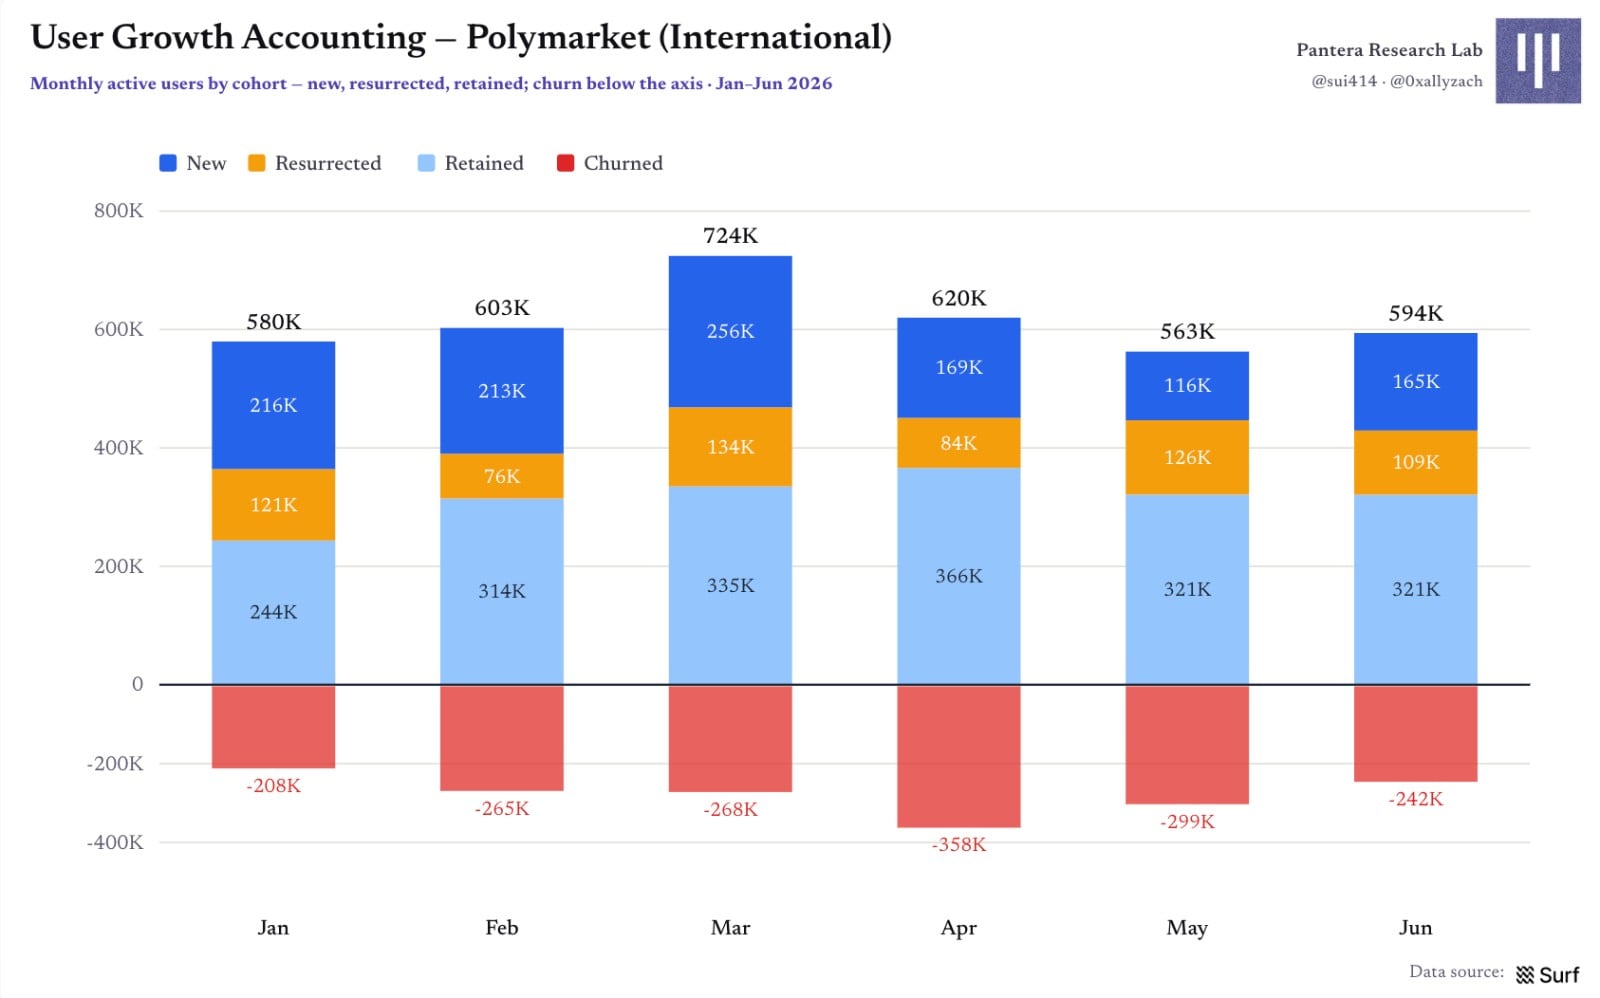
Figure 8 | User growth accounting: New users, returning users, retained users, and churn
Where Do New Users Come From: Not a Single-Point Explosion
When attributing each new wallet to its first-touch market, we see seasonality in acquisition engines: crypto peaked at ~99k new wallets in March, geopolitics at ~68k in January, and sports hit ~91k during the June World Cup kickoff. Events create peaks, but no single market carries all acquisition.
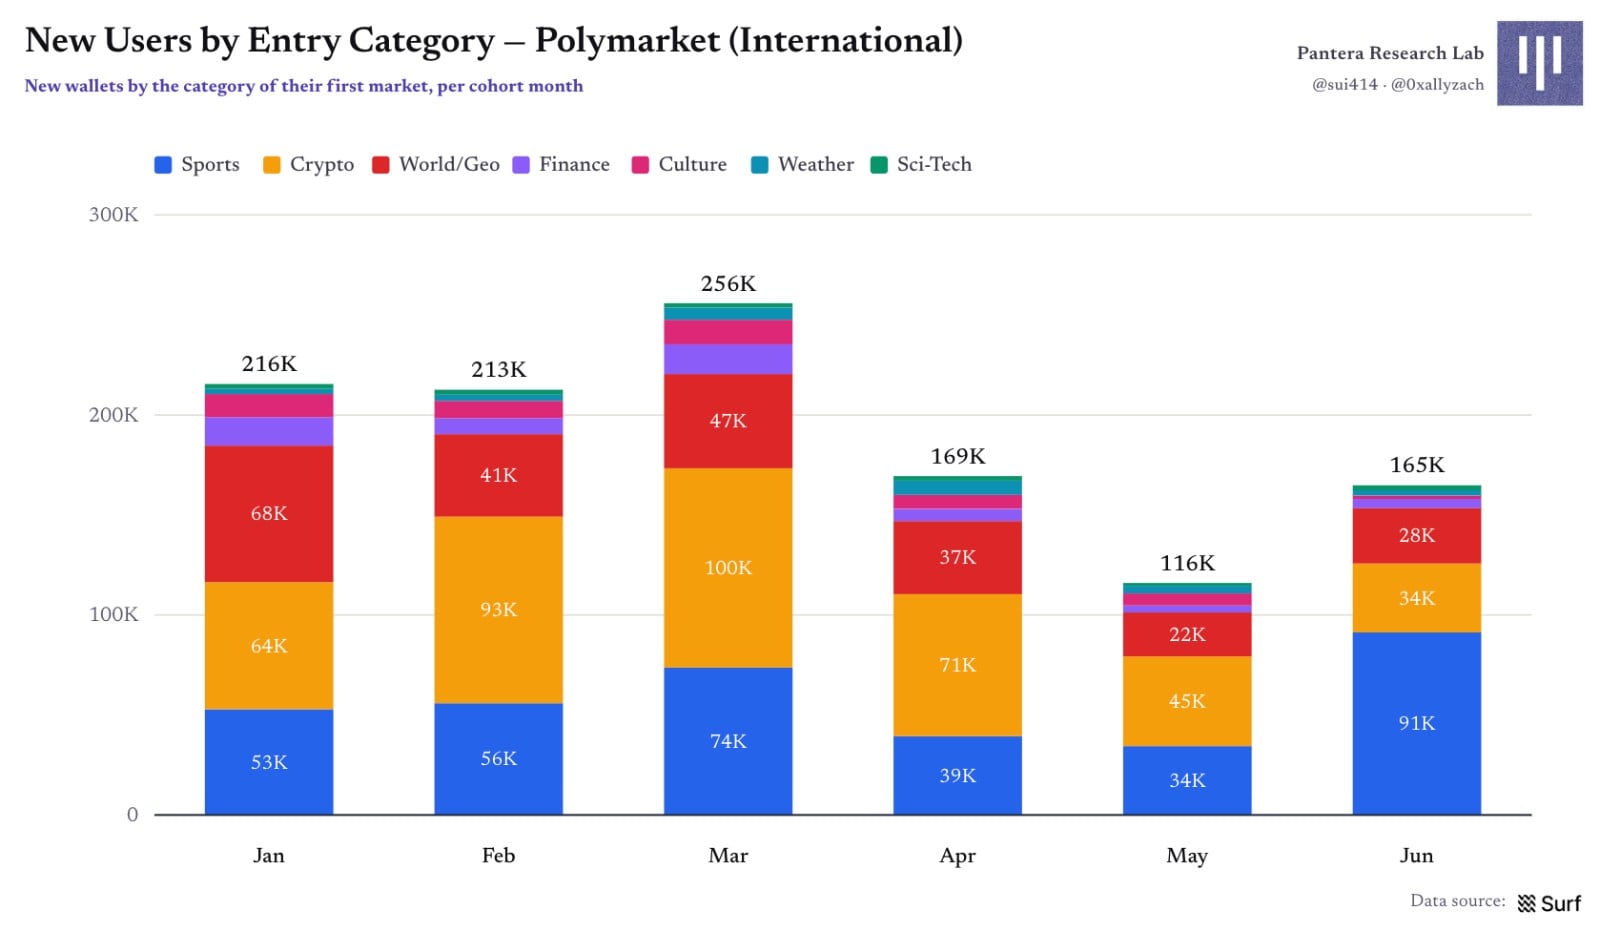
Figure 9 | New wallets by first-entry category
The strongest single traffic driver in H1 was "Will China invade Taiwan before the end of 2026?", yet it only brought ~7,000 new wallets. The top ten includes geopolitics, World Cup, interest rates, and cultural events, indicating effective acquisition comes from a market mix, not a single blockbuster.
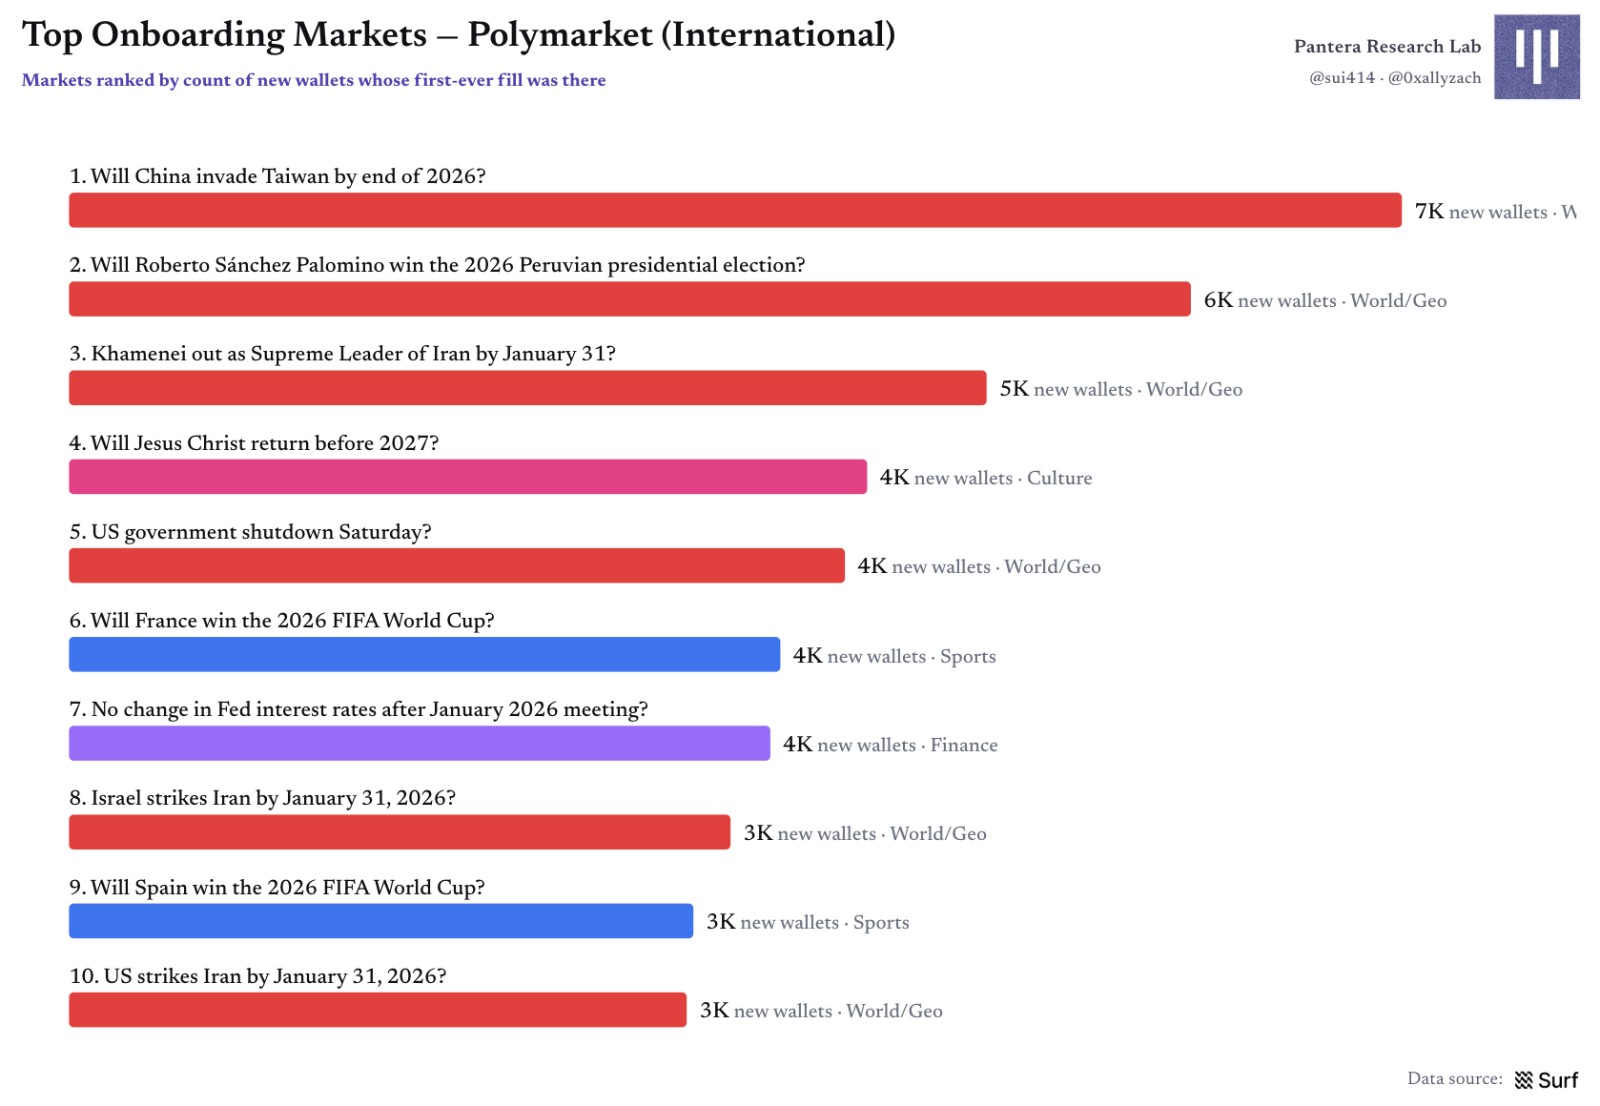
Figure 10 | Top 10 traffic-driving markets generating the most new wallets in H1
On a monthly basis, the top 15 drivers accounted for only 8%–19% of new wallets, with the number one never exceeding ~3%. Highest concentration occurred in January and June, corresponding to Iran news, Taiwan markets, and the World Cup.
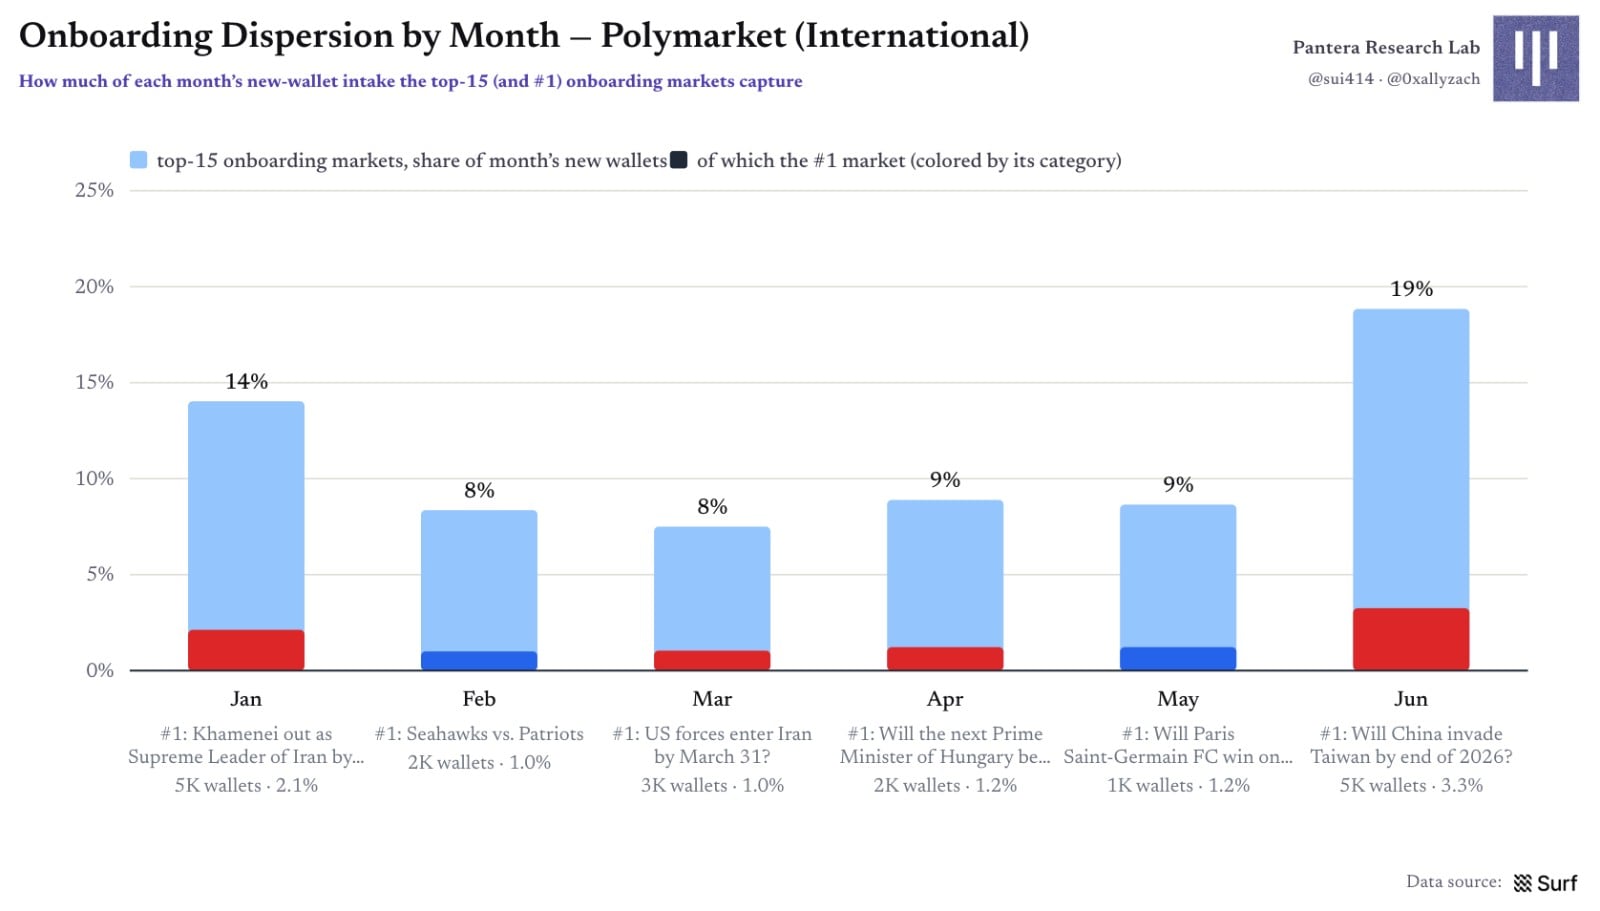
Figure 11 | Monthly acquisition dispersion: Contribution of top 15 markets vs. #1 market
Retention: Users Stay on Platform, Not Necessarily in Original Category
About half of monthly active wallets return the next month, yielding platform monthly retention of 51%–57%; loyalty to a specific category is clearly weaker. Users may leave the category they entered on, only to reappear in another, suggesting cross-category recommendations and cross-selling are likely at work.
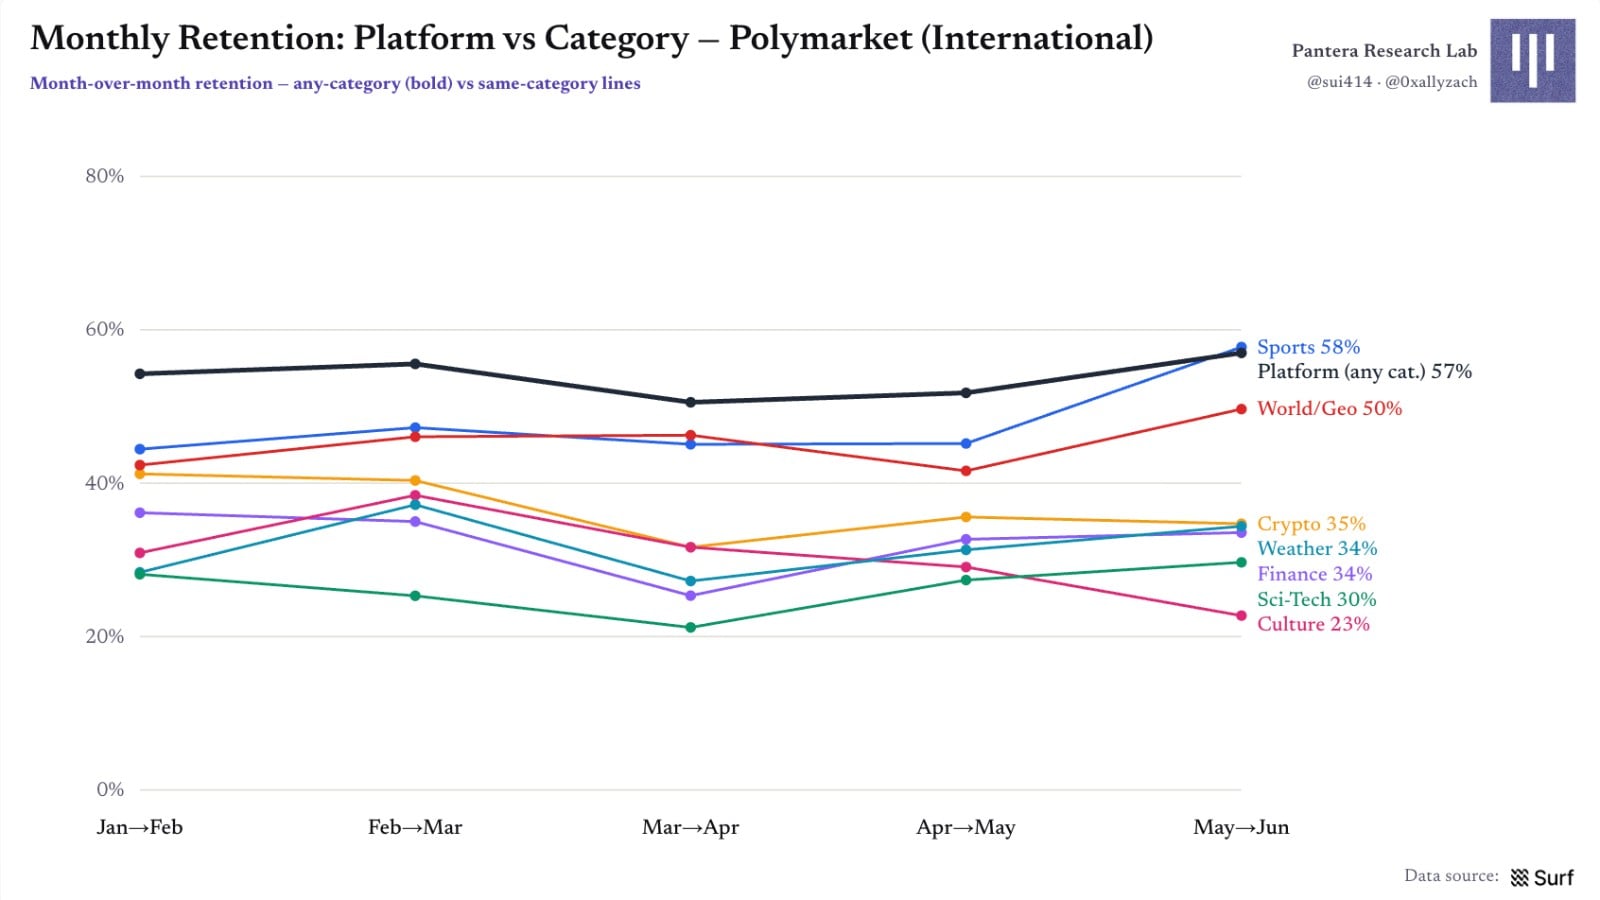
Figure 12 | Comparison of platform retention vs. category retention
One-month retention for different entry categories clusters tightly between 44%–49%, with three-month retention around 25%–32%. The only notable low point is crypto entry at ~37%, roughly 30% lower than others; a possible explanation/speculation is that automated operations in crypto trading more frequently rotate new wallets, artificially depressing surface retention rates.
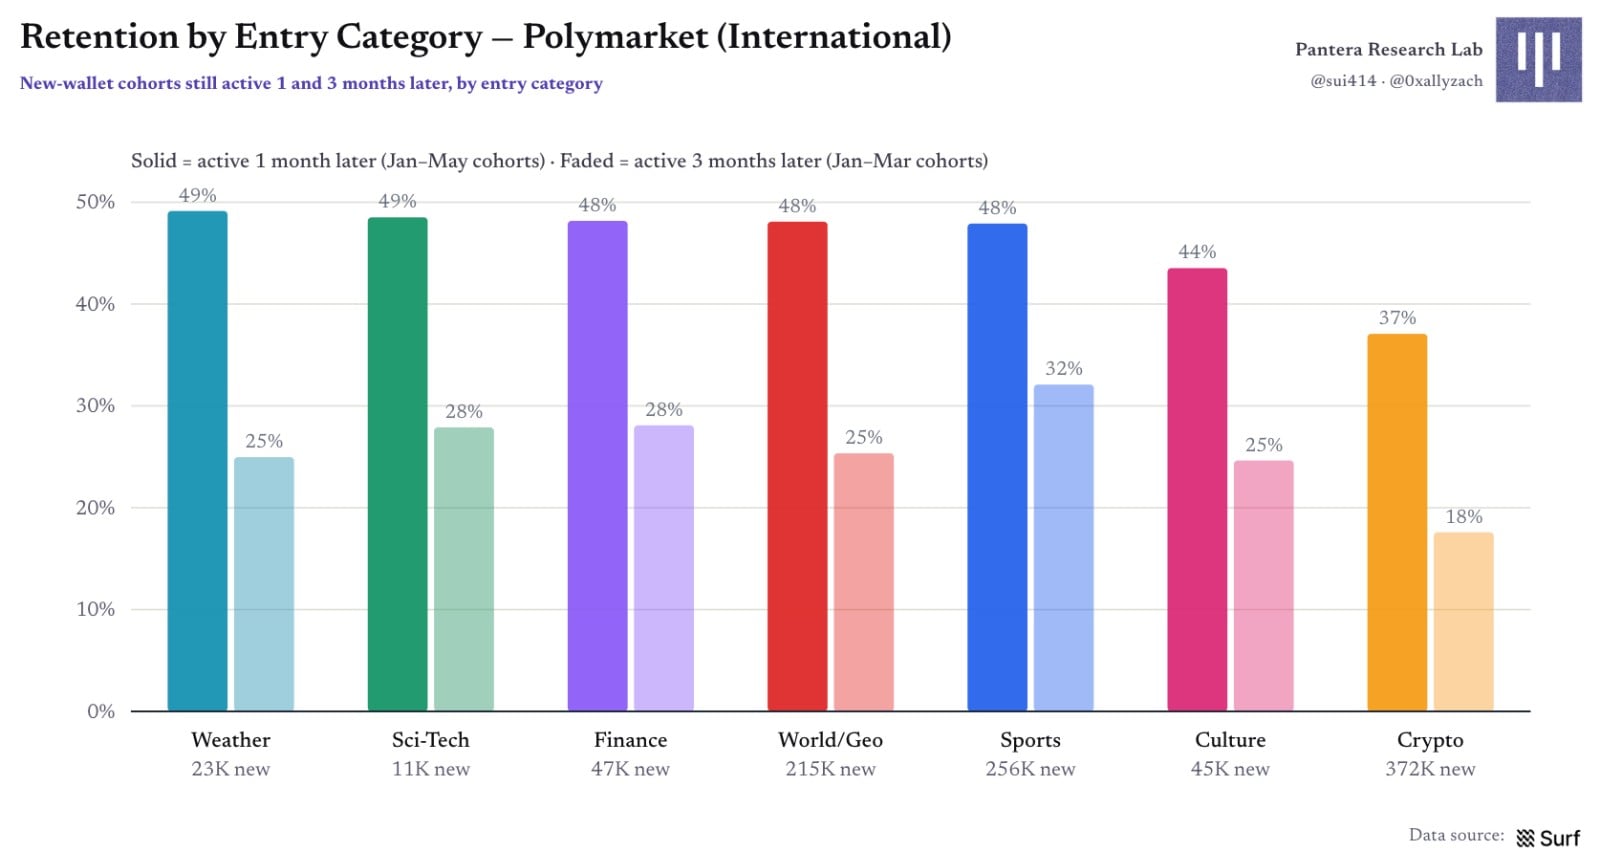
Figure 13 | New wallet retention compared by entry category
User Market Participation Category Matrix: Geopolitics as the Connector Layer
Diagonal cells indicate independent wallets per category, while off-diagonal percentages show the proportion of smaller-category users simultaneously trading another category. Though sports and crypto are the largest user groups, their overlap is only 49%, representing distinctly different audiences. Overlap between World/Geopolitics and other categories is generally higher (excluding weather), acting as a core product layer connecting various platform interests.
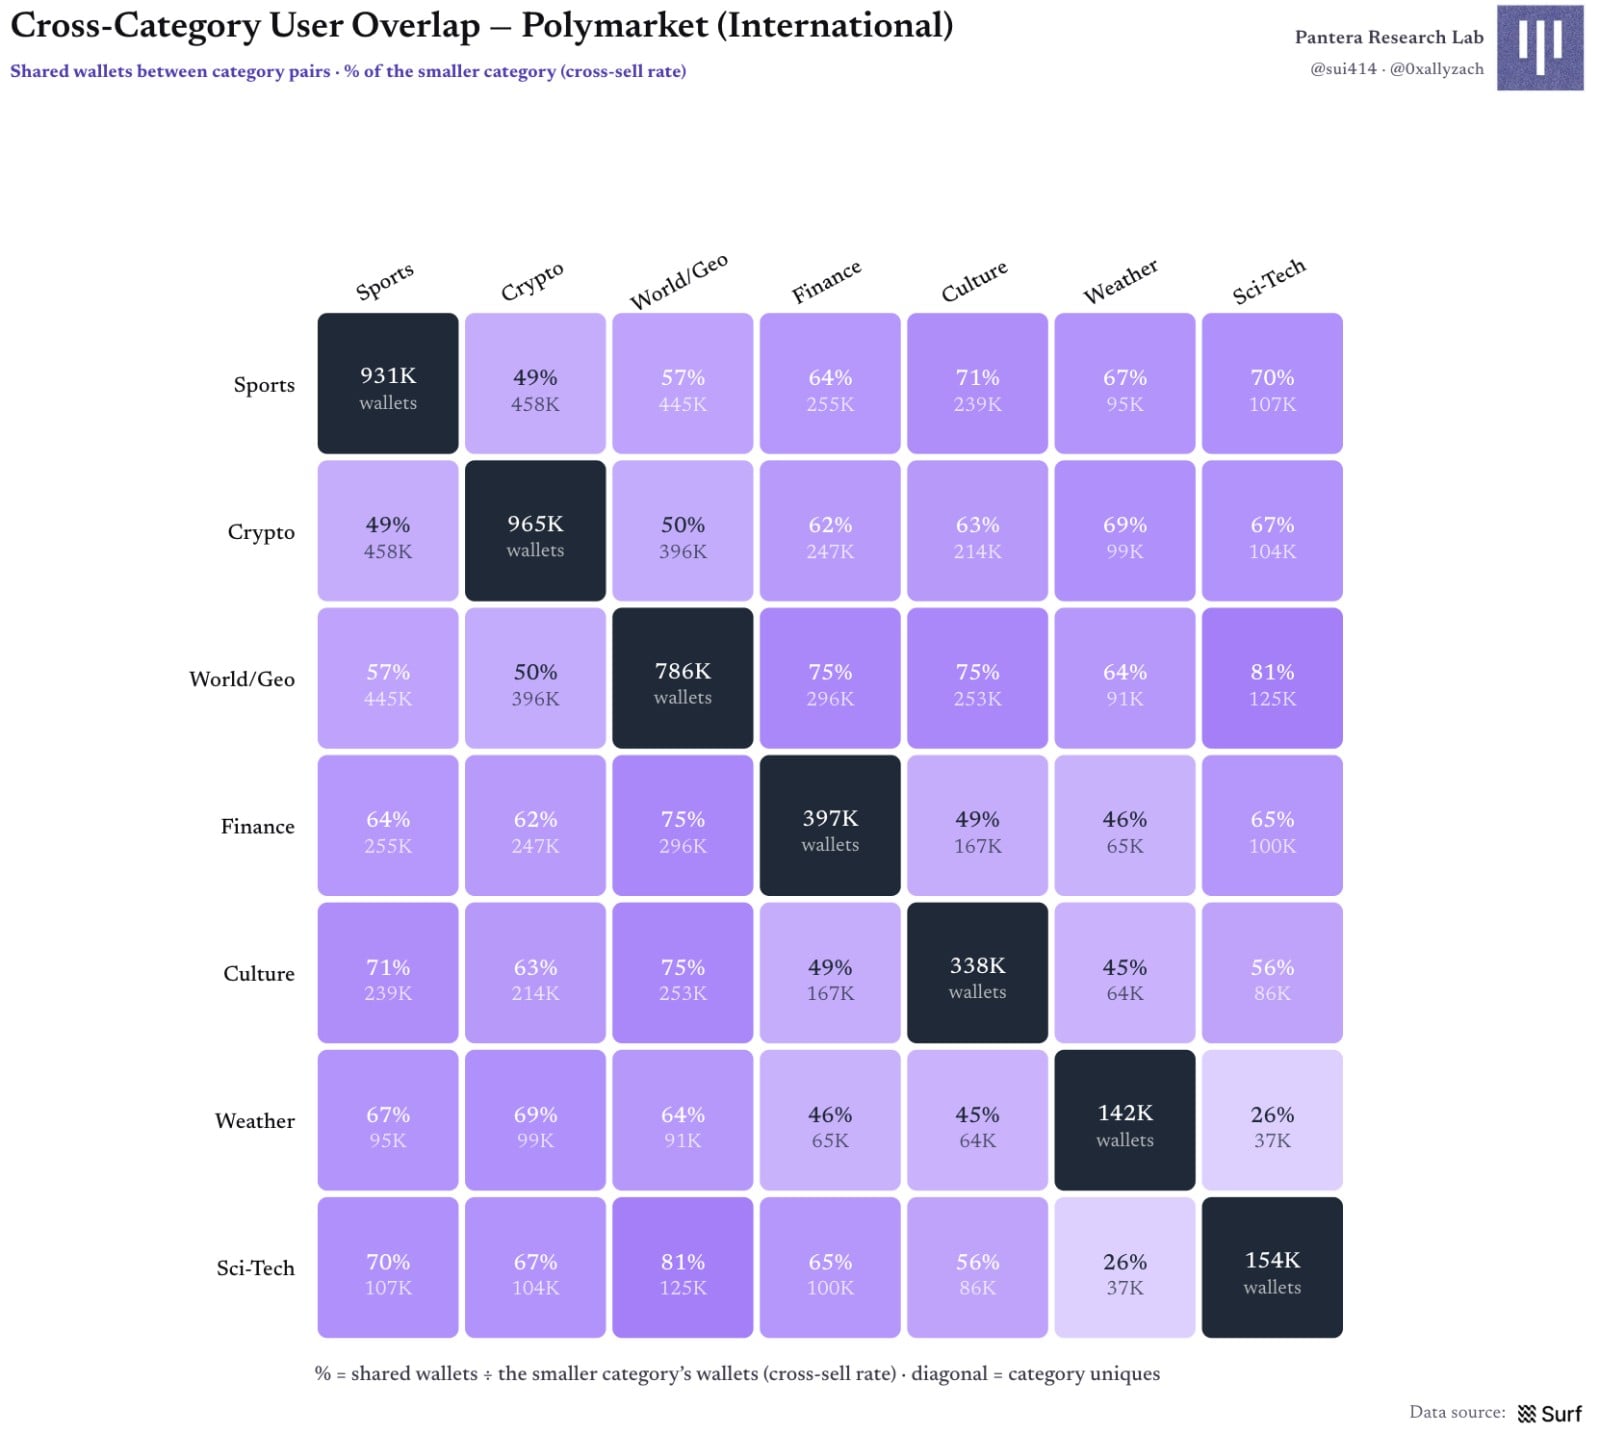
Figure 14 | Cross-category user overlap and cross-sell rates
User Category Stickiness × Expansion Plot: Different Entrances Acquire Users of Varying Quality
Plotting entry retention against cross-category expansion, the six categories cluster in a 43%–49% loyalty band, but differ in expansion capacity: sports resemble stable home-court users, while science & technology attracts users who explore an average of 3.6 other categories. Crypto sits in the bottom-left: ~37% one-month retention and lowest expansion. Five-minute casinos generate volume, not long-term retention or cross-category exploration.
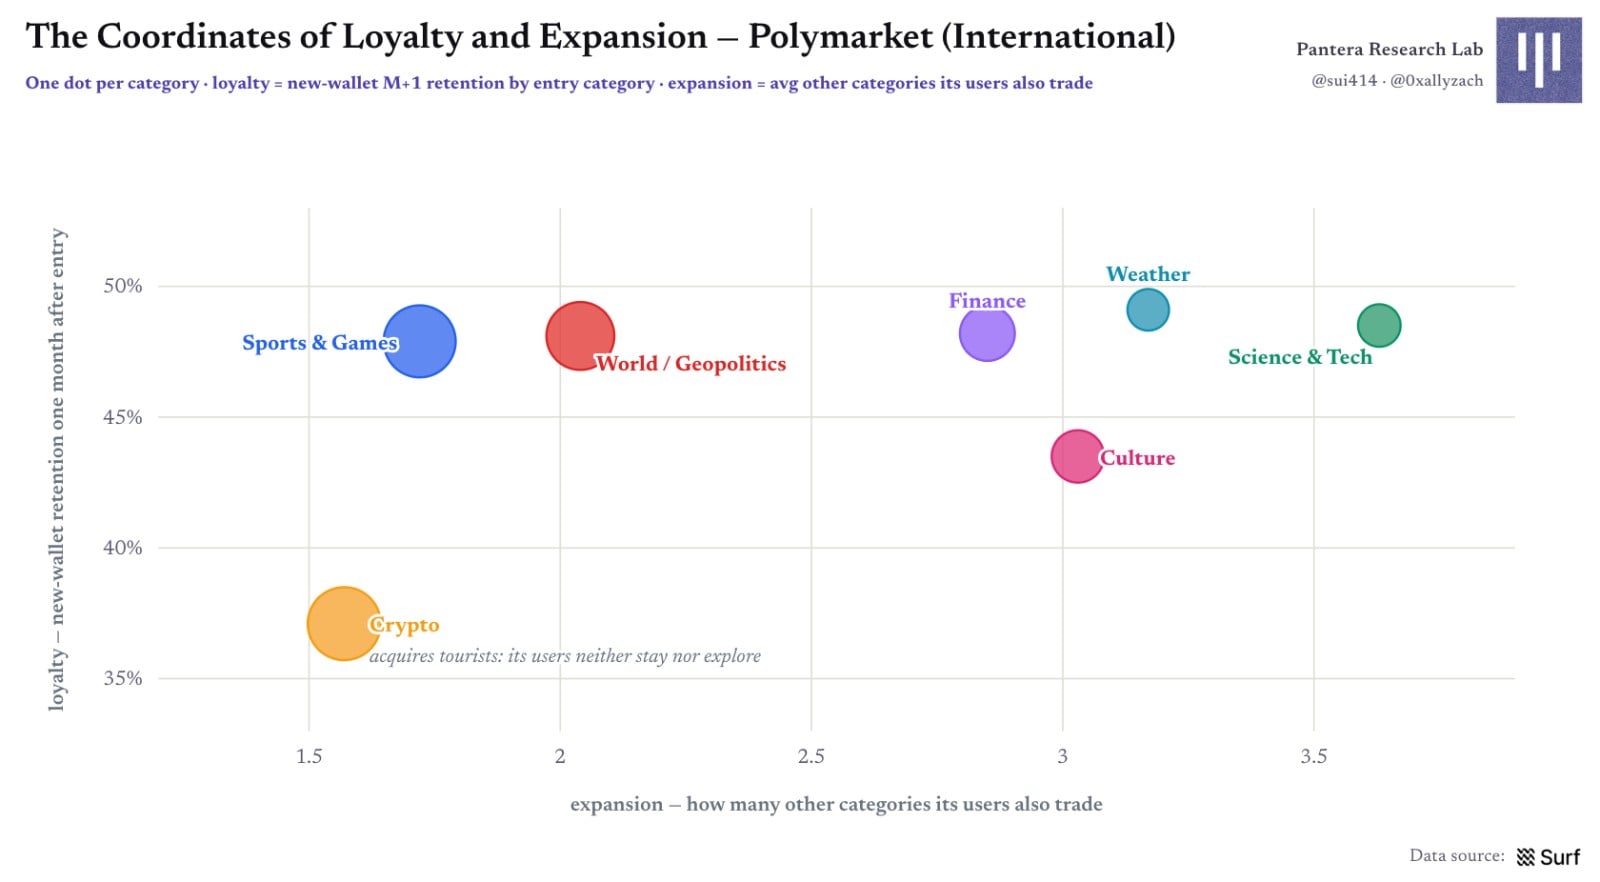
Figure 15 | Coordinates of each category on 'Stickiness × Expansion'
Part 3: Market Microstructure: User Profiling, Entry Timing, and Profitability
User Profiling Distribution: Category Breadth and Frequency Correlate with Trade Size
We profile users across three dimensions: category coverage, trade size per ticket, and trading frequency. Broader category coverage correlates with higher average wallet volume; wallets covering all seven categories constitute only ~1%, yet average H1 taker volume of ~$59k per user is seven times that of pure single-category wallets ($8,300).
Frequency dimensions show a classic 80/20 split: roughly 6% of 'high-frequency users' contribute 79% of volume, while visitor-type wallets making only one trade account for ~8% of the base.
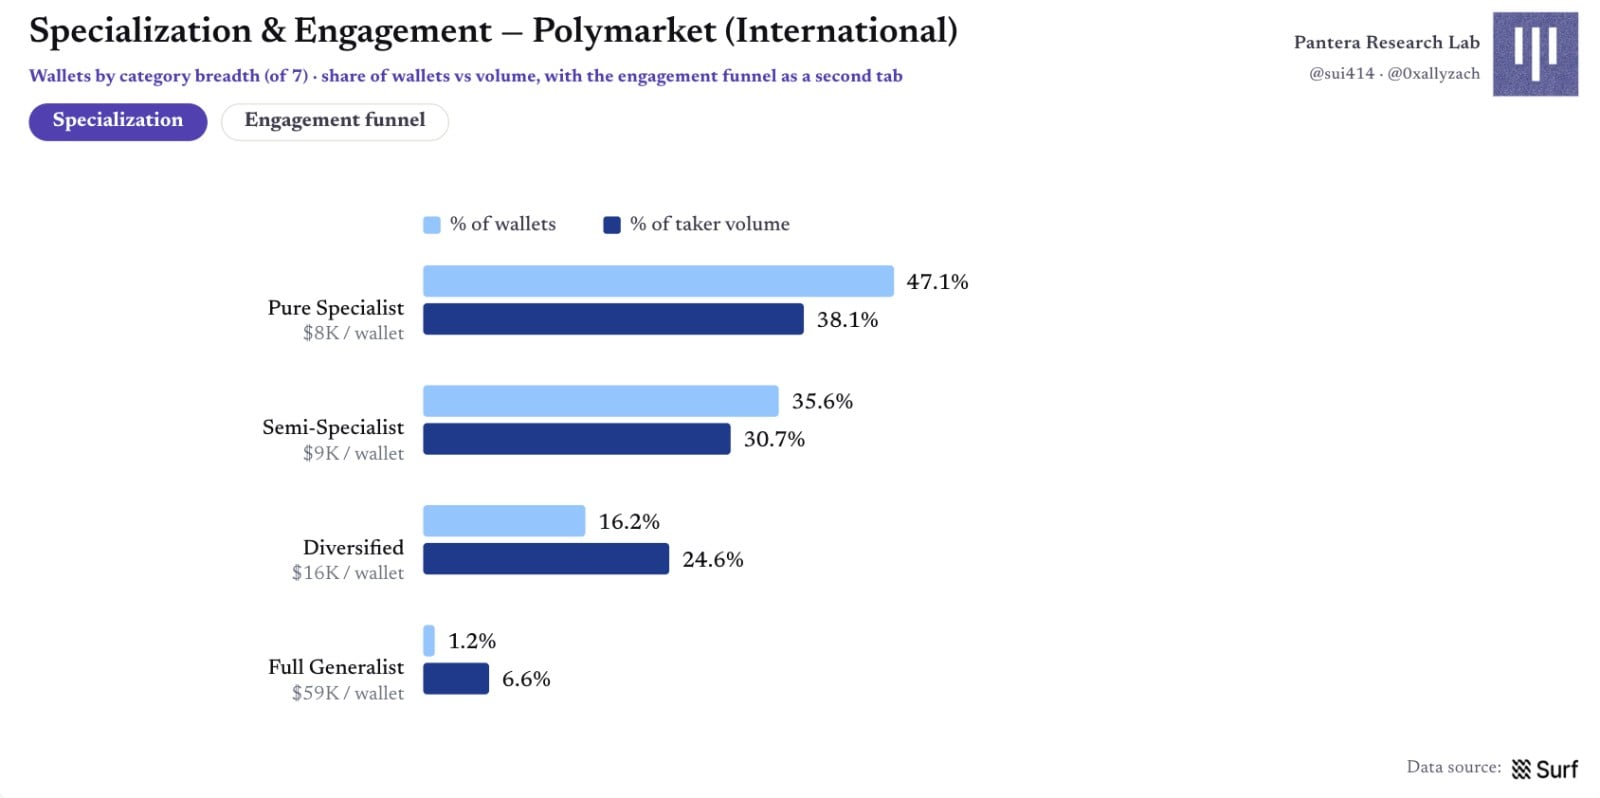
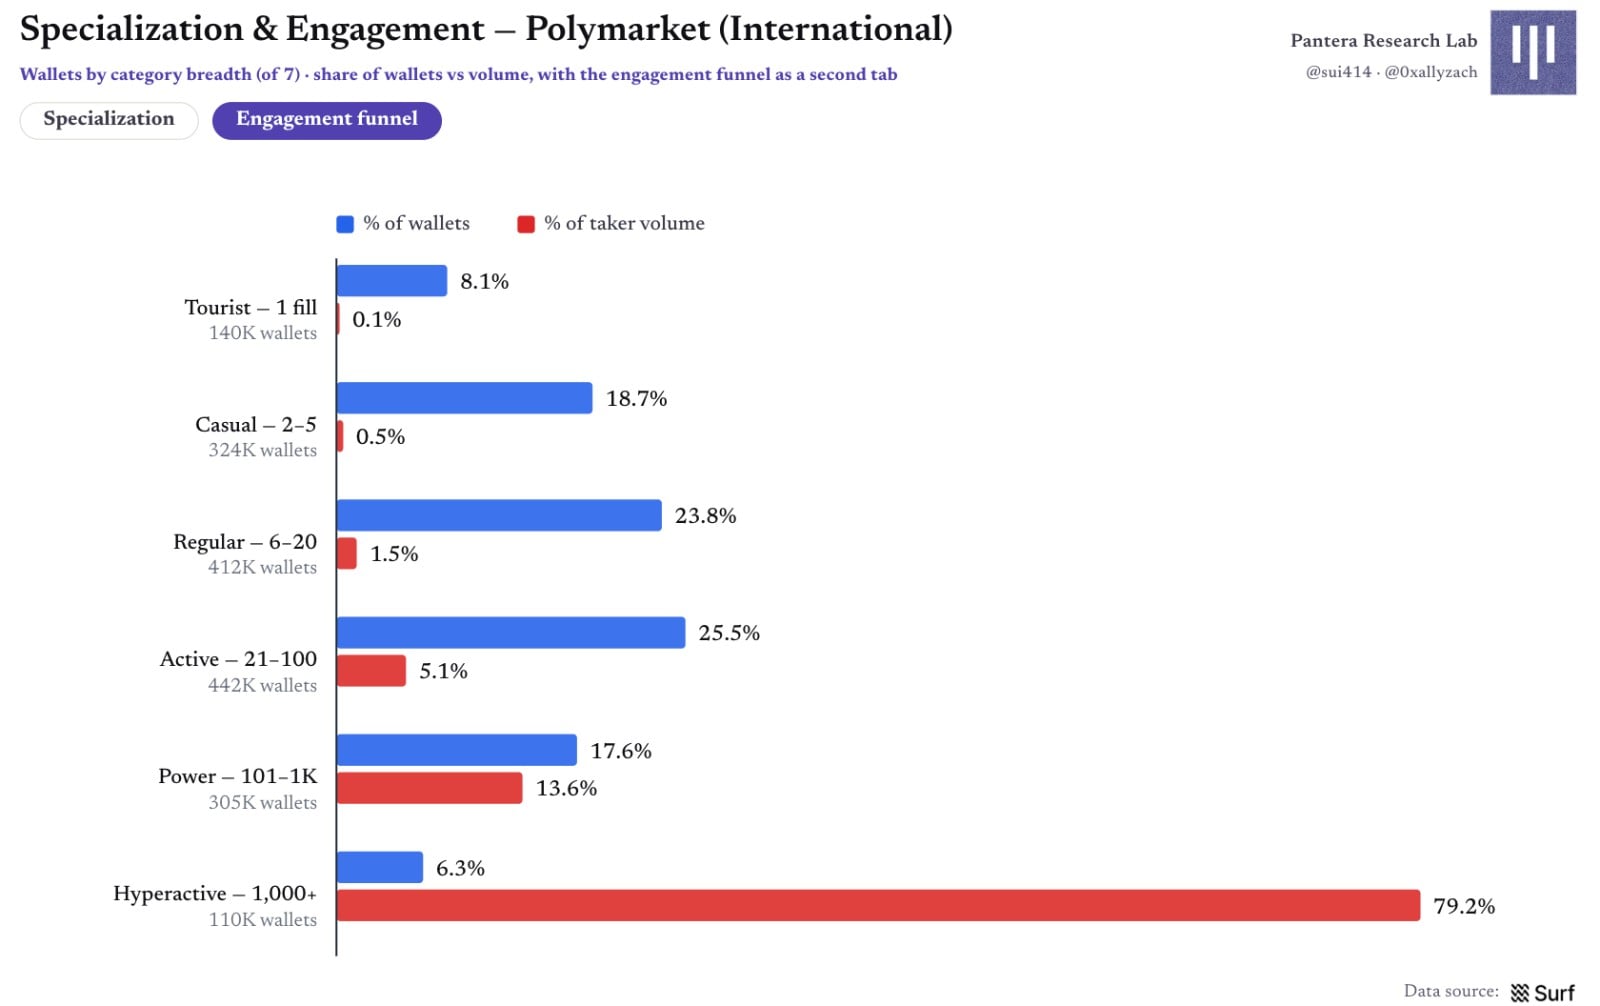
Figure 16 | Specialization and engagement: Category breadth, wallet share, and volume
In most categories, wallet-to-single-market relationships are dominated by one or two trades; sports have the highest single-trade ratio at 46%. Conversely, World/Geopolitics shows only a 20% single-trade ratio, indicating users repeatedly return to the same market as news progresses.
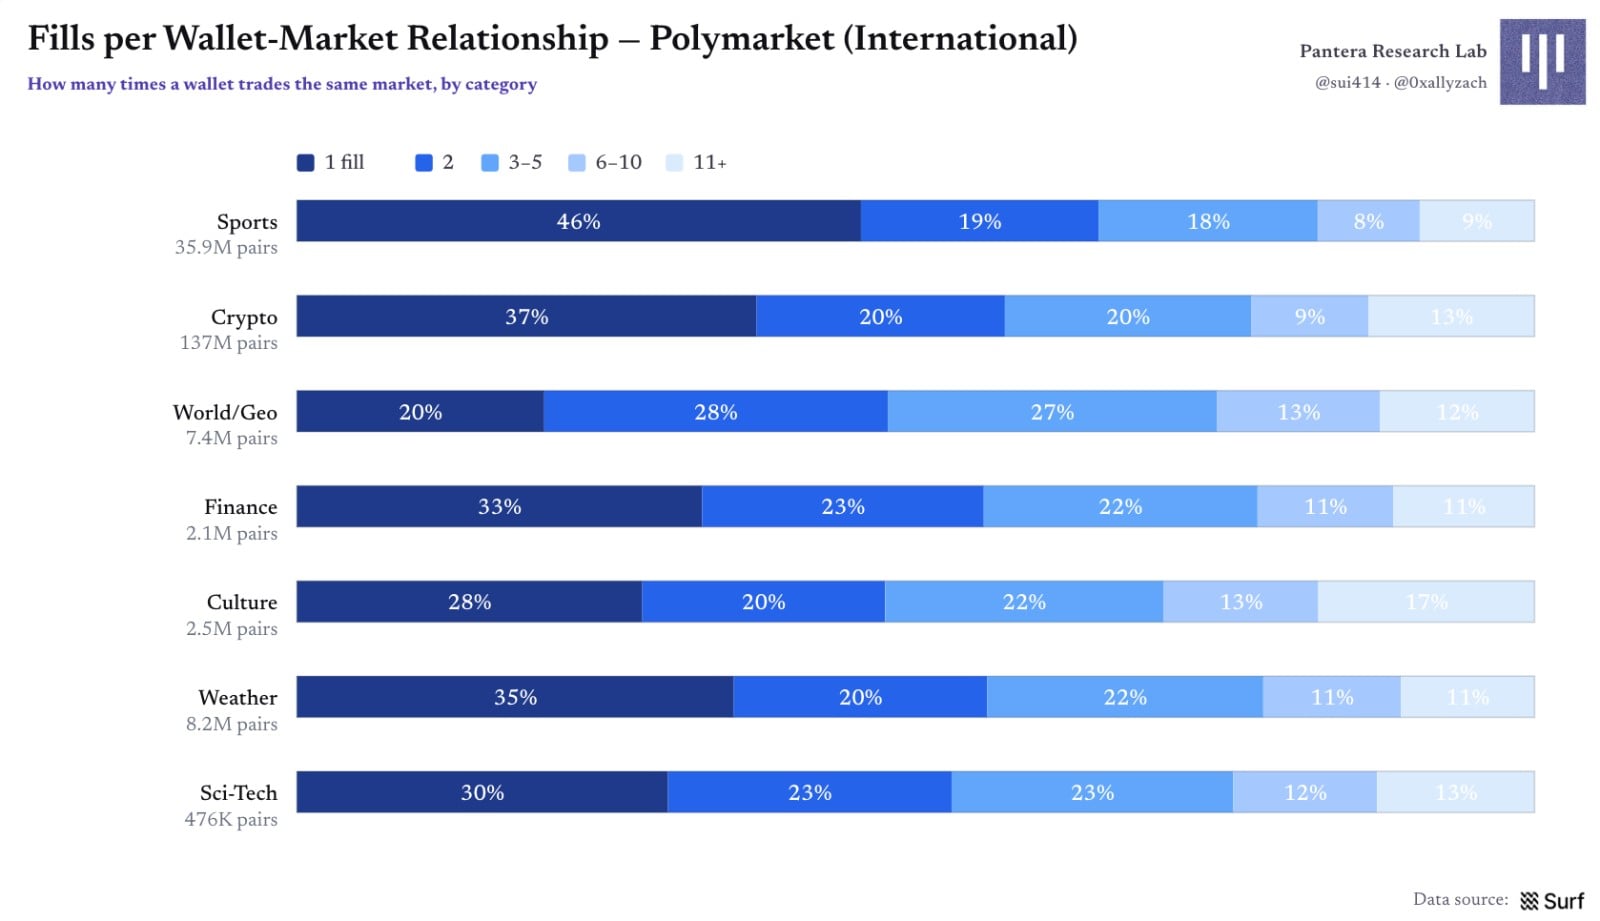
Figure 17 | Number of trades per wallet-market relationship
Three Participant Cohorts: Bots, Professional Users, and Retail Users
We employ heuristic classification using behavioral signals like trading frequency, consistency in order sizes, category breadth, and average ticket value. Classification is not a definitive judgment of true identity, and threshold shifts affect distributions; it better answers 'who trades and how' rather than 'who they definitively are'.
Bot-like wallets comprise ~5.9% of users yet execute ~two-thirds of volume: ~102k wallets drove $11.9B in volume and 89% of trade events; ~1.54M retail wallets contributed $4.1B. Professional/informed users account for ~5%, contributing 6.6% of taker volume, aligning with their trait of providing liquidity and taking orders less frequently.
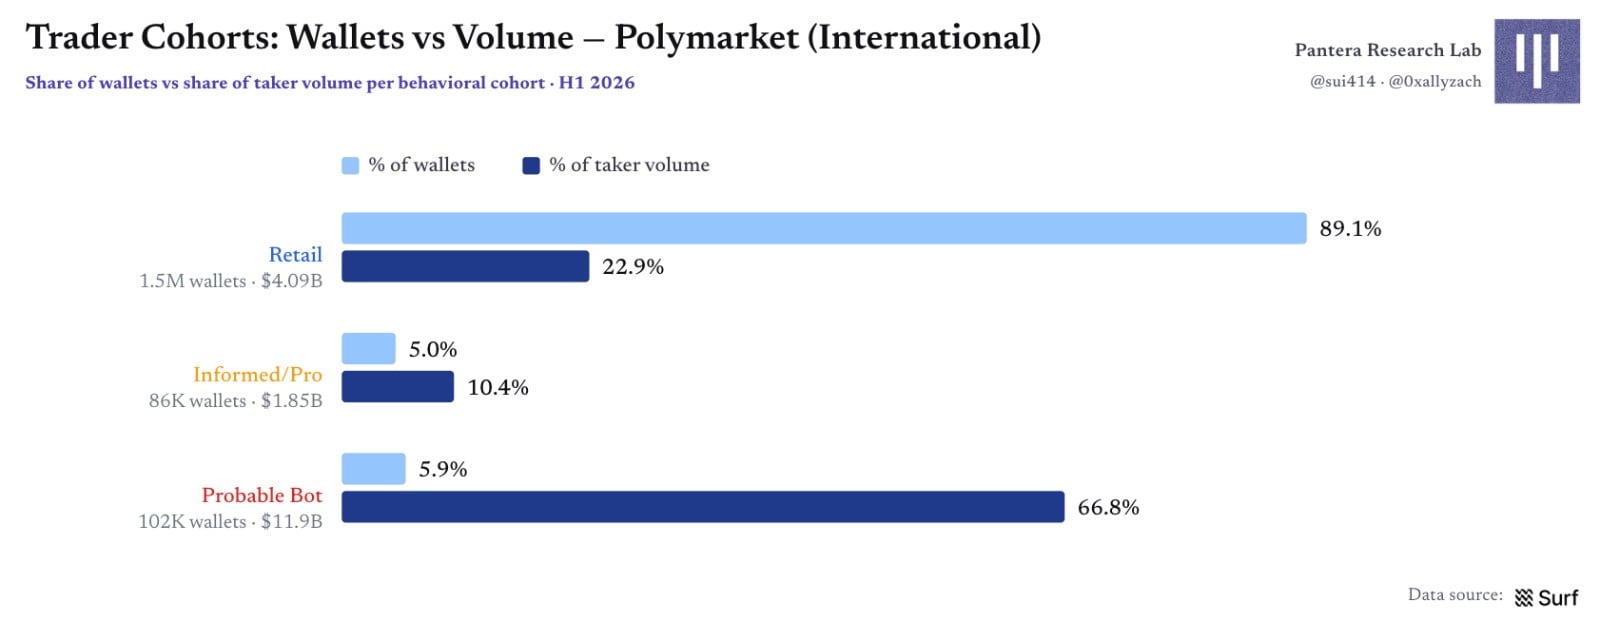
Figure 18 | Trader cohorts: Dislocation between wallet count and trading volume
By category, bots nearly completely dominate crypto and sports, capturing ~80% and ~72% of volume respectively; in the middle ground where humans still influence prices more—geopolitics, finance, culture—the shares of the three cohorts are closer.
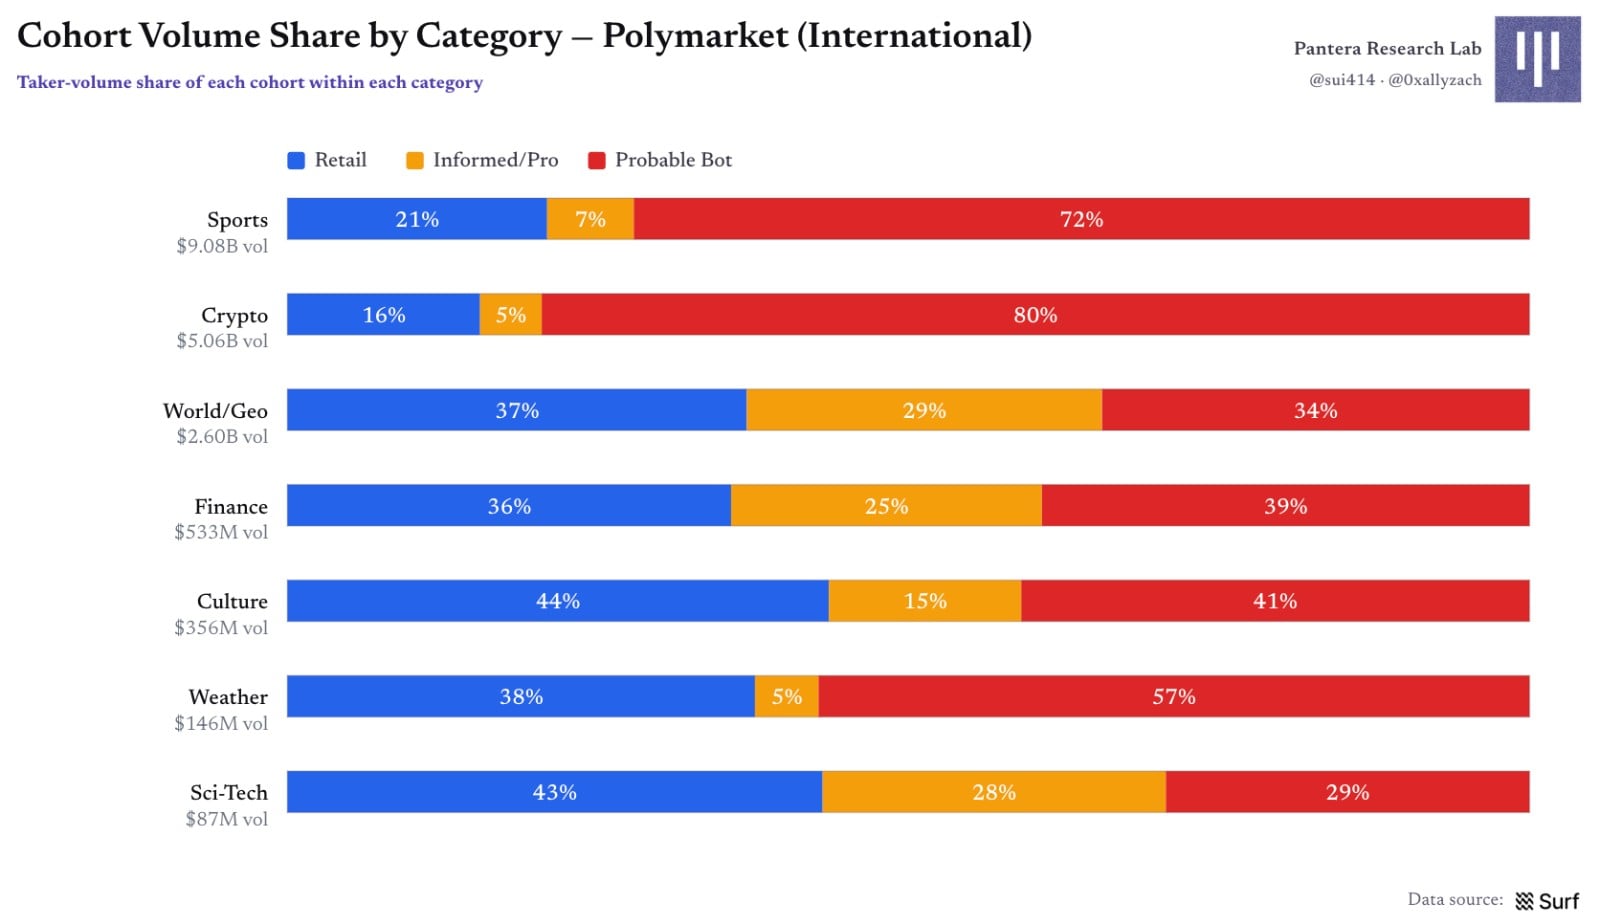
Figure 19 | Cohort volume share by category
However, volume dominance stems from a thin layer of bots. By wallet count, each category remains overwhelmingly retail-dominated; crypto and weather show notably higher bot ratios, where ~5% population share is substituted by automated behavior.
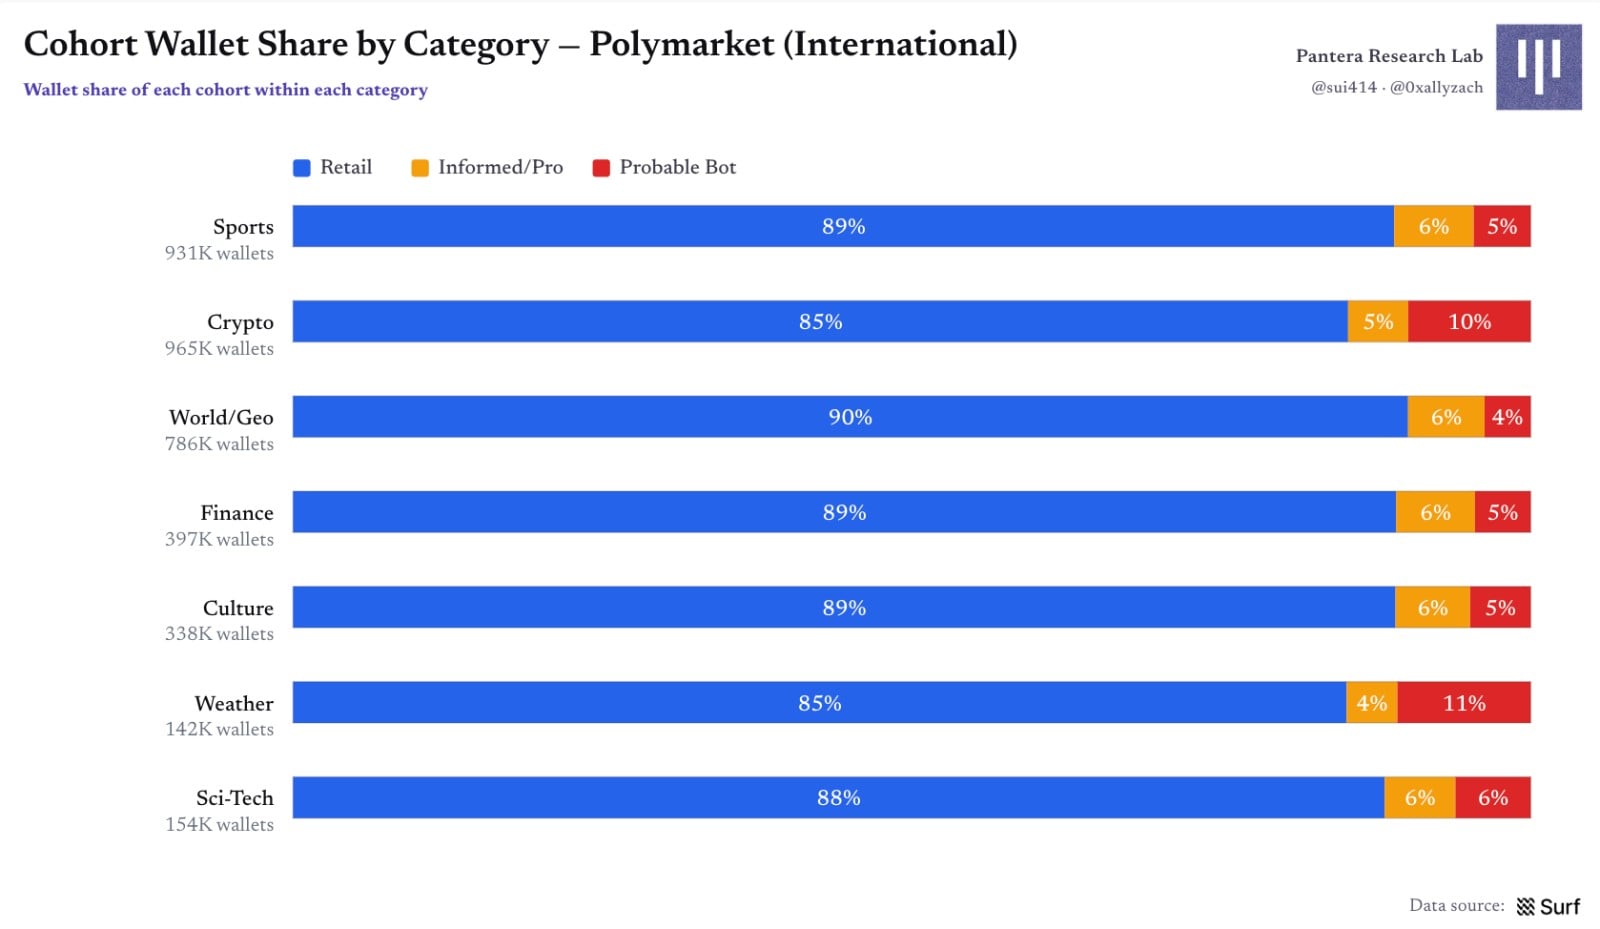
Figure 20 | Wallet cohort share by category
Are Prediction Market Users Sensitive to Fees?
Different categories activating fees at different times creates a natural experiment; zero-fee World/Geopolitics serves as the control group. Results show that after fees activate, the volume composition shifts markedly, especially in crypto, culture, and weather: the professional/informed user cohort's volume share drops rapidly, while retail and bot shares remain relatively stable, demonstrating stronger fee insensitivity.
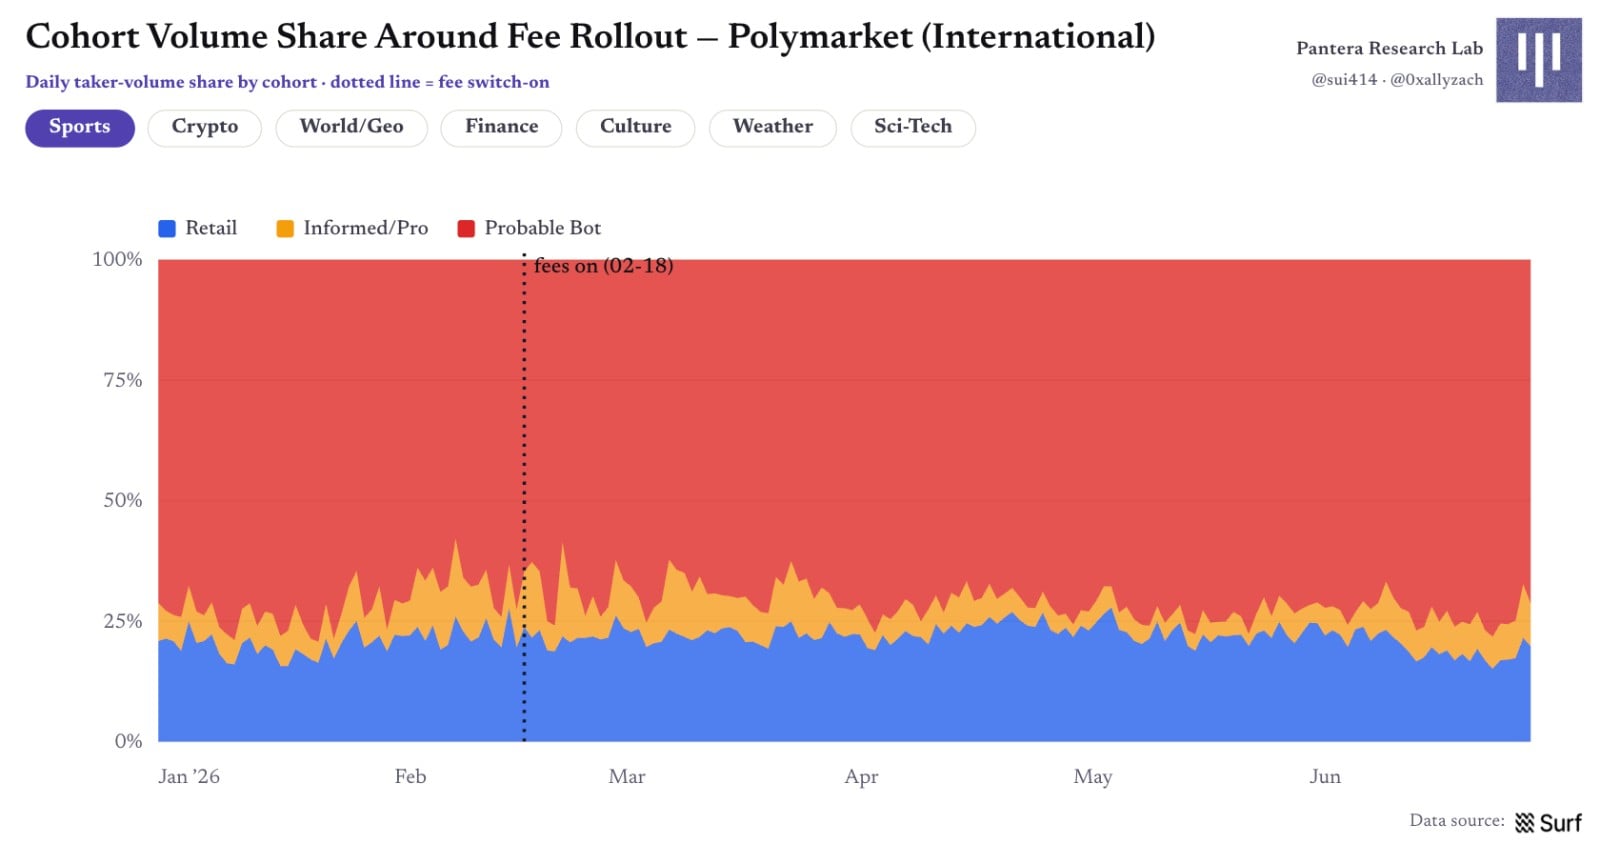
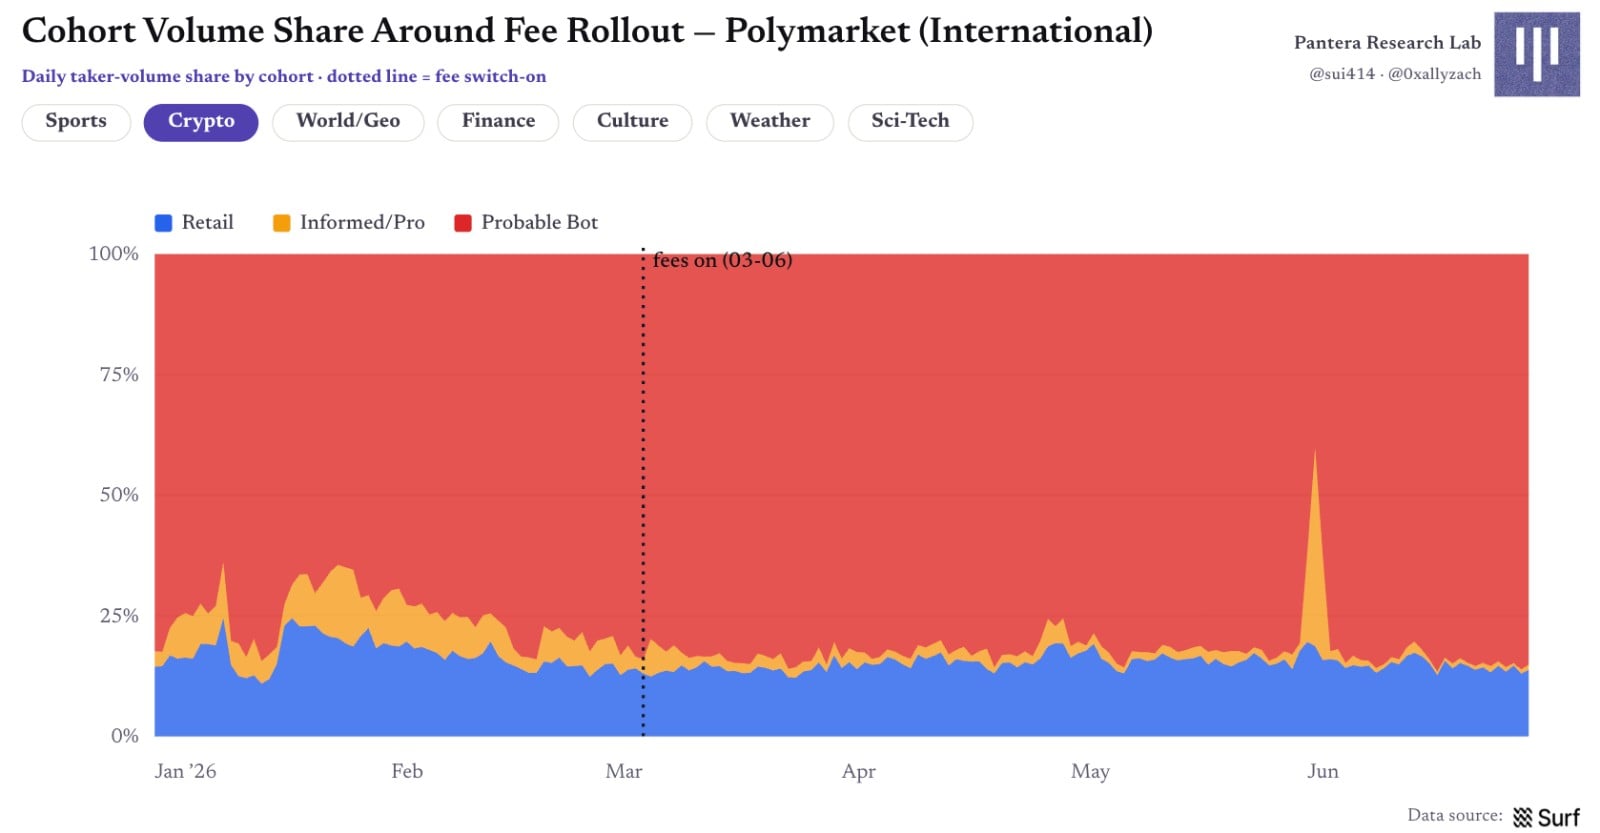
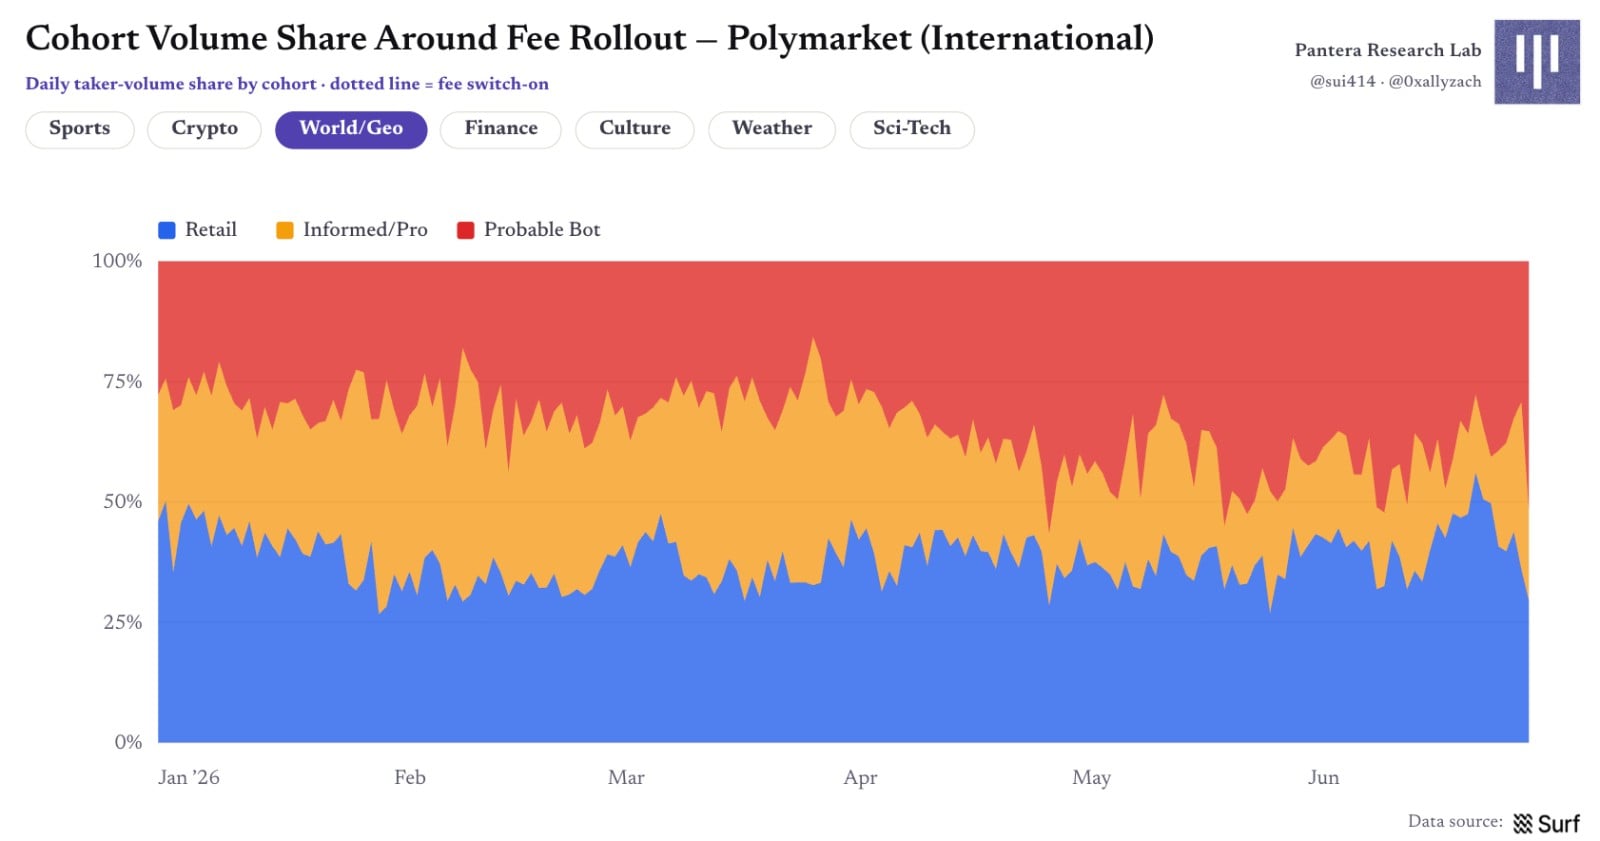
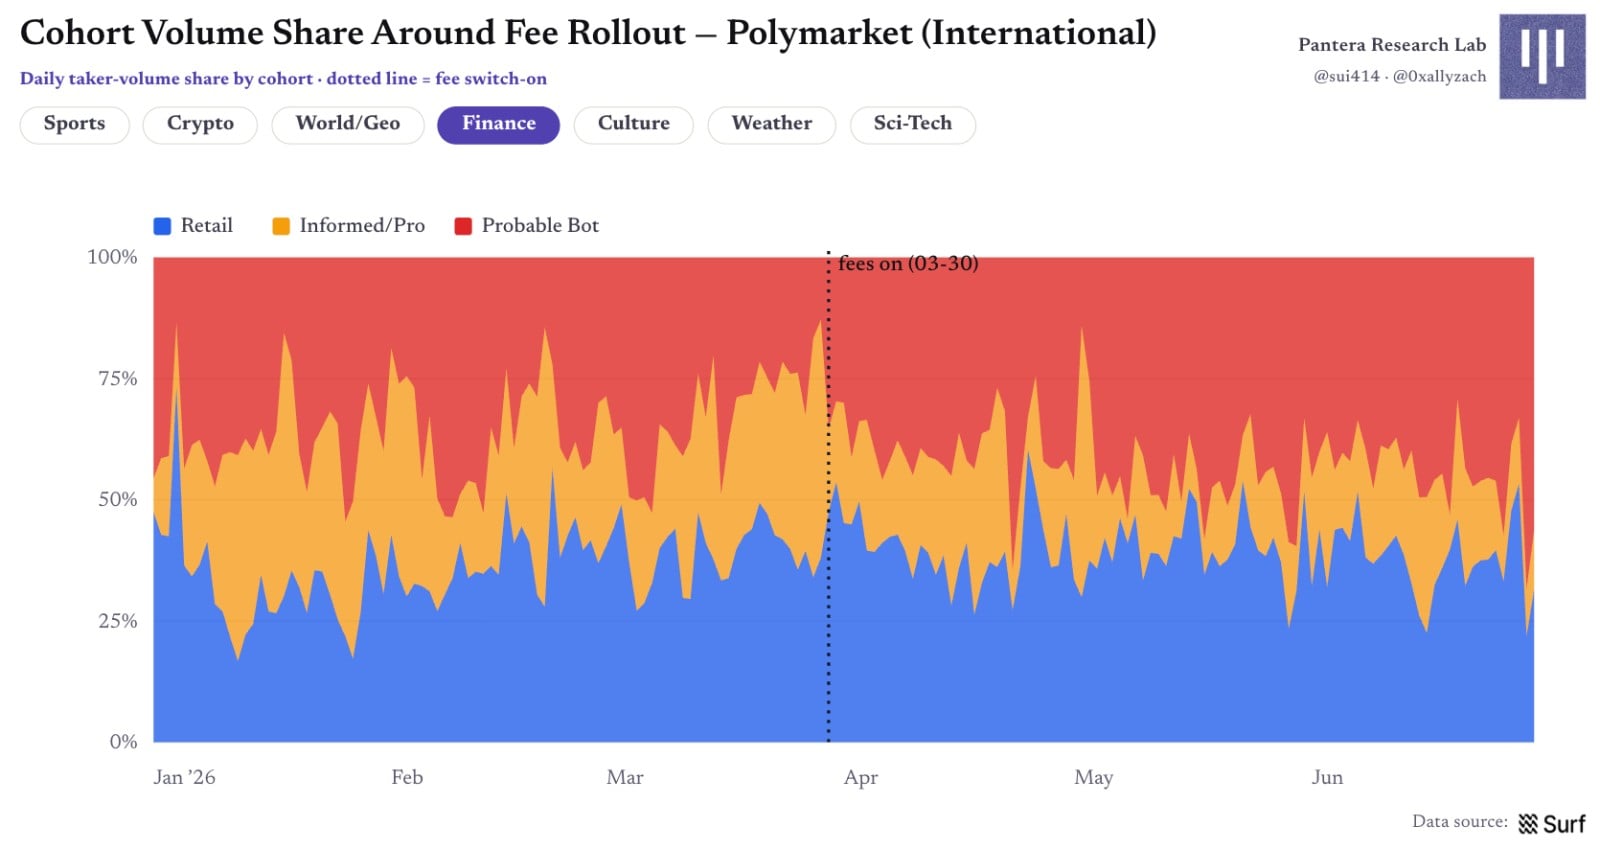
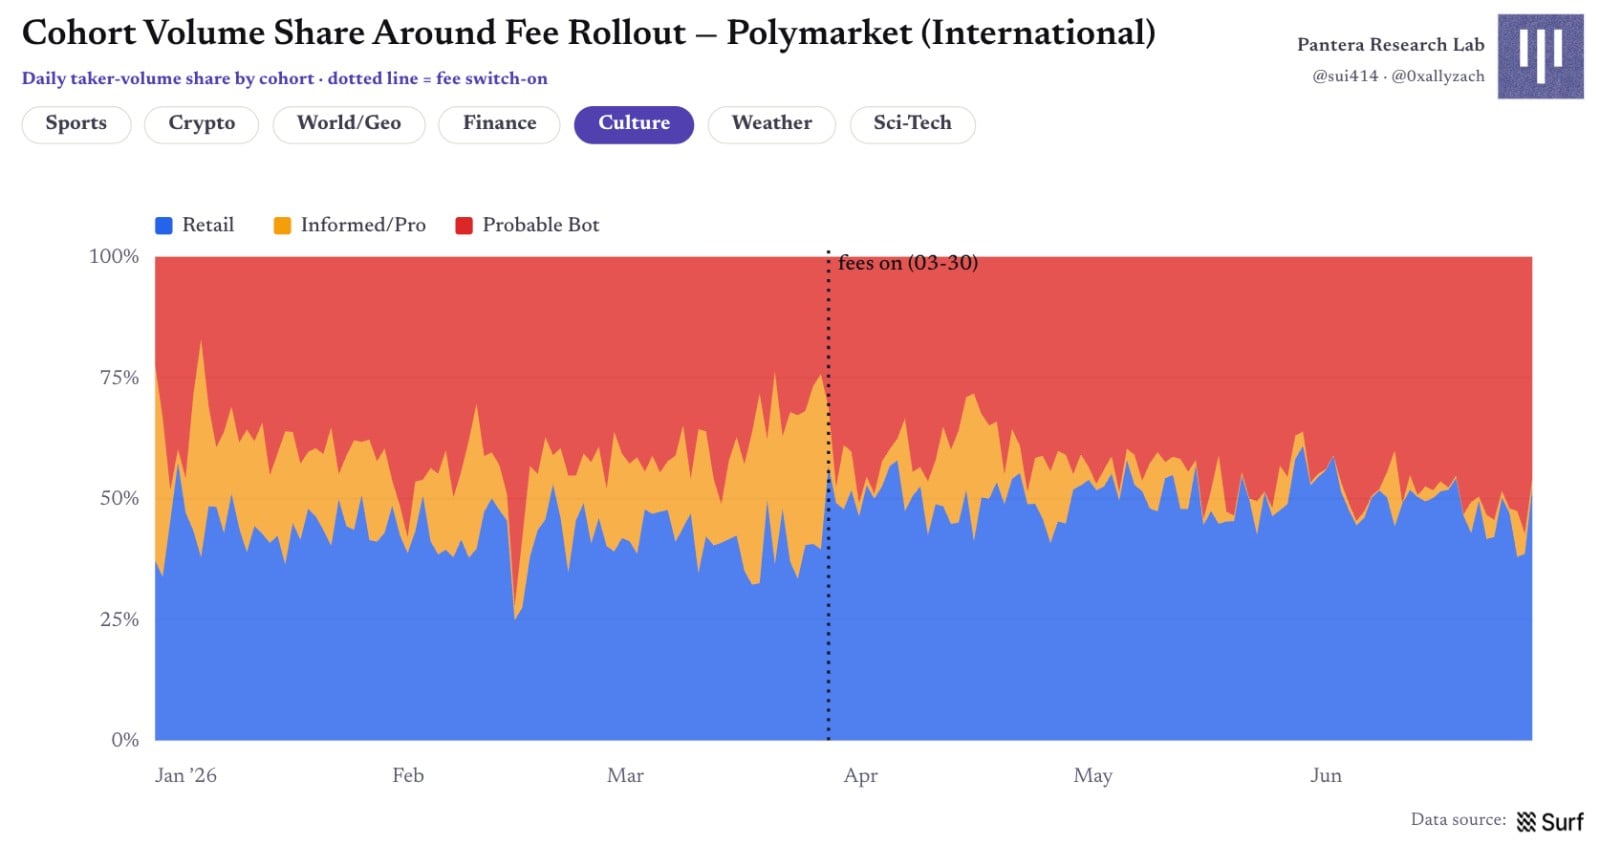
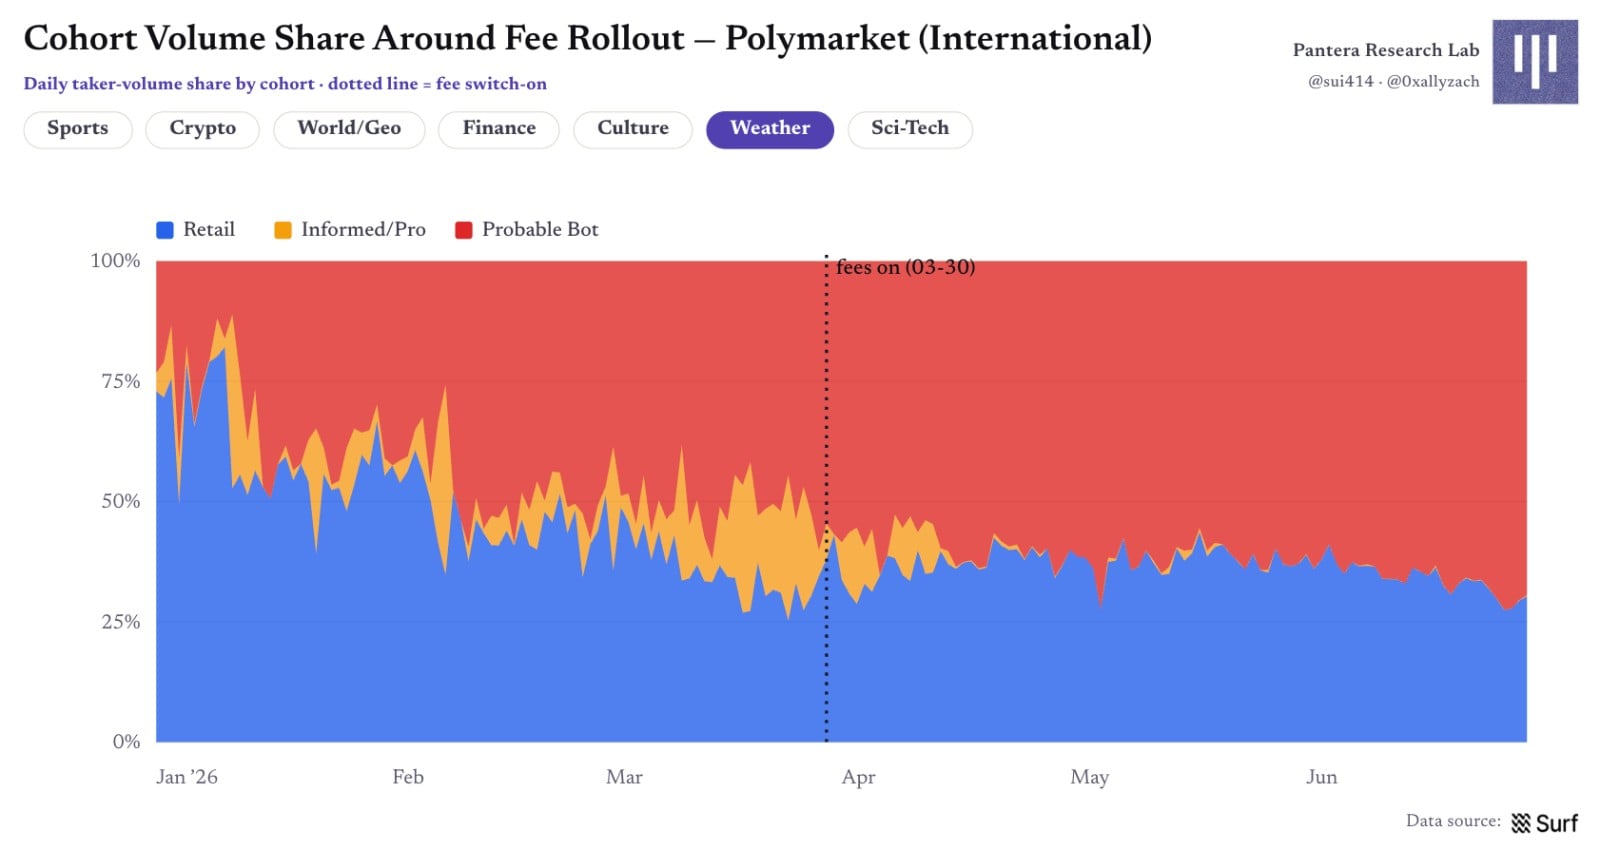
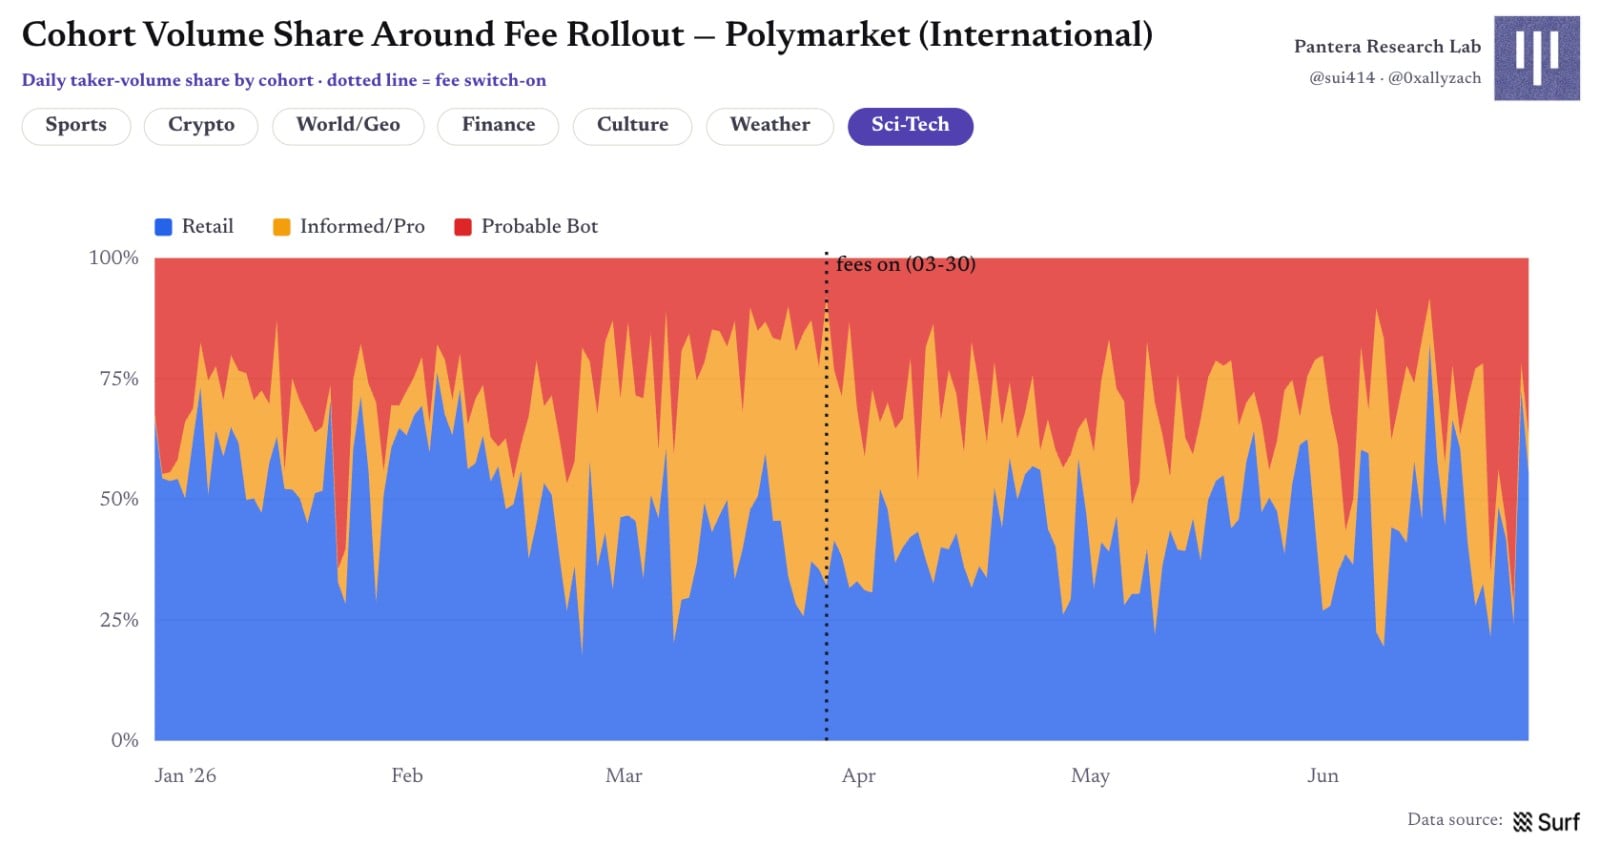
Figure 21 | Volume share of each cohort before and after fee activation
Changes in wallet share are far smaller than volume share changes, but patterns align: professional/informed wallets experienced the sharpest exodus in those three categories. Fees change 'who is increasing bet size', not necessarily immediately 'who remains present'.
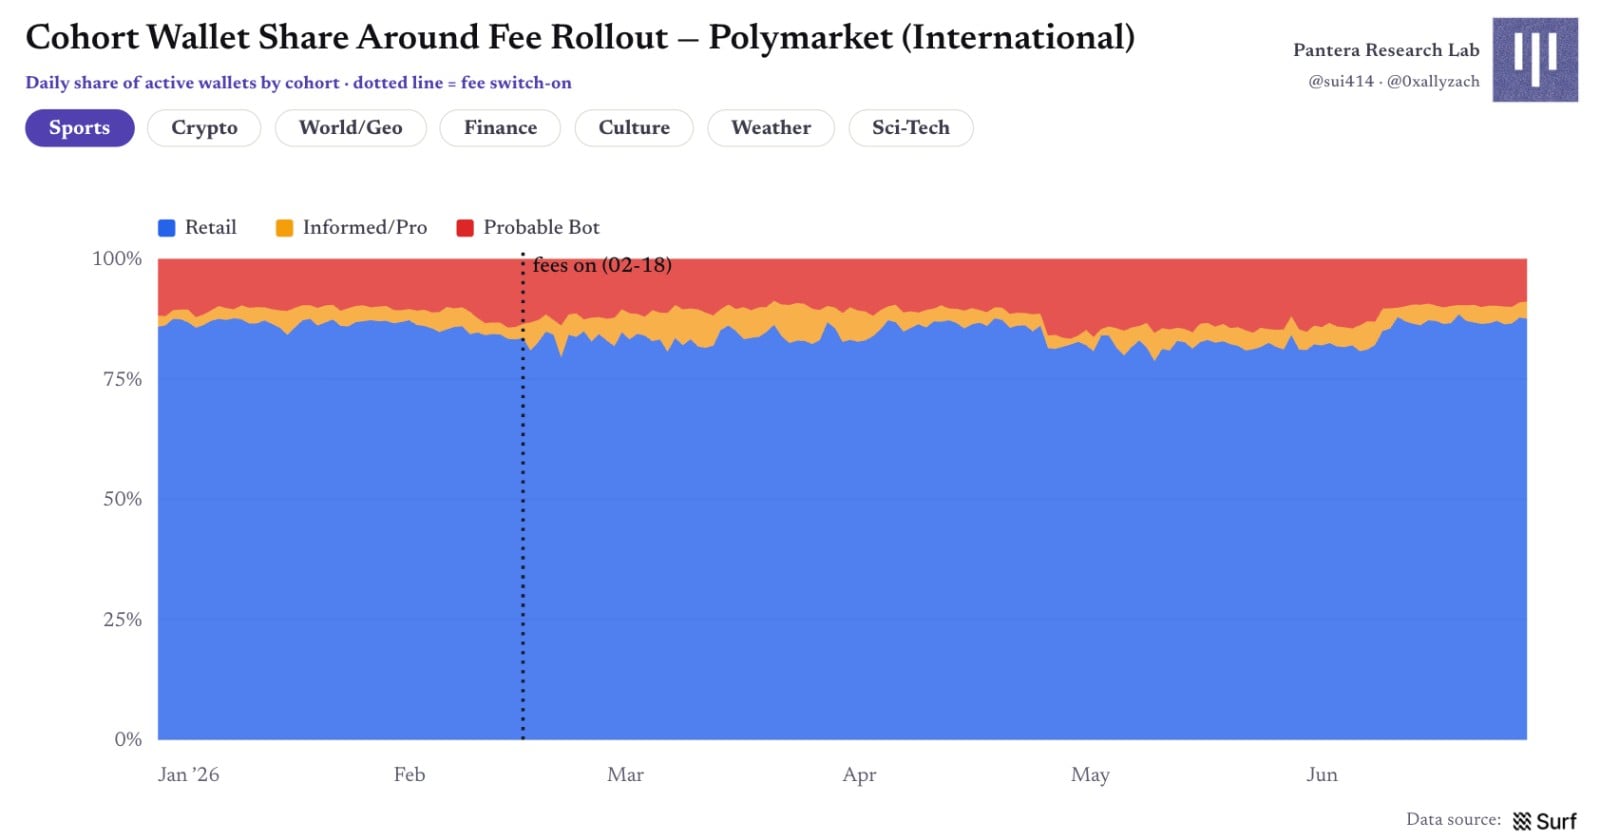
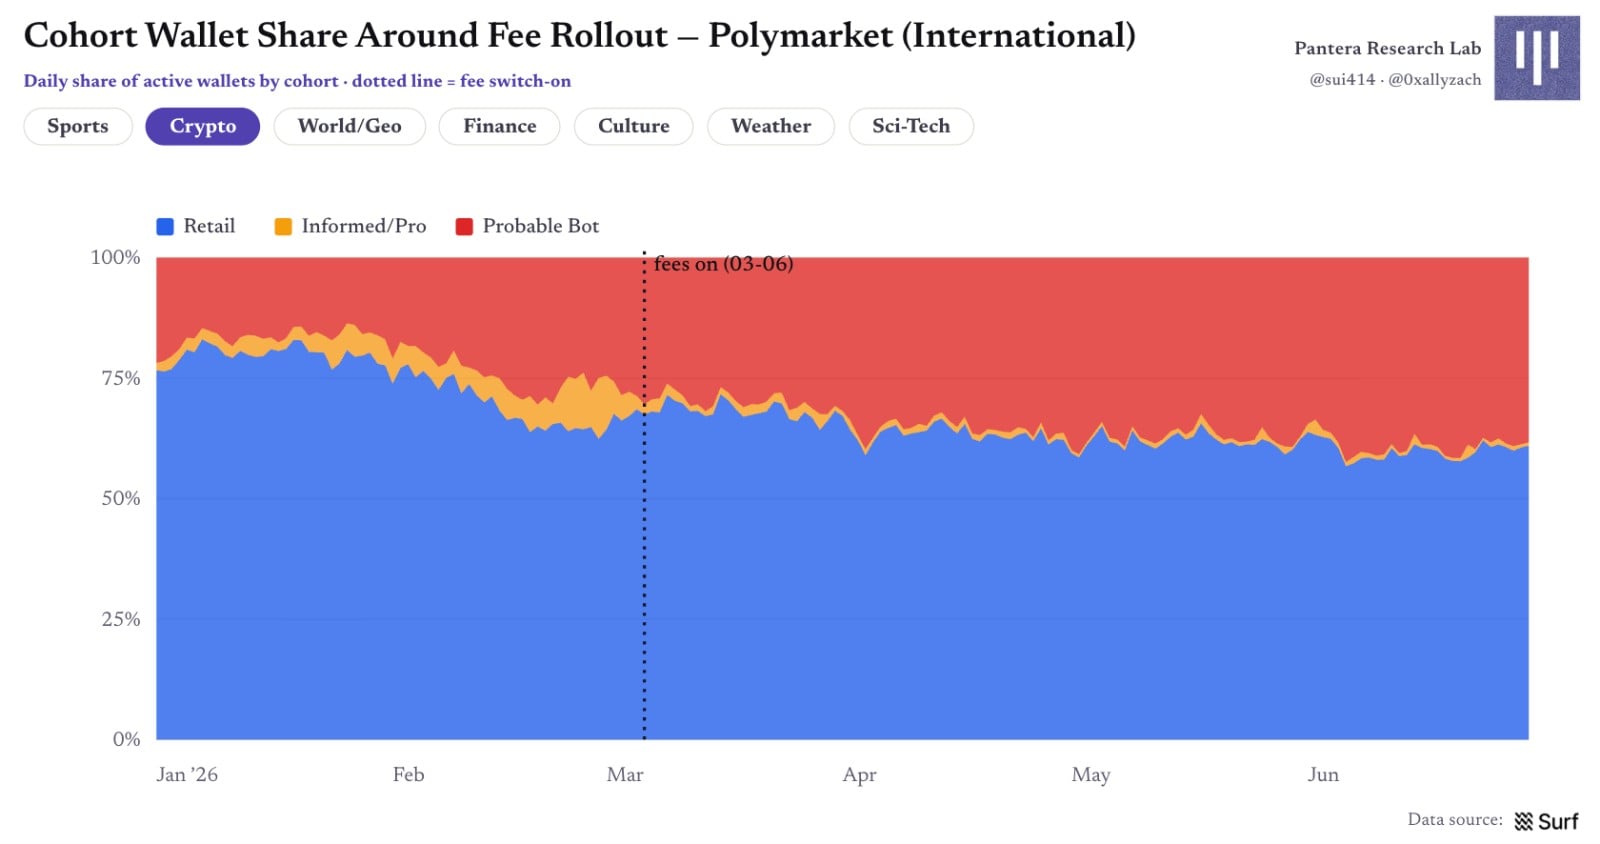
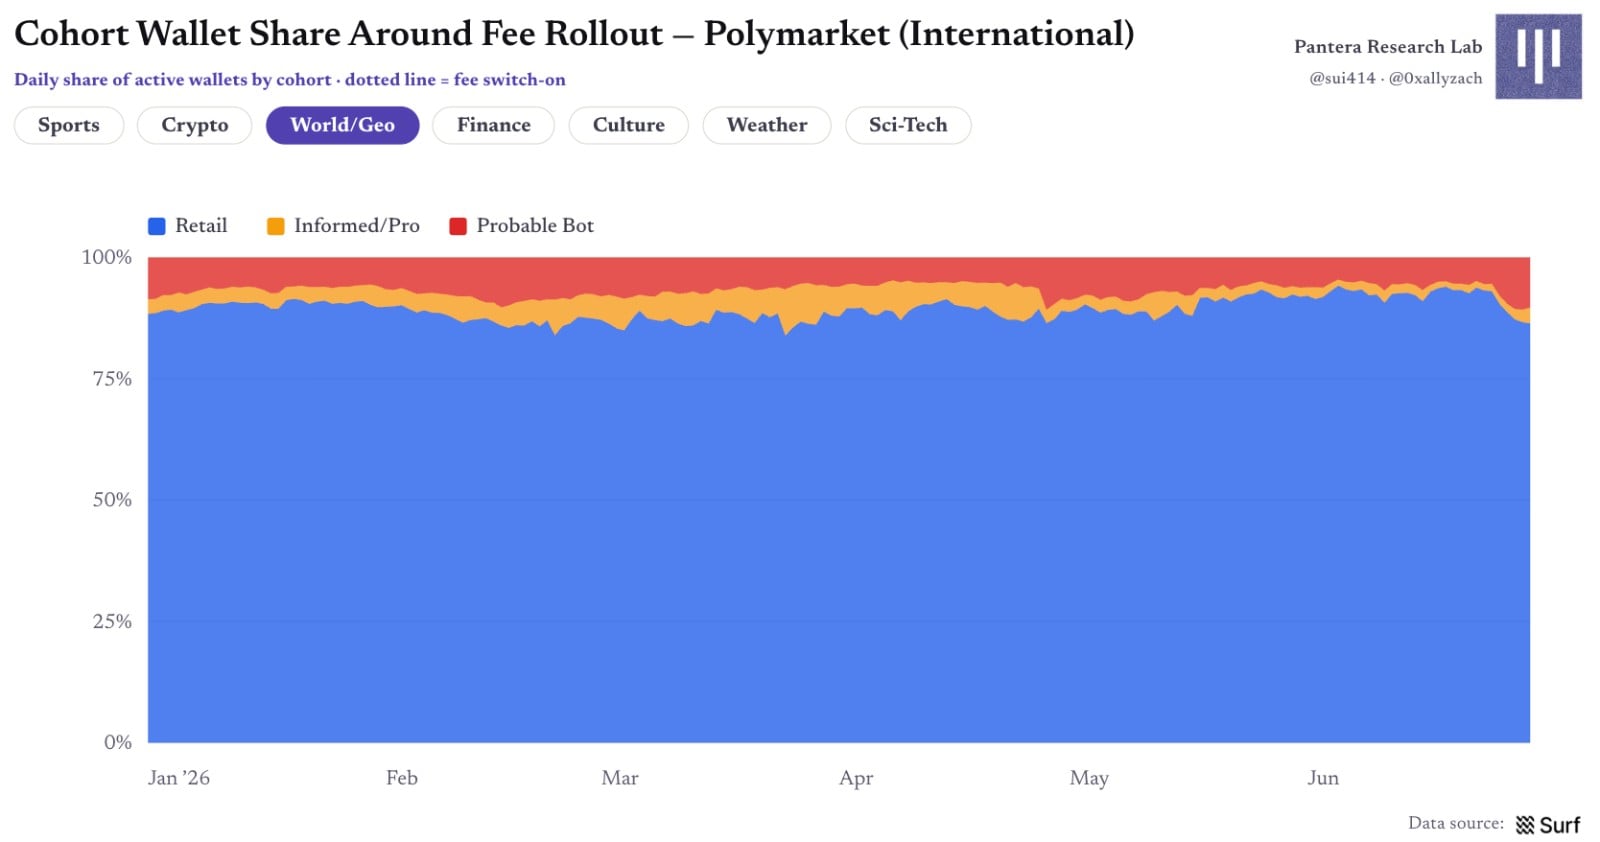
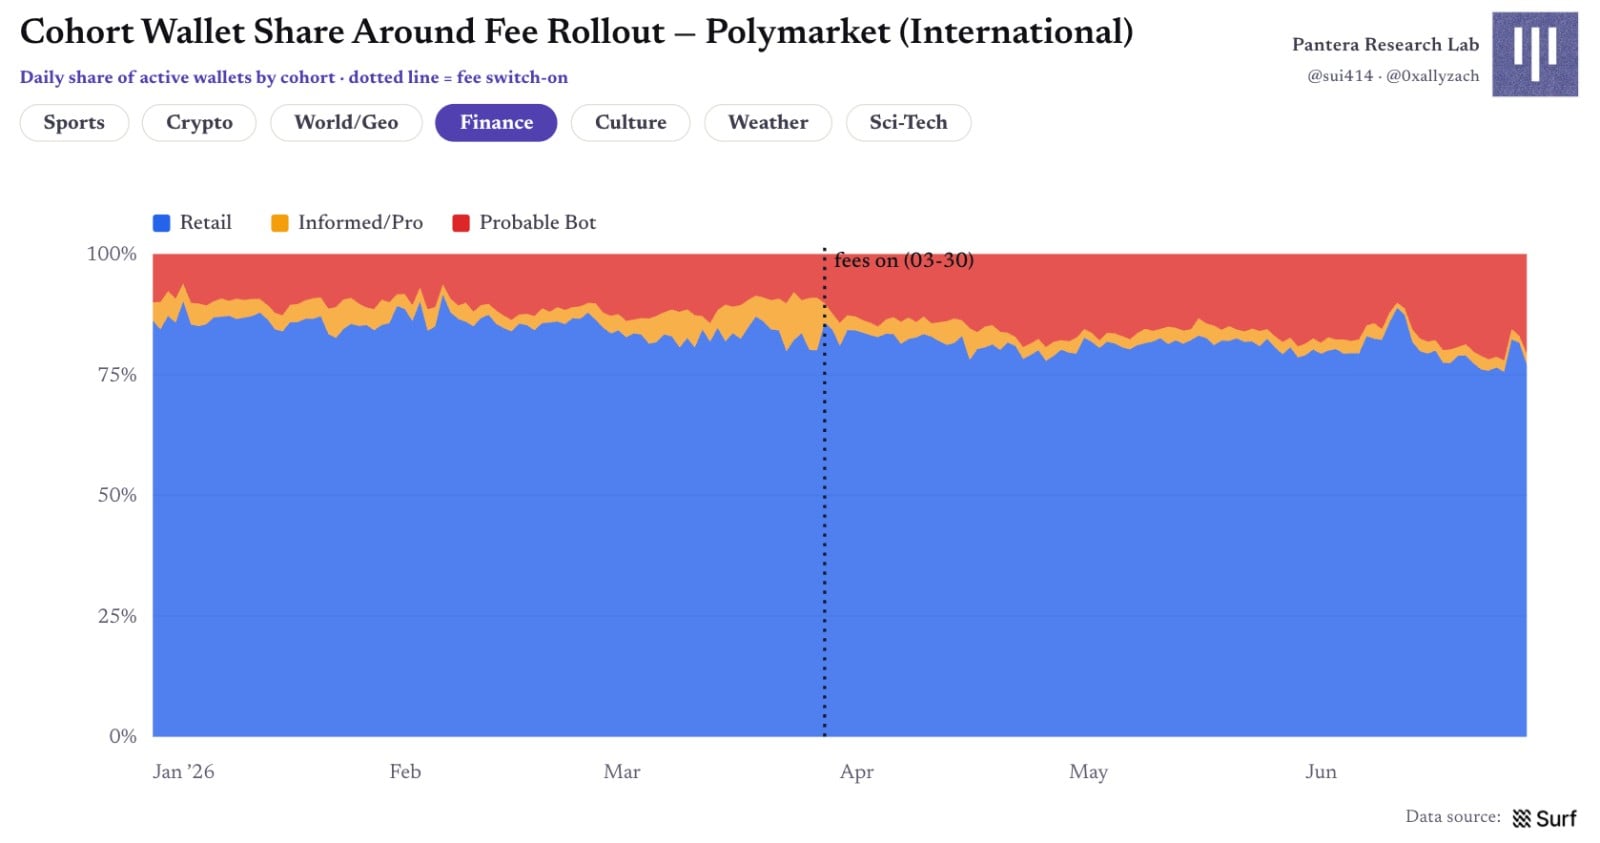
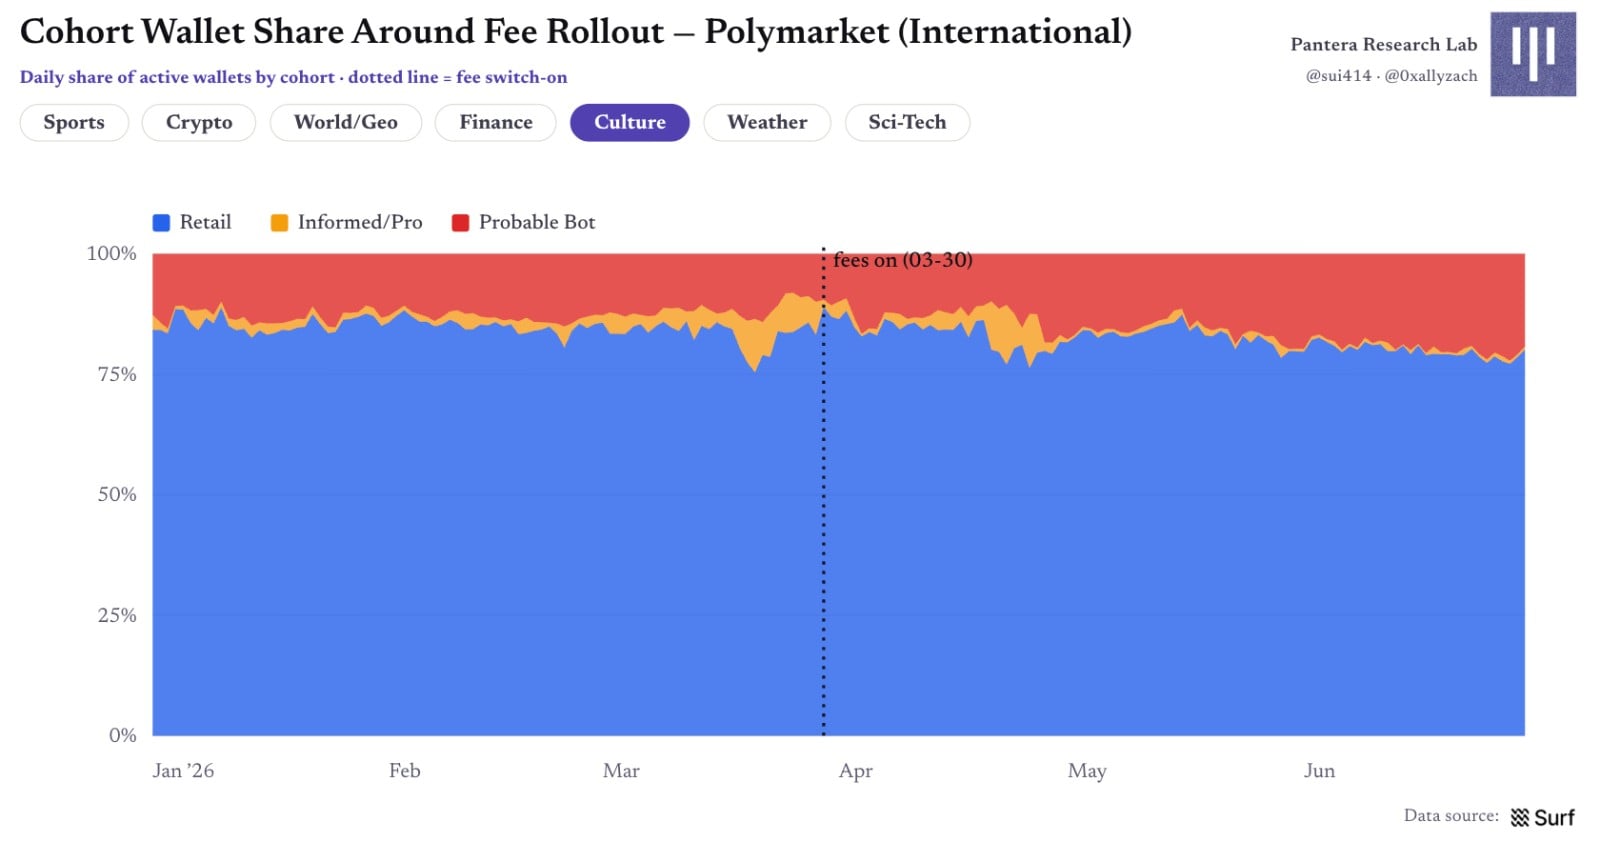
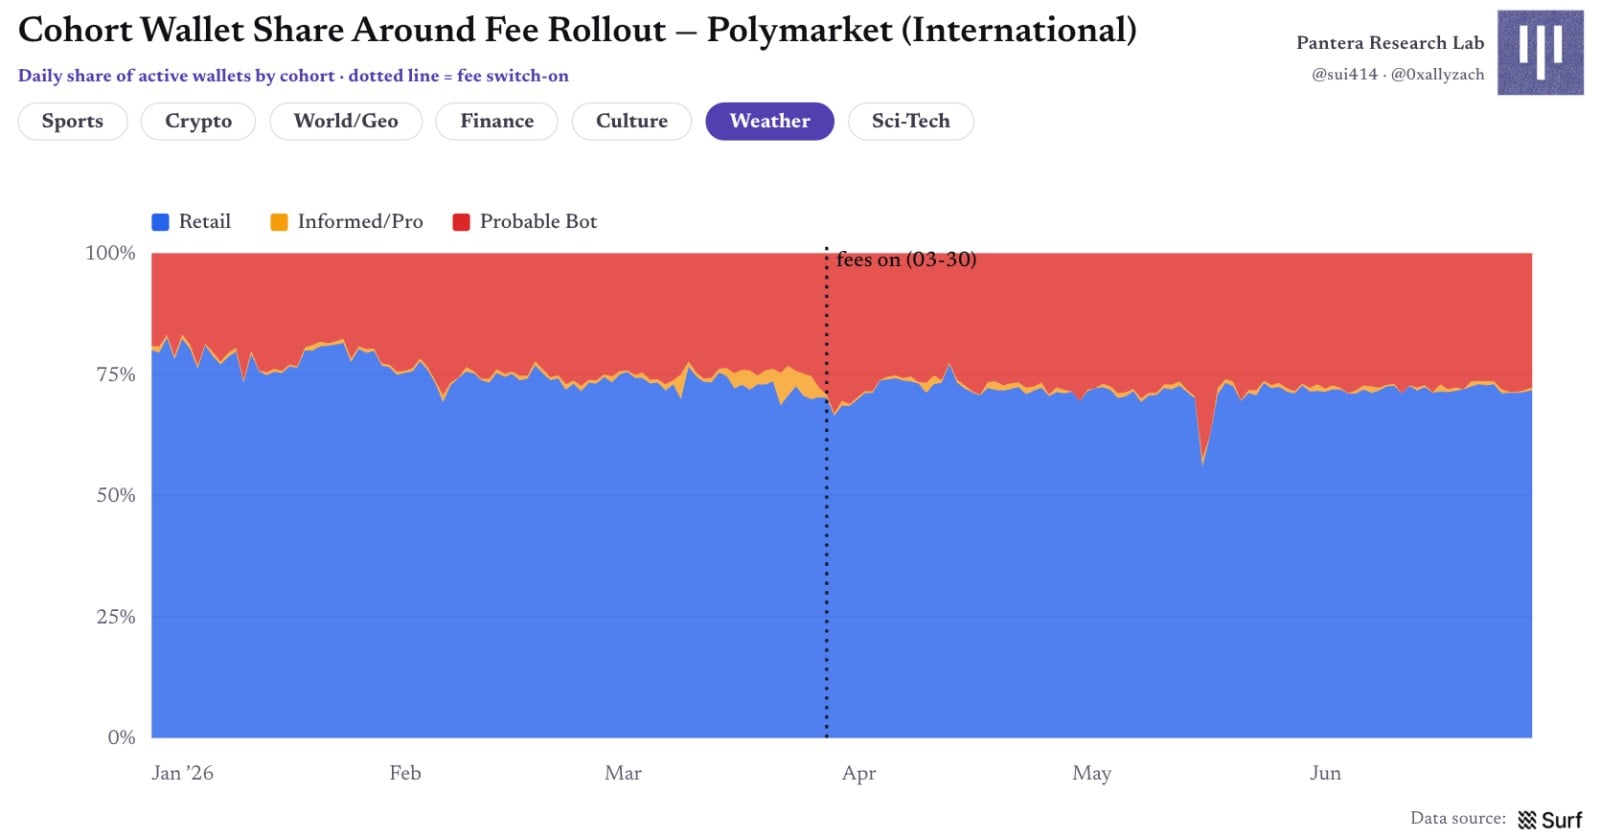
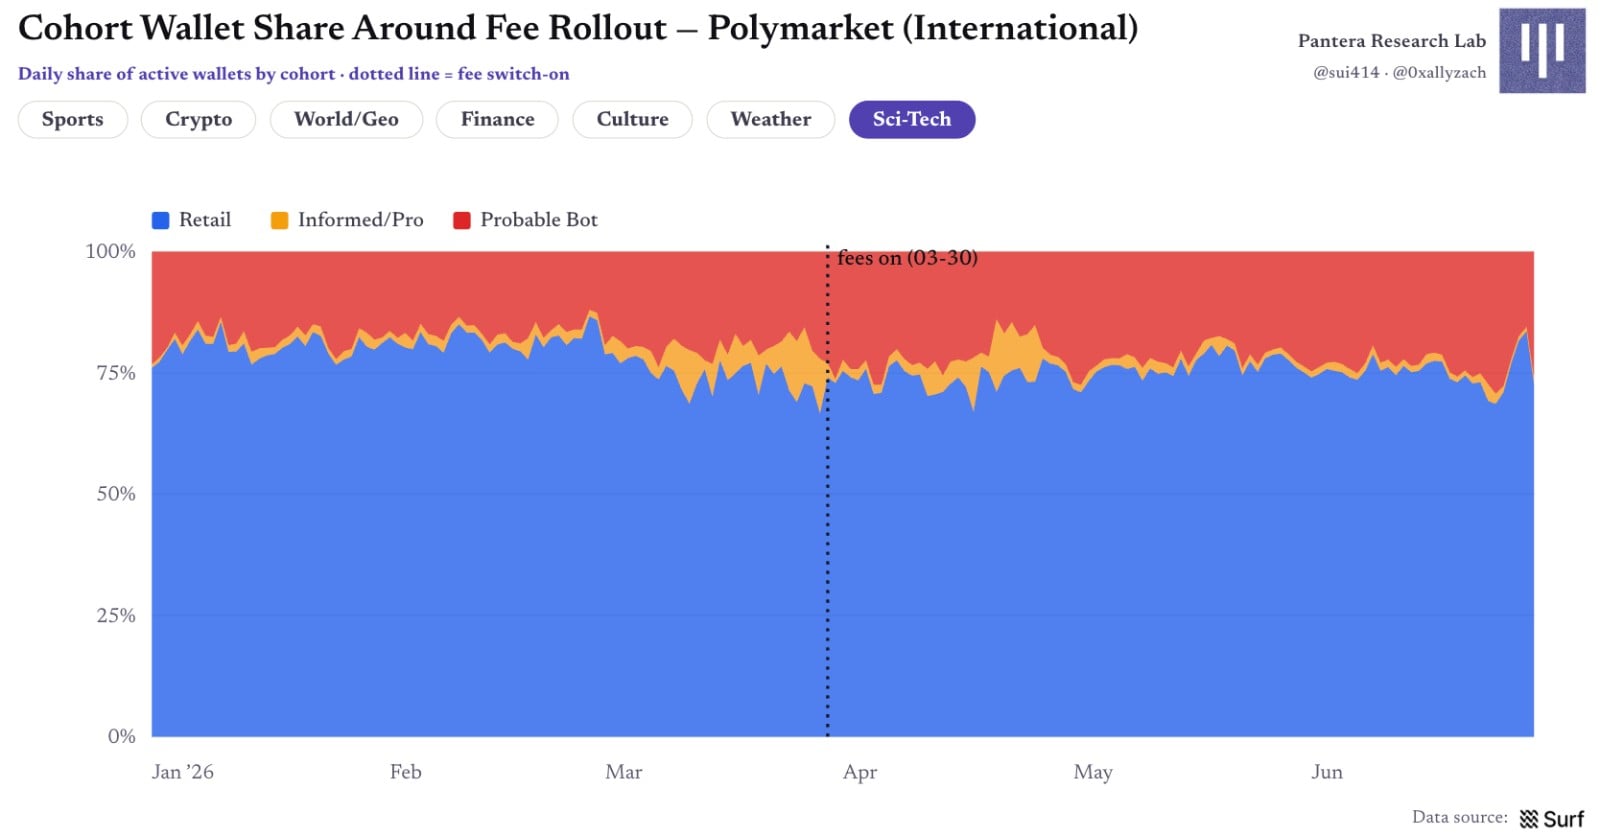
Figure 22 | Wallet share of each cohort before and after fee activation
Entry Timing: Most Arrive Very Late
Late entry is the norm throughout a market's lifecycle, but degree of lateness varies by information game. Sports and crypto exhibit the most delayed competition: median entry points for all cohorts fall between 92%–95% into a market's lifecycle, creating clear adverse selection pressure on retail users. Culture ranges ~85%–90%; weather is opposite, with earliest entry—retail median ~61%, bots ~51%—consistent with outcome-based models that can price early. Weather is also where professionals enter last on average, median ~83%.
Entry timing analysis includes only markets with observable full lifecycles: those settled in H1 and tracked from first trade, including positions entered prior to 2026.
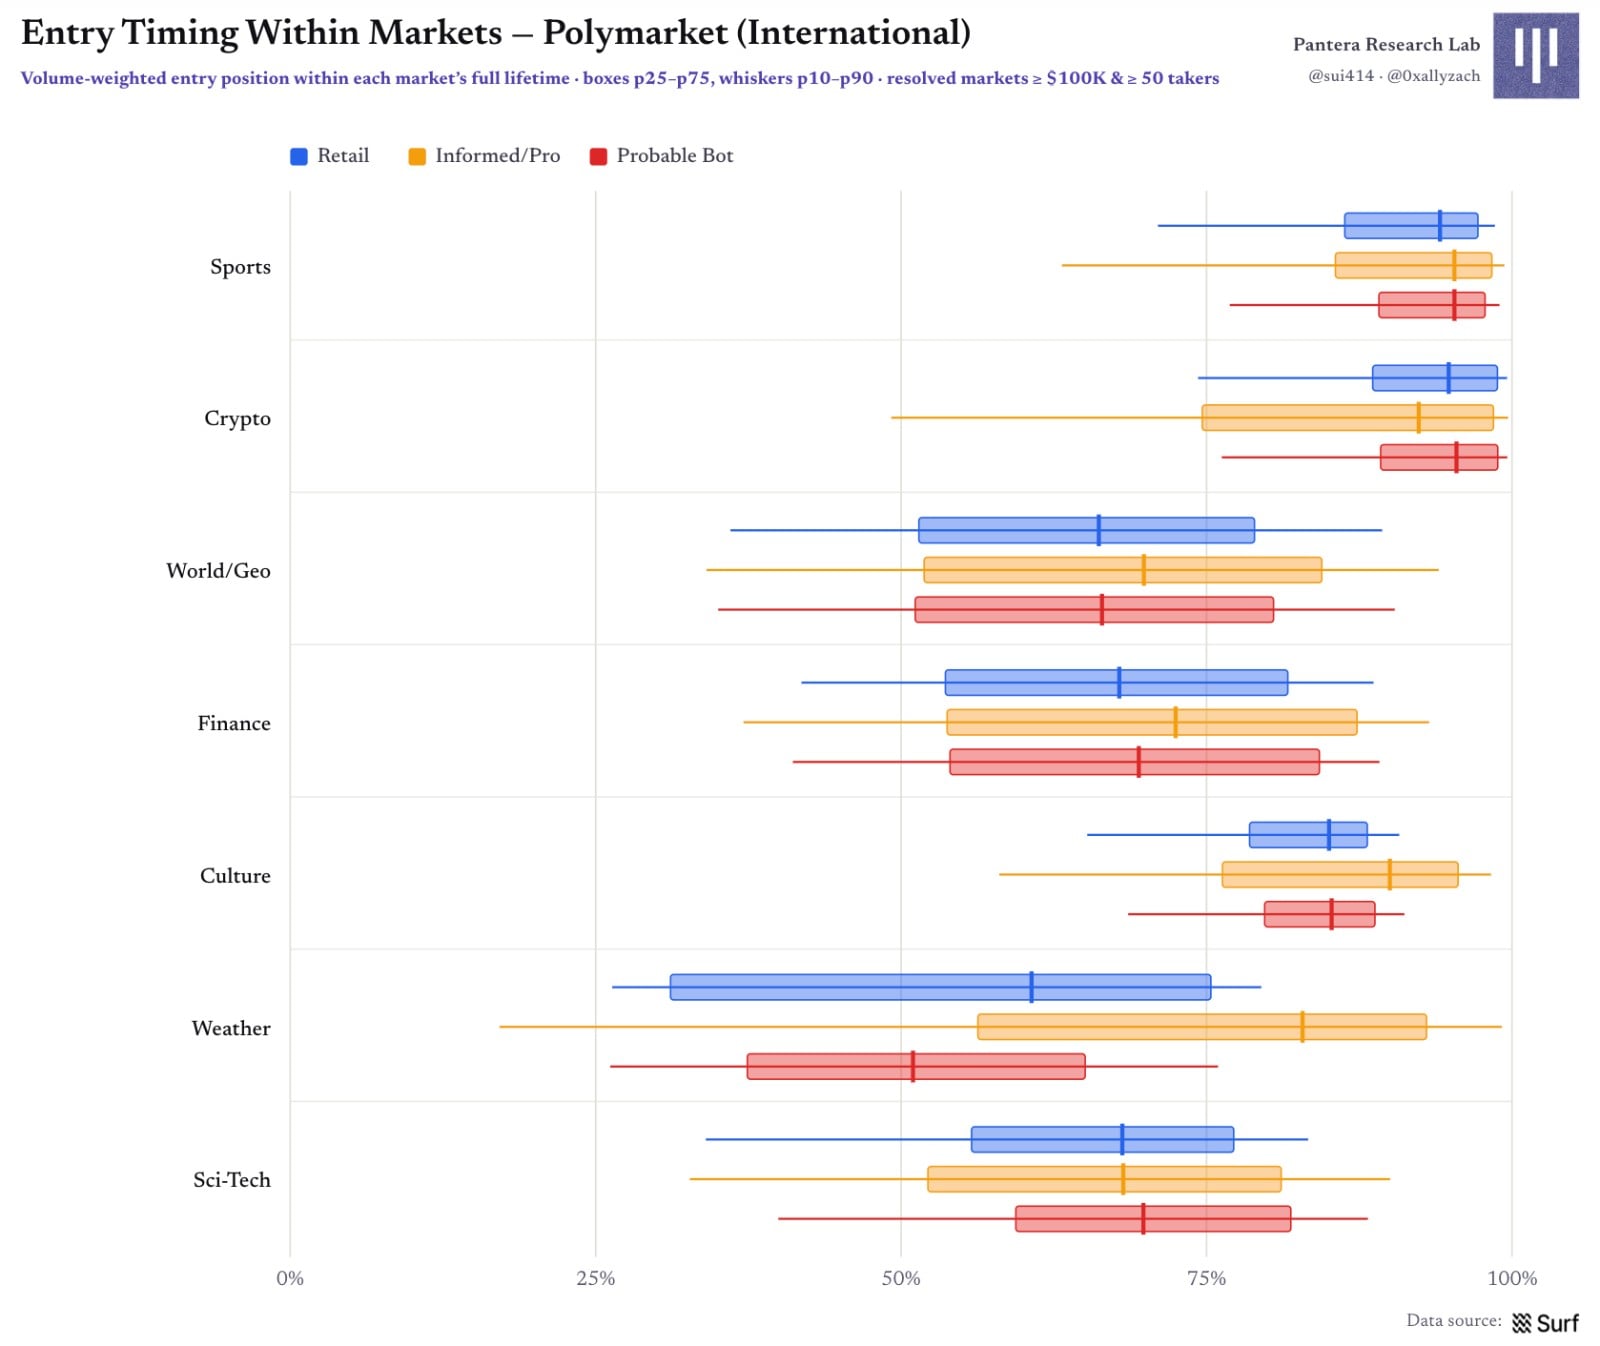
Figure 23 | Weighted entry position of each cohort within market lifecycle
The highest-volume markets per category reveal more intuitive intraday rhythms: retail trades often span the entire market lifecycle; professional/informed users and bots tend to spike volume when information arrives or concentrate bets near settlement.
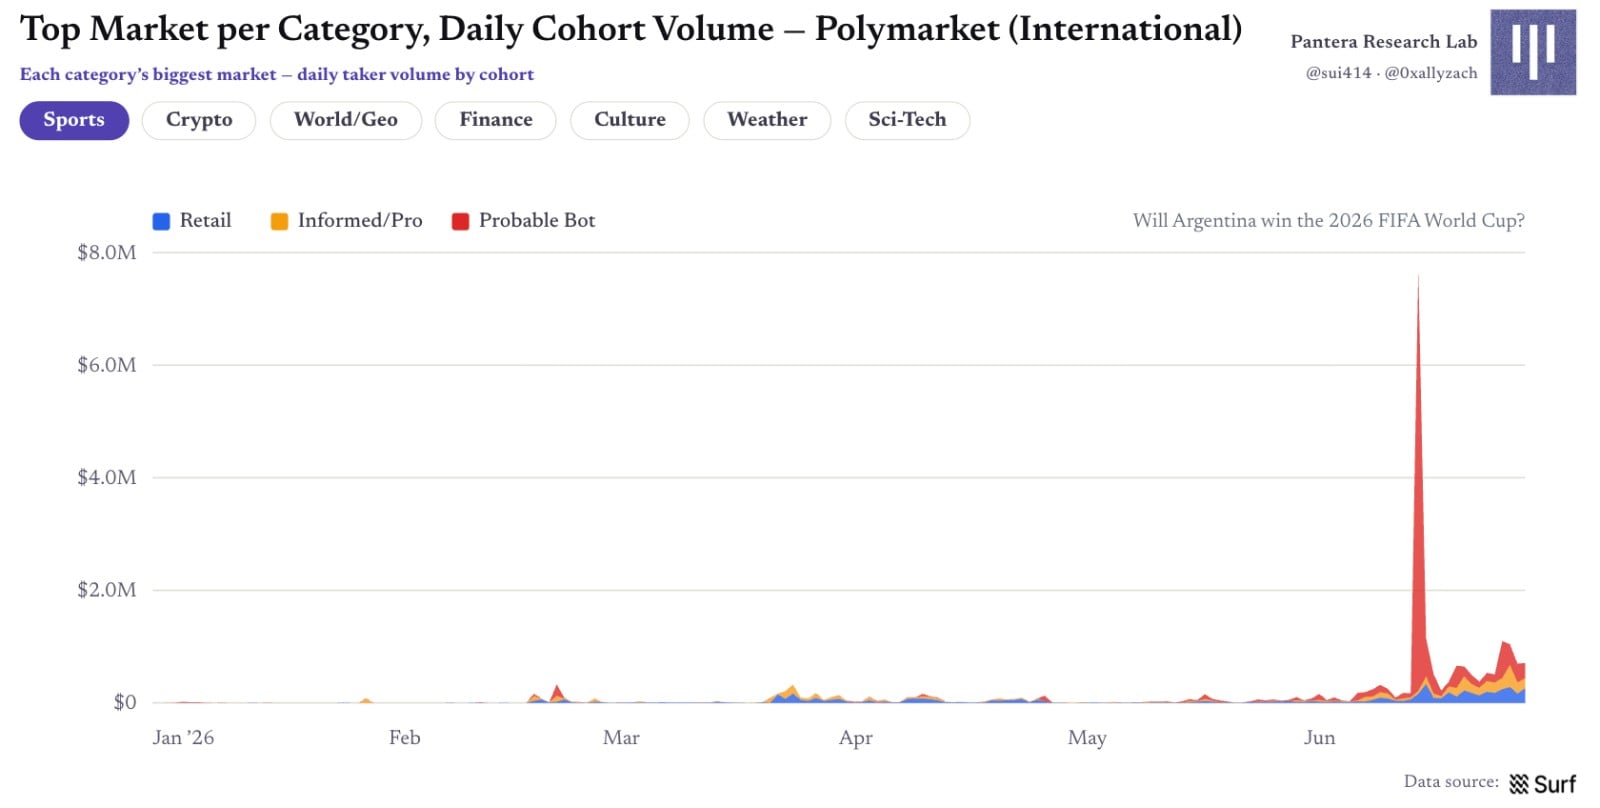
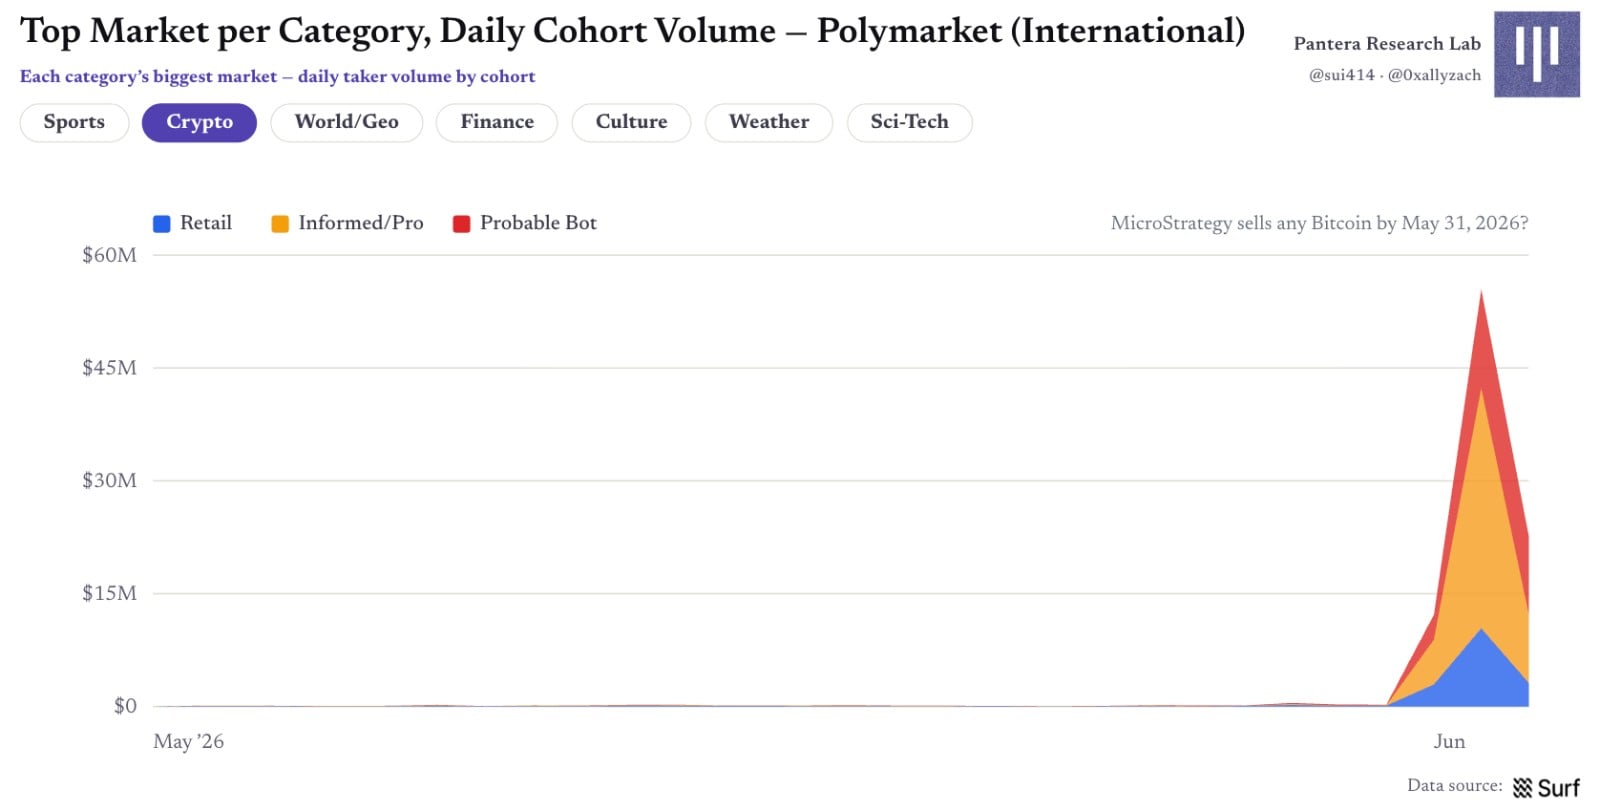
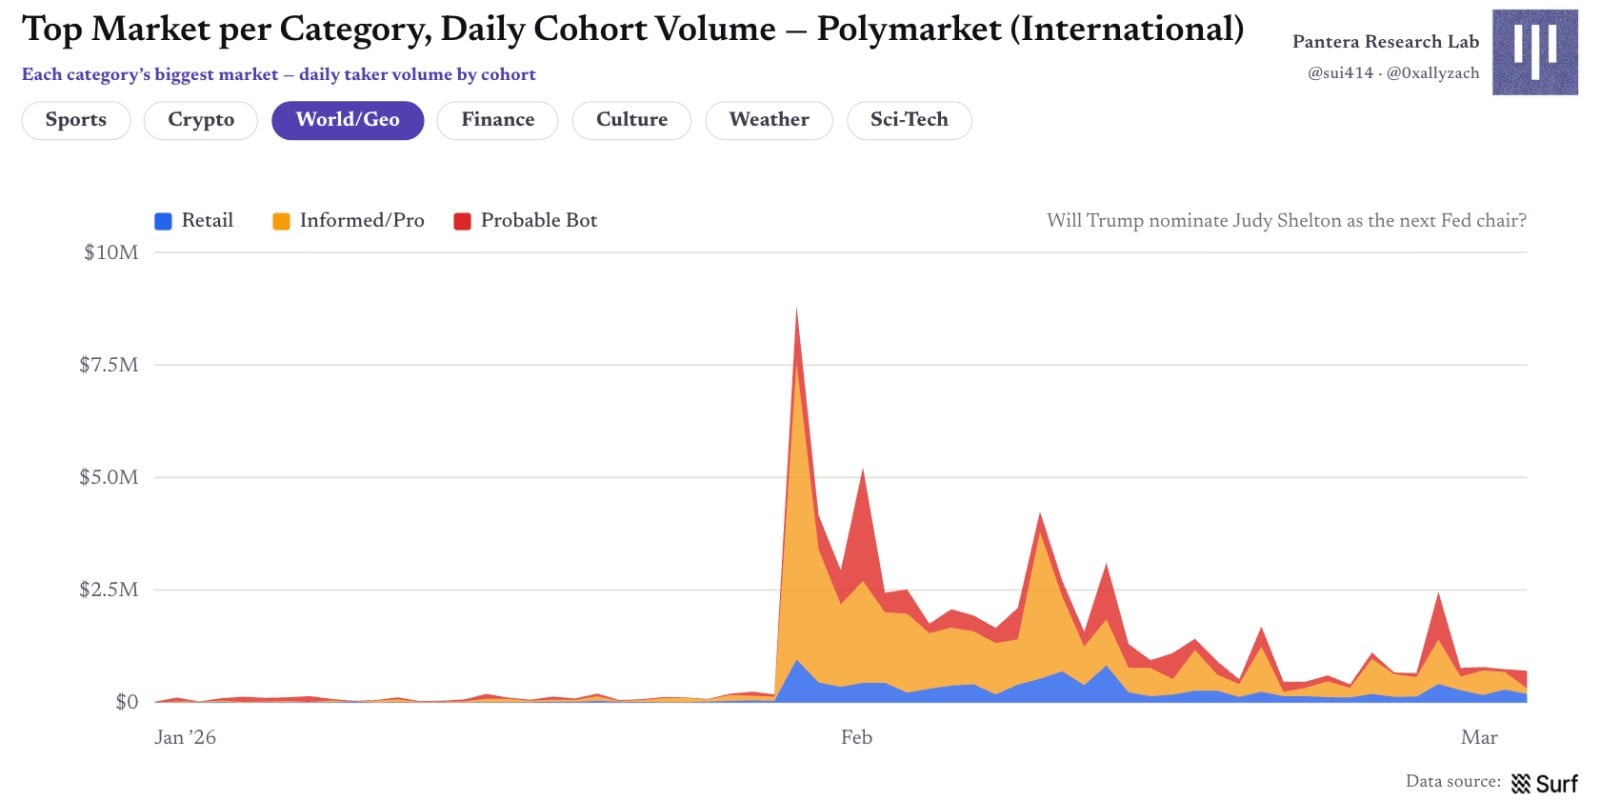
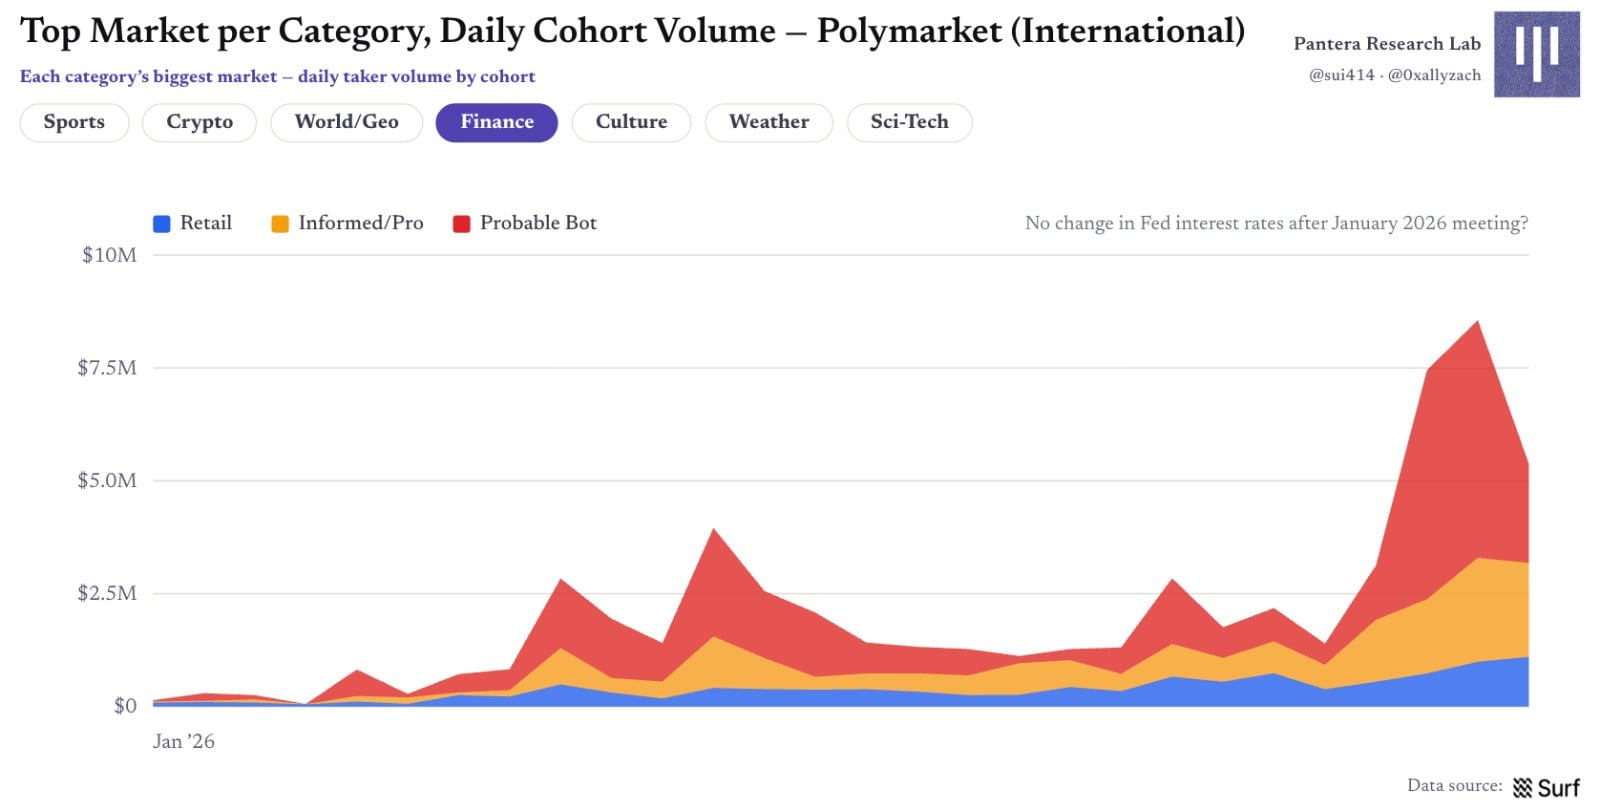
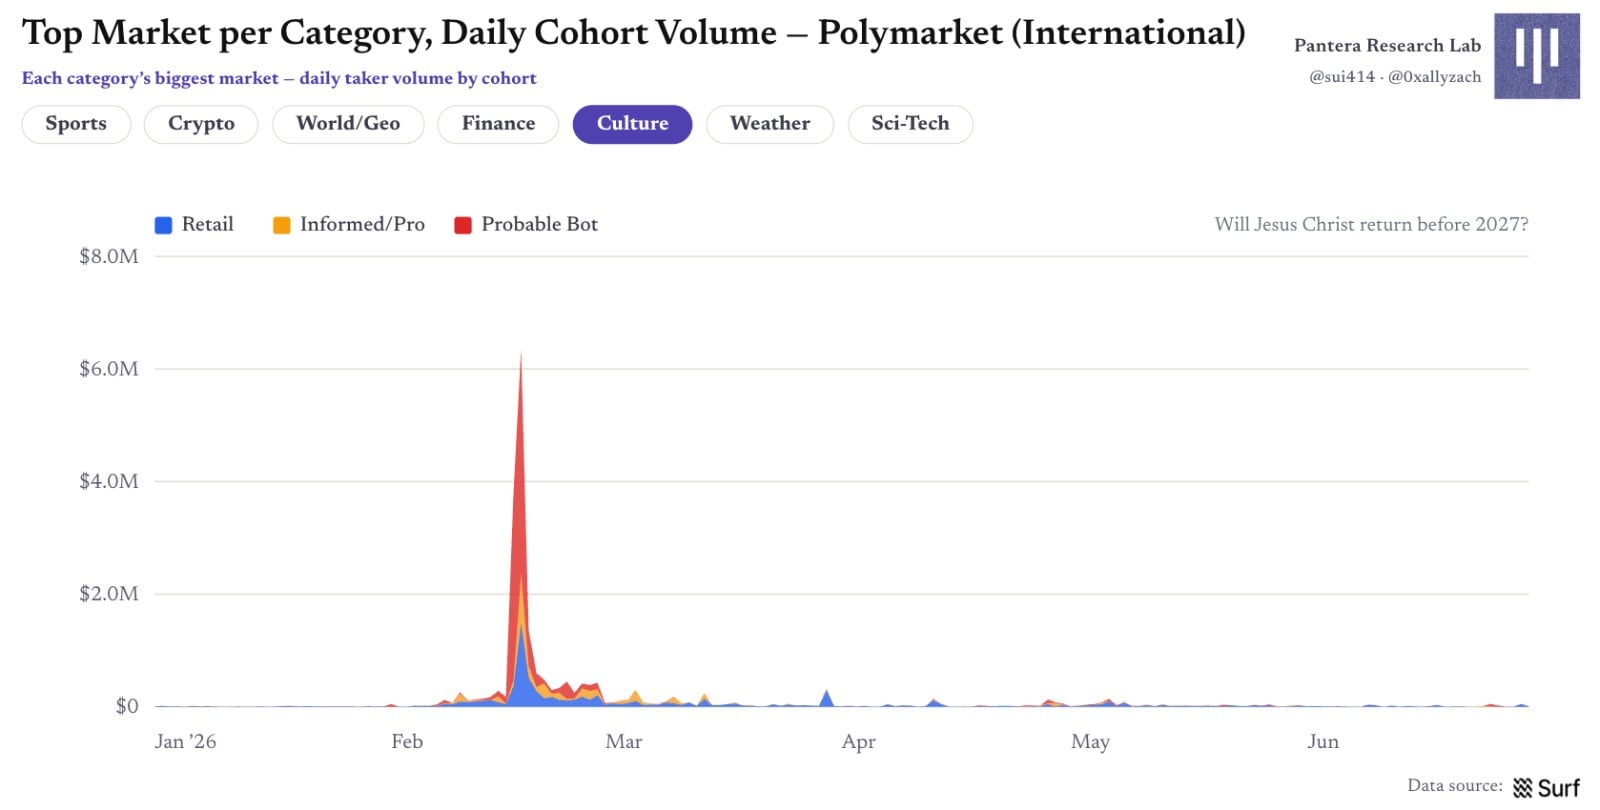
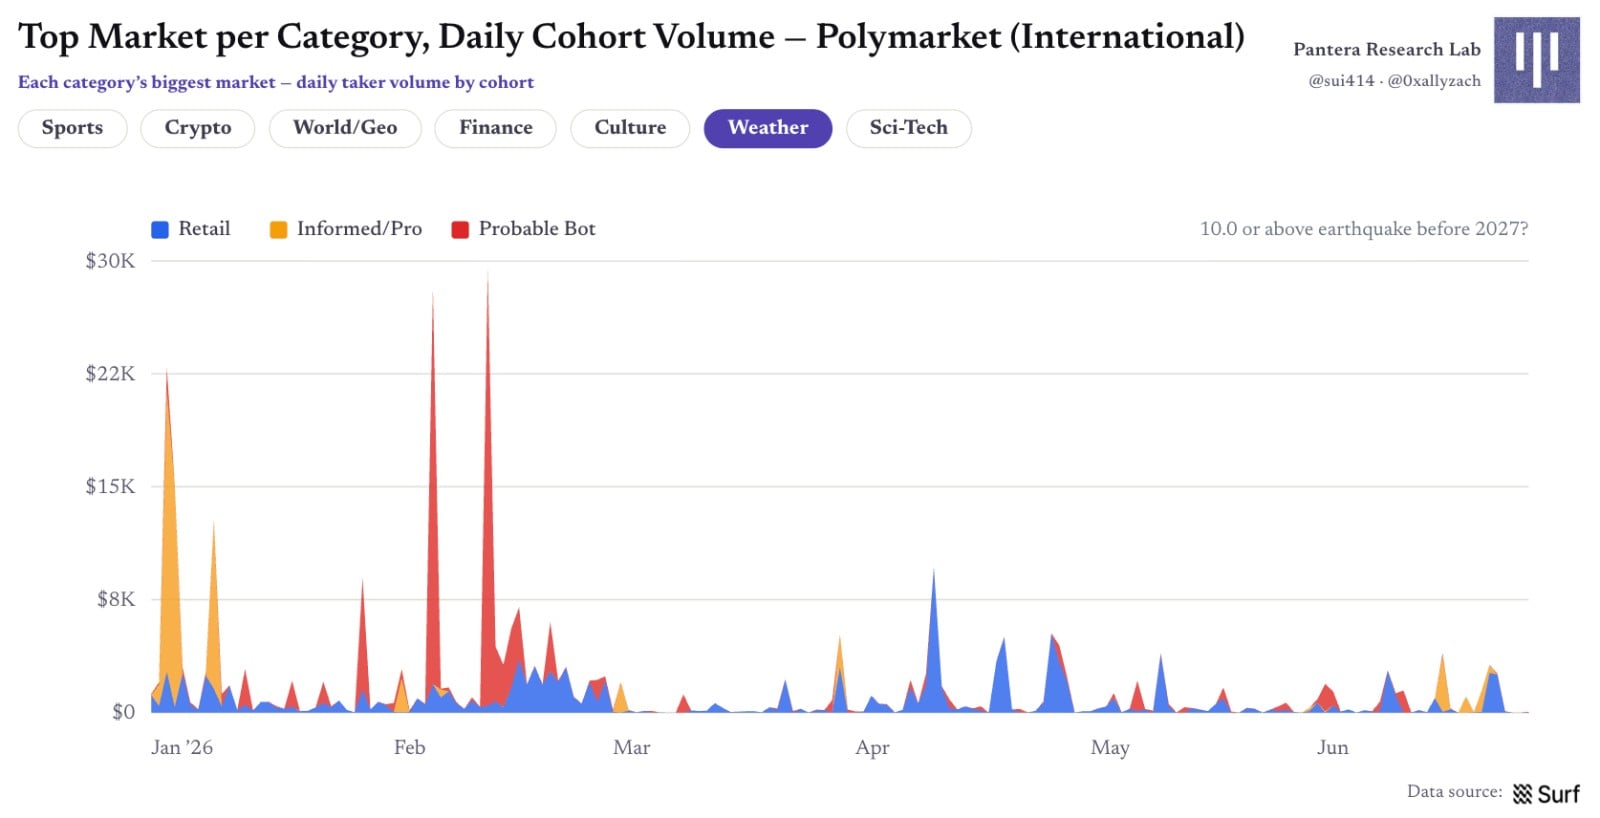
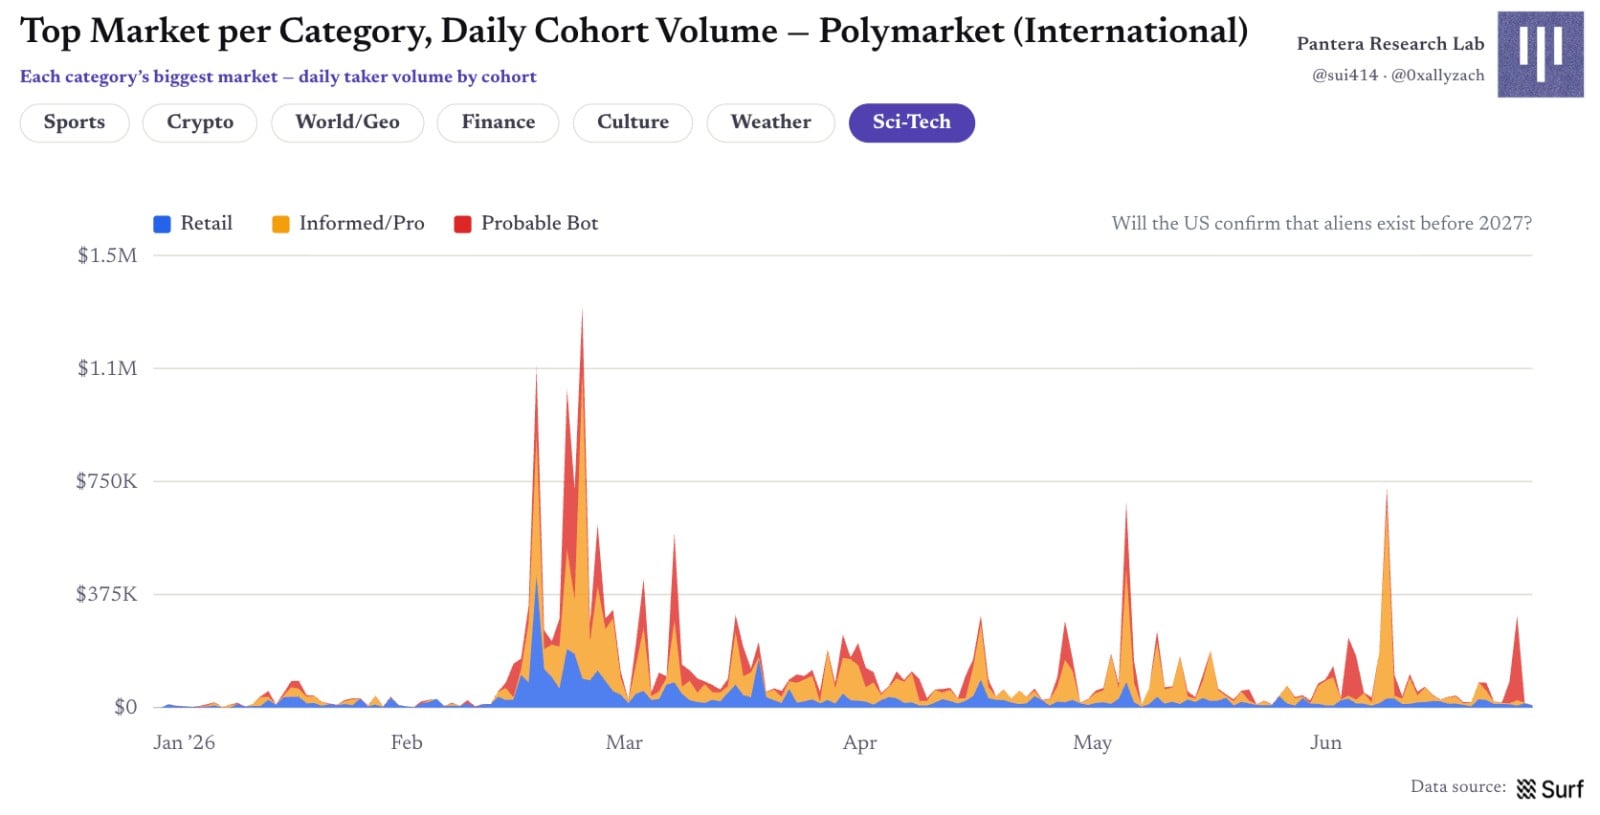
Figure 24 | Daily cohort volume in top markets per category
Who Actually Makes Money?
Summing position cash flows across all markets settled in H1, the pre-fee ledger nears zero: Of ~1.97M wallets with settled positions, 34% ended positive. Major winners totaled ~+$666M, major losers ~-$530M, with all groups netting roughly zero. This validates that we calculated pre-fee Gross PnL; deducting H1's ~$184M in fees would flip the aggregate result negative.
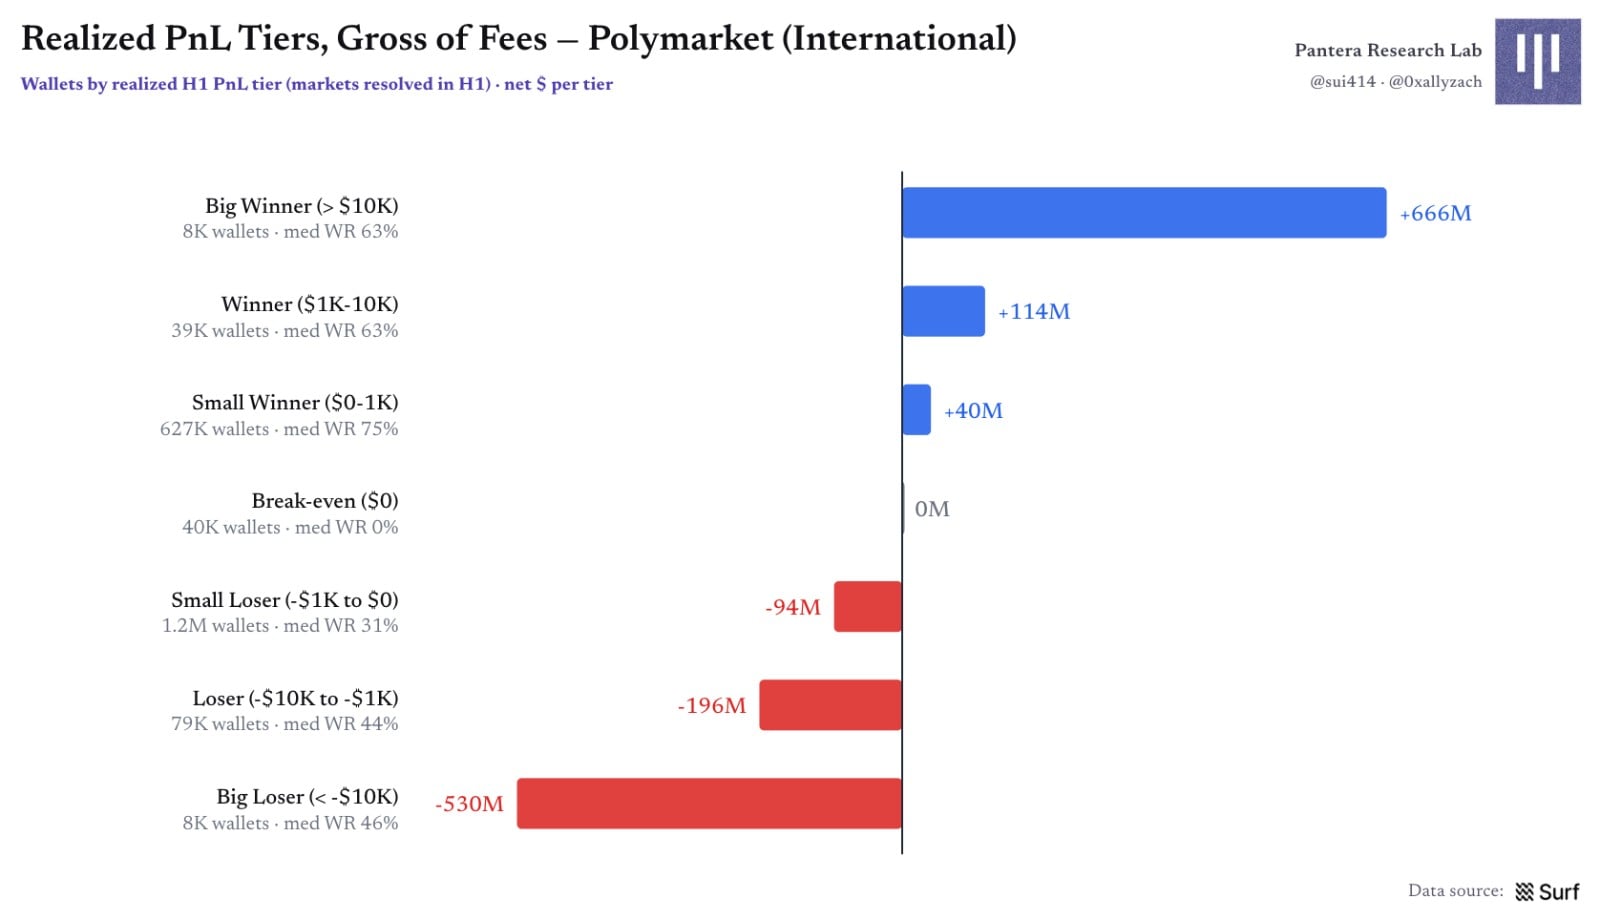
Figure 25 | Pre-fee realized PnL stratification
Disaggregated by cohort, capital flows are clear: retail and professional users collectively provide the counterparty for the bot cohort's positive returns. Bots are the only cohort with overall net profit, totaling ~+$108M, but only 27% of bot wallets are profitable, and the median bot wallet still loses. Profits are carried by a minority of large-scale operations; sustained profitability is extremely rare.
Professional users boast the highest win rate at ~42% positive wallets; retail ~35%, bots ~27%. Yet professionals collectively still lost ~$26M. Since multi-category incentives and rebates aren't included here, we cannot conclude professionals' final net yields are negative. The retail cohort totaled ~-$74M.
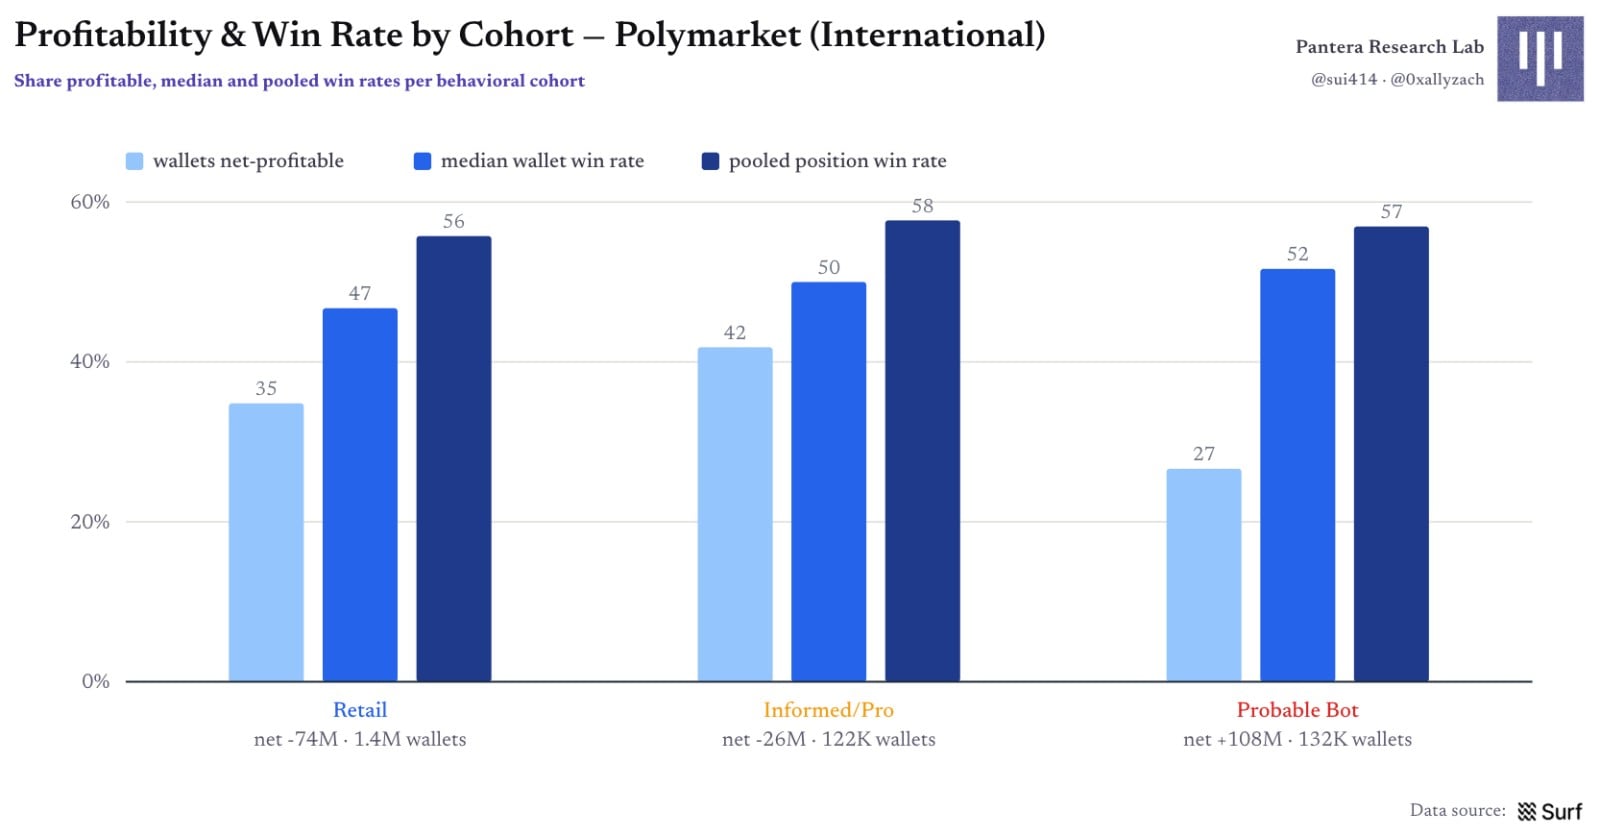
Figure 26 | Profit ratio and win rate by cohort
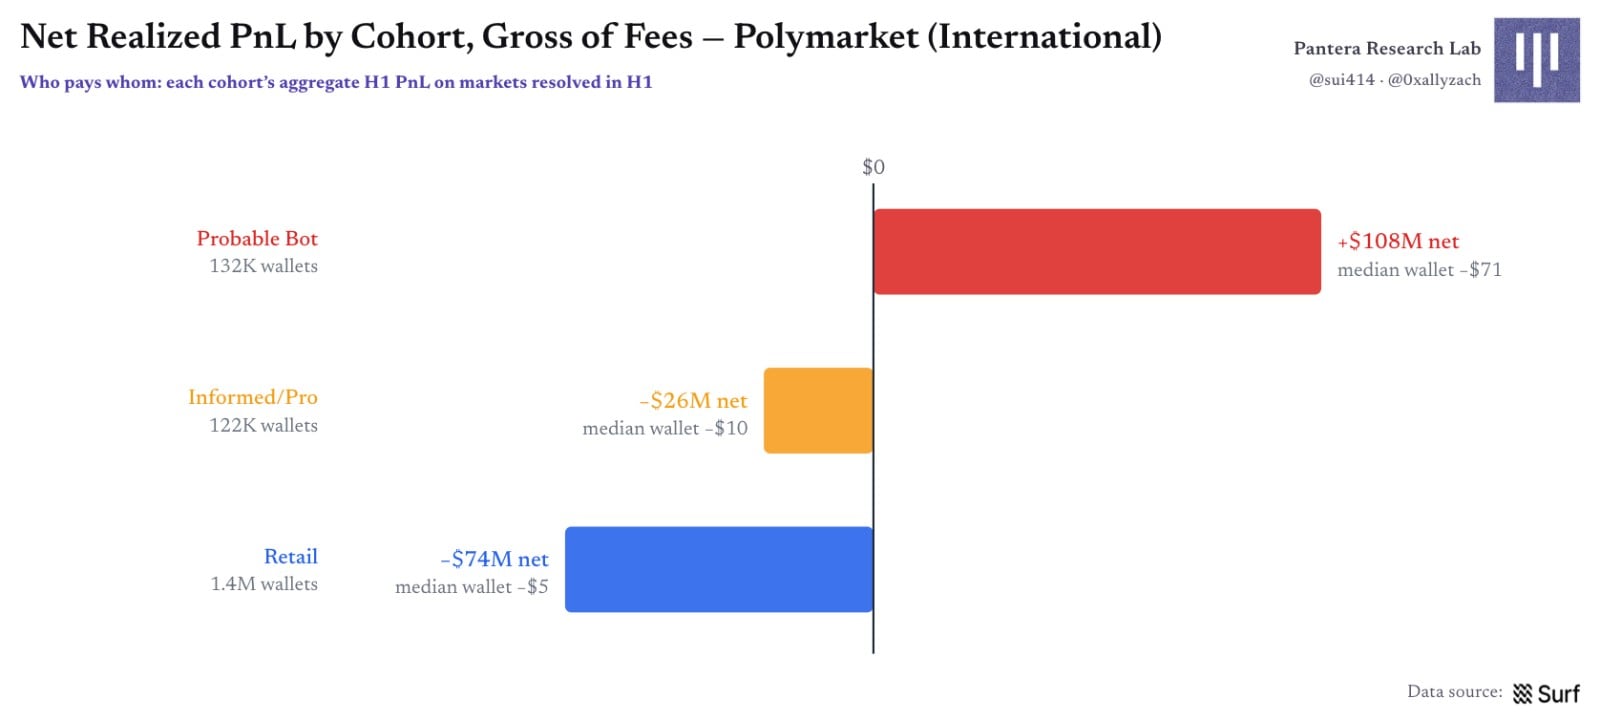
Figure 27 | Net realized PnL by cohort: Who pays, who gets paid
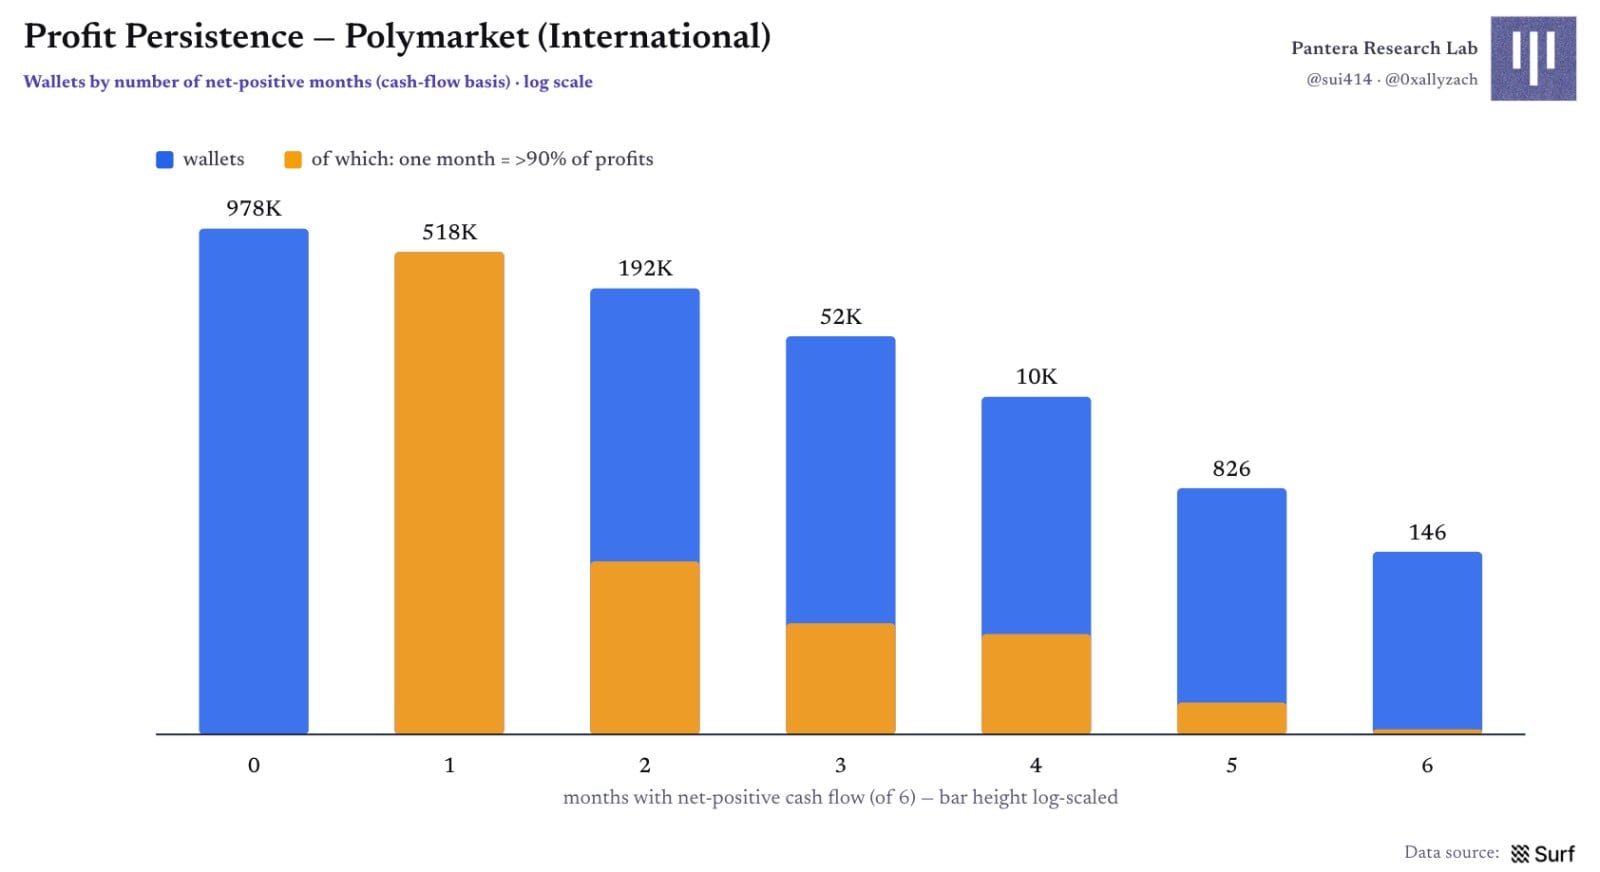
Out of ~1.75M wallets, only 146 maintained positive cash flow for six consecutive months; even among previously profitable wallets, >90% of many individuals' profits concentrated in a single month. Profit in prediction markets resembles sporadic spikes rather than steady salary streams.
Methodology & Metrics:
Data for this article was computed by Surf AI. PnL only accounts for markets settled in H1 2026 and calculates pre-fee realized results based on wallet cash flows within those markets; maker rebates, promotional incentives, and other planned subsidies are excluded from Gross PnL. Cohort labels are heuristic behavioral classifications for comparing trading styles and should not be interpreted as definitive identification of actual wallet owners.
Join TechFlow official community to stay tuned
Telegram:https://t.me/TechFlowDaily
X (Twitter):https://x.com/TechFlowPost
X (Twitter) EN:https://x.com/BlockFlow_News
 Surf