
On-Chain Data Breakdown: BTC Drops from $80,000; Open Interest Hits Annual High—Three Indicators Decipher Current Market Structure
TechFlow Selected TechFlow Selected
On-Chain Data Breakdown: BTC Drops from $80,000; Open Interest Hits Annual High—Three Indicators Decipher Current Market Structure
The $657 million long liquidations objectively completed a round of leverage cleanup, resulting in a healthier market structure than before the crash.
Author: Claude, TechFlow
TechFlow Intro: As Bitcoin rebounded to $80,000 in early May, exchange inflows hit the fastest pace since 2026, and perpetual futures open interest peaked at $29 billion on May 5. Binance alone accounted for 32% of the incremental inflows, while its stablecoin reserves rose from $49.9 billion to $53.1 billion. Yet high leverage also sowed the seeds of vulnerability: BTC retreated to ~$77,000 within a week, triggering $657 million in long liquidations.
During Bitcoin’s early-May push toward $80,000, one phenomenon you may have overlooked was the most aggressive derivatives market positioning seen this year.
According to CryptoQuant data, Bitcoin perpetual futures open interest reached $29 billion on May 5—the highest level since January 29. The 30-day rolling increase stood at $6.98 billion, the fastest growth rate so far in 2026. As capital flooded into exchanges, stablecoin reserves climbed in tandem, and altcoin deposit transaction volume surged to a four-month high.
CryptoQuant analyst Darkfost noted that this open interest expansion has already surpassed the scale seen during Bitcoin’s all-time high in 2025, underscoring strong market participation. However, he also warned that the concentration of large long and short positions has made markets more fragile—sharp price moves could trigger cascading liquidations that amplify volatility.
This warning was quickly validated. On May 18, following news that Trump hinted at potential military action against Iran, BTC plunged from above $80,000 to below $77,000 in a single day, resulting in $657 million in forced liquidations. As of publication, BTC trades near $77,000—down roughly 6% from its monthly high.
Binance Captures One-Third of Incremental Capital; Derivatives Market Concentration Rises Further
In this round of leveraged expansion, Binance further cemented its dominance.
Per CryptoQuant data, Binance’s Bitcoin open interest stands at $9.03 billion—73% higher than the second-ranked exchange. Gate.io and Bybit follow with $5.3 billion and $4.7 billion, respectively.
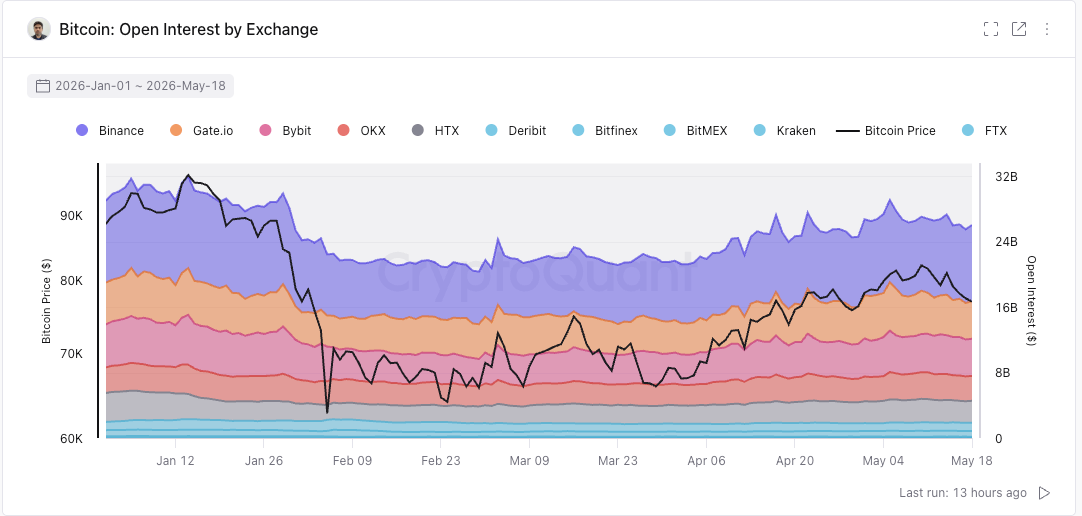
The concentration is even starker on an incremental basis: Binance’s 30-day open interest growth totaled $2.55 billion—32% of total market inflows over the same period. Gate.io added $1.7 billion, and Bybit added $1.1 billion. According to Bitcoinist, Darkfost’s analysis at CryptoQuant observed that despite negative funding rates persisting over recent weeks, open interest posted its largest increase since 2026.
A negative funding rate means shorts are paying longs to hold positions—but open interest still surged dramatically. This contradictory signal suggests new capital entered the market betting *against* the prevailing short consensus, positioning aggressively for BTC upside. In hindsight, this bullish wave indeed propelled BTC to $82,855—but the subsequent pullback also exposed the fragility inherent in excessive leverage.
Stablecoin Reserves Surge: Exchanges’ “Ammunition Stockpiles” Are Well-Funded
This derivatives buildup did not occur in isolation—spot liquidity improved in parallel.
Per CryptoQuant data, centralized exchanges’ aggregate USDT holdings rose from $49.9 billion on March 8 to $53.1 billion (ERC-20 token count). Binance’s USDT holdings increased from $35 billion to $39.3 billion—a ~12% rise.
Binance accounts for 67.02% of exchanges’ total stablecoin reserves, holding approximately $41 billion in USDT (including both ERC-20 and TRC-20 tokens). OKX ranks second at 9.81%, followed by Coinbase Advanced and Bybit at 7.45% and 7.4%, respectively.
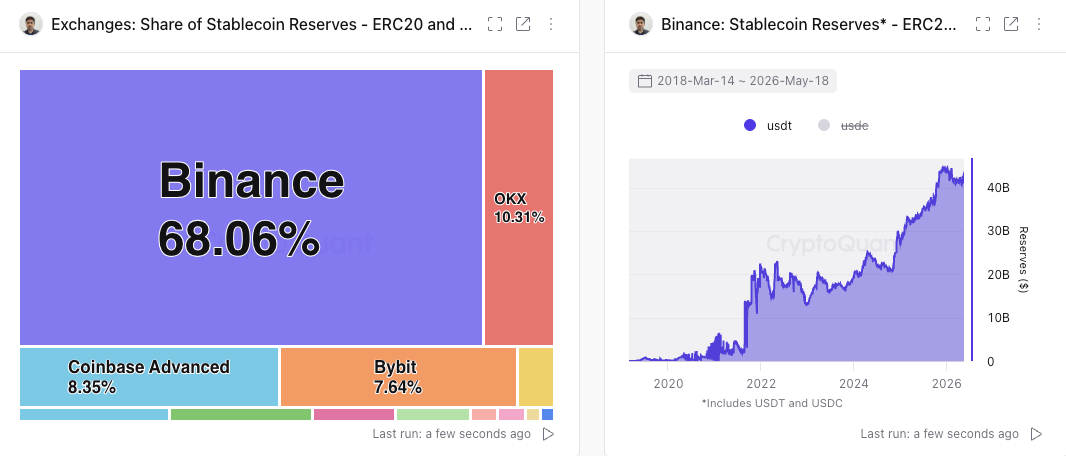
Rising stablecoin reserves are typically interpreted as accumulation of “deployable capital.” When funds flow from external wallets into exchanges and convert to stablecoins, it signals purchasing power building up—not withdrawing.
Looking at ETF data, U.S. spot Bitcoin ETFs recorded net inflows of $2.44 billion in April—the strongest monthly performance since October 2025. Institutional and exchange-level capital signals thus point in the same direction.
Altcoin Inflows Into Exchanges: Sell Pressure or Capital Rotation?
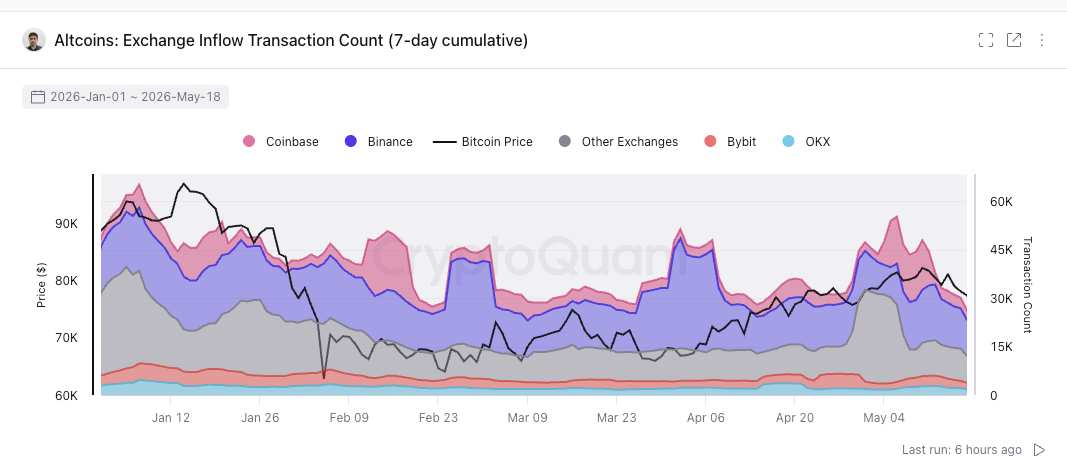
CryptoQuant data shows altcoin deposit transactions on exchanges hit ~57,000 on May 6—the highest level in nearly four months. Binance attracted the most altcoin deposits (~16,400), followed closely by Coinbase (~15,300).
Large-scale altcoin inflows into exchanges intuitively suggest sell pressure: tokens moving from wallets to exchanges usually indicate holders preparing to sell. But cross-referencing other metrics suggests this is more likely capital rotation—not broad-based withdrawal:
Exchange USDT reserves rose simultaneously, indicating capital remains inside the ecosystem—merely converted to stablecoins awaiting opportunity; Bitcoin open interest hit a yearly high, signaling capital rotating out of altcoins and into BTC derivatives; Goldman Sachs fully exited its XRP and Solana ETF positions by end-Q1, instead increasing its Bitcoin call option exposure—mirroring institutional “altcoin → BTC” reallocation.
This behavior pattern is common during strong Bitcoin rallies: investors lock in altcoin profits, rotate proceeds into stablecoins or Bitcoin, then redeploy once market direction clarifies. For altcoins, it implies short-term pressure—but for crypto’s overall liquidity pool, capital continues circulating internally.
The $80,000 Battle: Leveraged Expansion Meets Geopolitical Risk
Reviewing mid-May’s price action, BTC climbed from $78,000 to $82,855—driven by three converging forces: sustained ETF inflows, accumulating exchange capital, and aggressive derivatives positioning. On May 1 alone, spot Bitcoin ETFs saw $630 million in net inflows. Strategy added ~25,000 BTC for ~$2 billion last week, pushing its total holdings to ~844,000 BTC.
Yet high leverage itself breeds fragility. May 18’s pullback proved exactly that: after Trump signaled possible military action against Iran on Truth Social, BTC fell from $81,070 early in the week to ~$77,119—logging its worst weekly performance since February. The Fear & Greed Index dropped to 28 (“Fear”), and ETF flows reversed sharply—spot Bitcoin ETFs recorded over $1 billion in net outflows for the week.
Darkfost’s earlier warning materialized: rapid open interest growth had accumulated massive liquidatable positions; once external shocks triggered price declines, the liquidation cascade amplified losses.
Now, the $657 million in long liquidations objectively completed a round of deleveraging—leaving market structure healthier than before the crash.
Three indicators warrant close tracking going forward:
First, exchange stablecoin reserves. The $53.1 billion in USDT remains parked on exchanges—capital has not exited. The destination of this “dry powder” will determine rally strength: only if stablecoins begin flowing *out* of exchanges back onto-chain would signal true bearishness.
Second, ETF fund flows. April saw $2.44 billion in net inflows—but last week reversed into >$1 billion net outflows. If ETFs post two consecutive weeks of net outflows, the institutional demand pillar may be weakening.
Third, Strategy’s $75,537 average holding cost. This is the nearest institutional psychological support level. Holding above it sustains the “buy-the-dip” narrative; breaking below it removes 2026’s most stable buyer—and next support lies at April’s low of $74,900.
Join TechFlow official community to stay tuned
Telegram:https://t.me/TechFlowDaily
X (Twitter):https://x.com/TechFlowPost
X (Twitter) EN:https://x.com/BlockFlow_News