Bitcoin’s Rally Meets Resistance and Pulls Back: $78,200 Becomes Resistance Level; $71,400 Emerges as Key Support
TechFlow Selected TechFlow Selected
Bitcoin’s Rally Meets Resistance and Pulls Back: $78,200 Becomes Resistance Level; $71,400 Emerges as Key Support
Weak spot demand and slowing ETF inflows have clearly cooled bullish momentum.
 Navigating Web3 tides with focused insights
Author: Glassnode
Translation & Editing: AididiaoJP, Foresight News
Bitcoin remains structurally resilient, yet weakening spot demand, slowing ETF inflows, and increasingly crowded long positions suggest that upward momentum is quietly cooling beneath the surface.
Summary
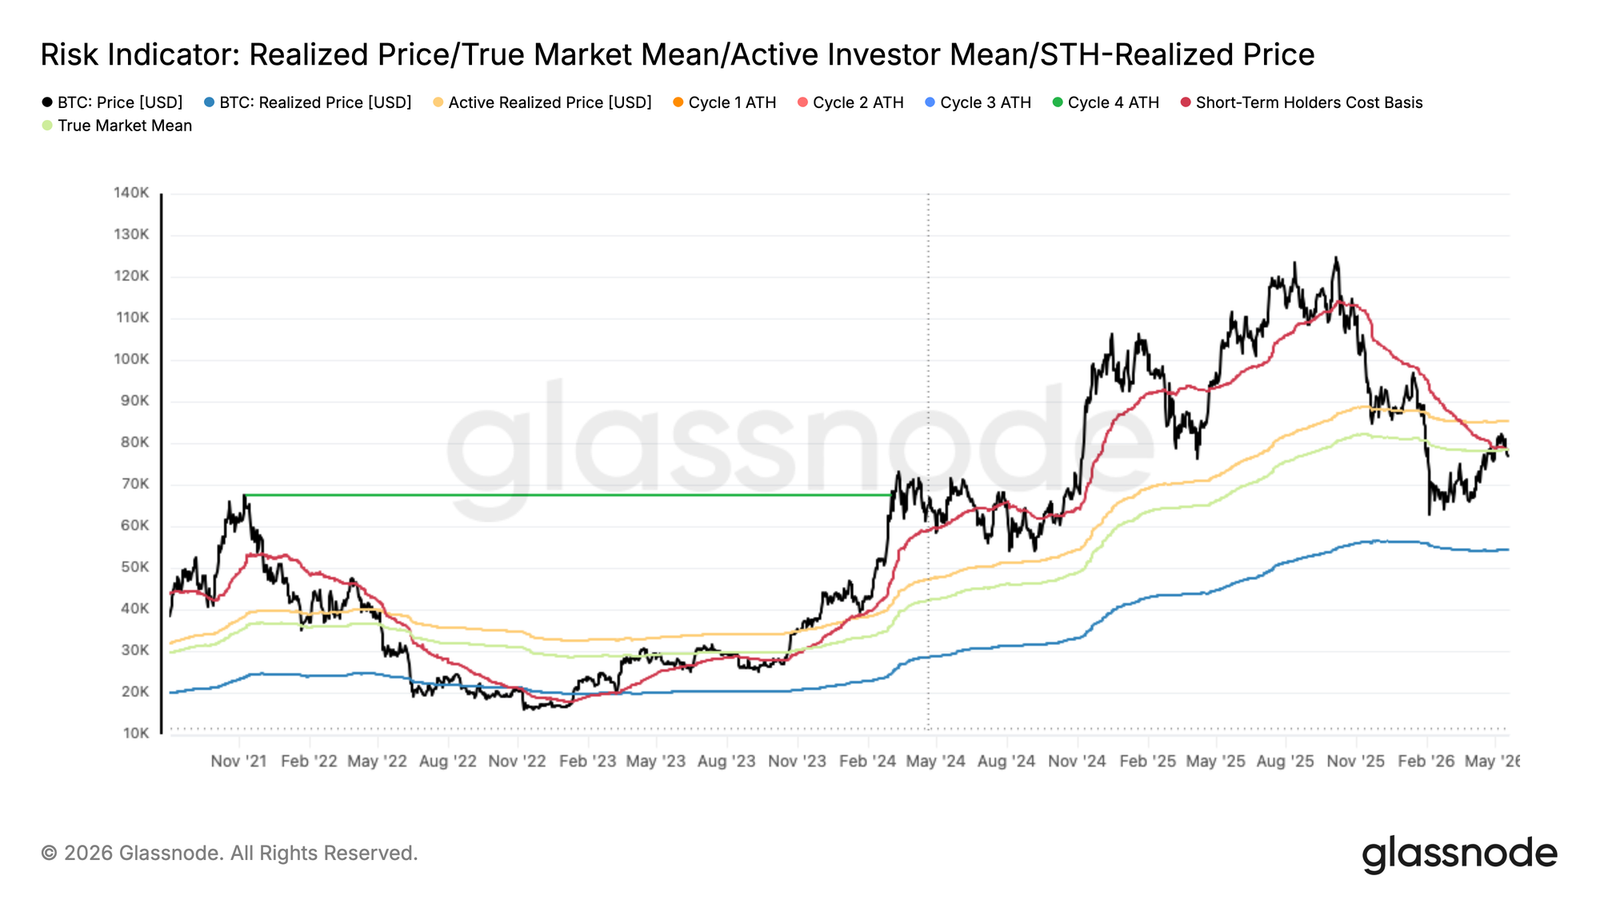
- Bitcoin has reclaimed the True Market Mean (TMM) of $78,300 but failed to sustain it. Historically, confirmation of a credible bull-market transition requires weeks to months of consolidation near this level.
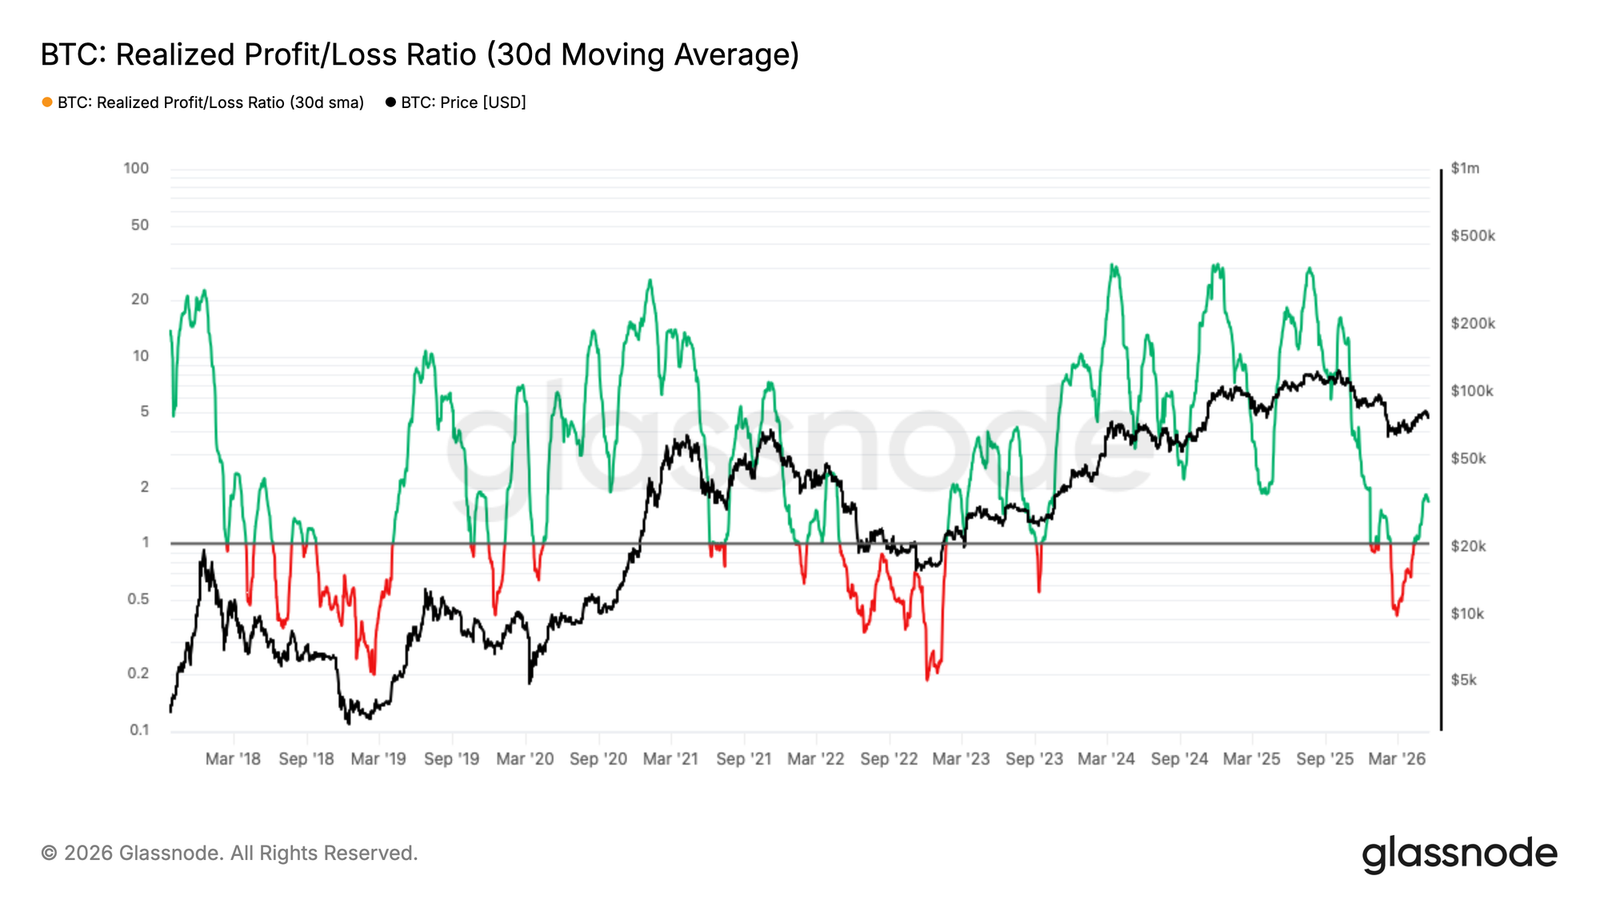
- The 30-day realized profit-to-loss ratio’s SMA surged from 0.4 in February to 1.8 during the recent rally—indicating insufficient demand to absorb waves of profit-taking. A sustained reading above 2 is needed to signal genuine buyer recovery.
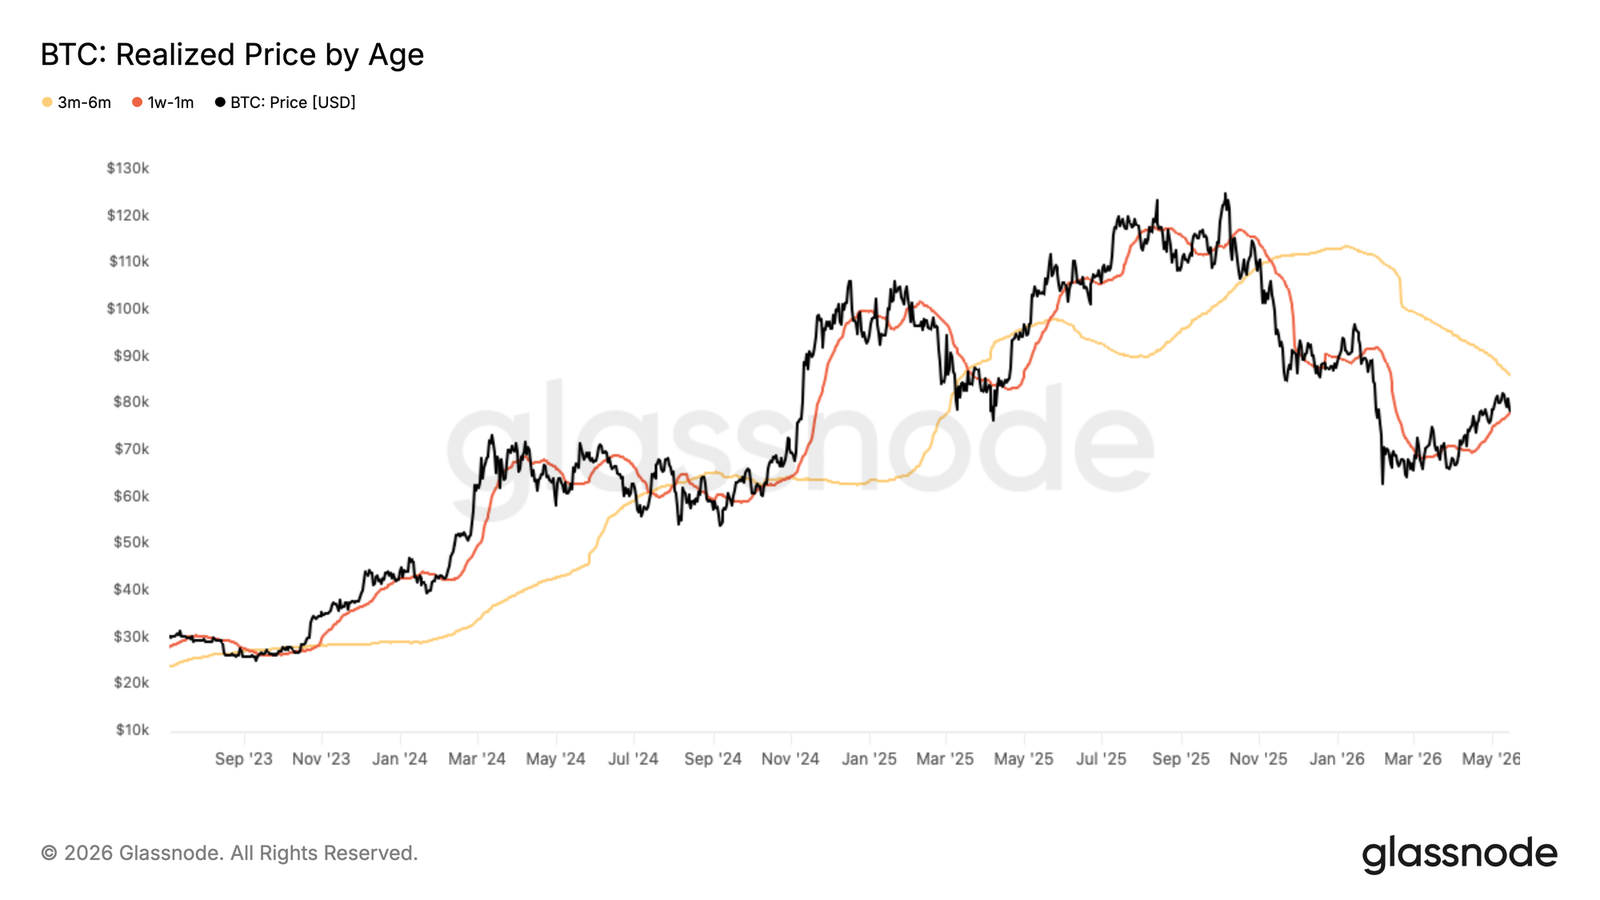
- The 30-day cost basis at $78,200 has shifted from support to resistance above price, while the cost basis of holders who accumulated between February and April ($71,400) now serves as the most immediate support level for this pullback.
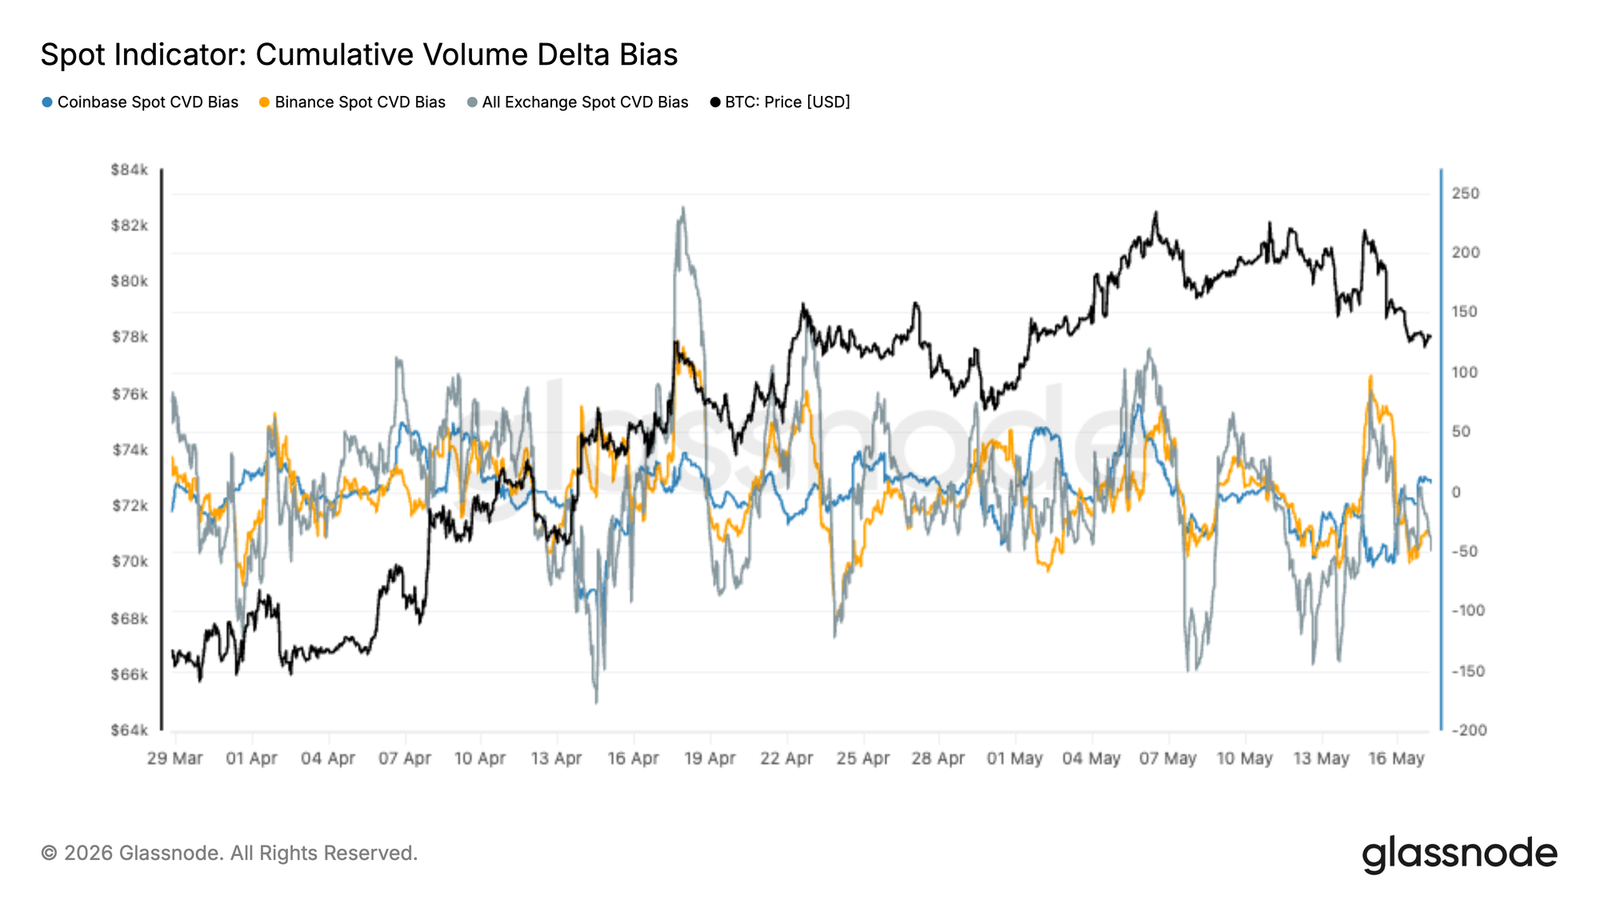
- Internal spot-market indicators have weakened over recent weeks: total spot CVD remains predominantly negative, and Coinbase activity continues to lag. This suggests U.S. institutional spot participation remains tepid despite occasional surges in overseas speculative demand.
- CME futures open interest continues rising alongside price, signaling improving institutional participation in derivatives—even as spot demand remains indecisive near current upper-range levels.
- U.S. spot ETF accumulation momentum has recently begun to slow. The 30-day change in ETF holdings flattened notably after strong buying in April and early May, indicating diminishing aggressiveness in U.S. institutional spot demand near current elevated price levels.
- Implied volatility is rebuilding from lows—primarily in the front-end—while longer-dated expectations remain stable. Realized volatility continues falling, widening the volatility risk premium and keeping hedging costs relatively low.
- Options positioning remains defensive. Skew shows renewed demand for downside protection, while the short gamma cluster near $75,000 makes spot more vulnerable to amplified hedging flows and sharper price swings.
Macro Insights
The macro backdrop has clearly tightened: markets now face a stronger dollar, higher yields, and resurgent inflationary pressure from energy markets. The DXY has risen to a six-week high; U.S. 10-year yields have climbed above 4.6%, and 30-year yields are approaching multi-year highs—reflecting a sharp repricing of rate expectations. Markets now assign a higher probability to Fed rate hikes before year-end, reversing earlier dovish expectations.
Commodities are reinforcing this tighter macro shock. Oil remains elevated amid Middle East supply risks, keeping inflation expectations active and constraining rate-cut room. Gold struggles to advance amid rising real yields and a stronger dollar—indicating that safe-haven flows are being challenged by tighter financial conditions.
For digital assets, the landscape remains constructive—but more fragile. Bitcoin’s resilience amid higher yields and a stronger dollar signals underlying demand persists; however, macro shocks no longer unambiguously favor upside. Sustained gains may require oil stabilization, yield declines, and loss of DXY momentum—enabling looser liquidity conditions and broader risk appetite expansion.
On-Chain Insights
Testing the Bull-Bear Threshold
The recent rebound to $82,000 marks a significant reclamation of the True Market Mean (TMM) at $78,300. This model tracks the average acquisition cost of actively traded BTC supply and historically demarcates bear and bull markets. Reclaiming this level is a necessary—but not sufficient—condition for structural transition. Conventionally, a credible trend shift requires weeks to months of sustained consolidation near this model. A single decisive break above the TMM, while constructive, does not yet meet this threshold.
Thus, any deeper pullback from current levels would redefine the recent rally as a local high within an ongoing bear market—a structure observed repeatedly in prior cycles and still the higher-probability outcome until sustained follow-through emerges.
Profit-Taking Outpacing Demand
Examining the internal mechanics of the recent rebound, the realized profit-to-loss ratio provides a precise gauge of market health. This metric measures the ratio of on-chain realized profit (in USD value) to realized loss; readings above 1 indicate profit-taking dominance, while those below 1 reflect loss-realization dominance.
Its 30-day SMA surged from a February low of 0.4 to 1.8—reflecting a rational shift in spending following the price rebound. Yet the market failed to sustain momentum amid this rising wave of profit-taking, suggesting demand has not yet recovered sufficiently to absorb sellers seizing the rally to exit.
A decisive and sustained stabilization of the 30-day (or 90-day) SMA above 2 for multiple weeks would constitute a more meaningful signal—indicating genuine buyer conviction and market capacity to digest distribution pressure without retracing.
Cost-Basis Levels Define New Ranges
As price falls below the True Market Mean, time-based realized price metrics provide a granular framework for mapping immediate support and resistance. This model tracks the average purchase price of coins segmented by holding period—directly anchoring investor cohort behavior to the price chart. The cost basis of the recent 30-day accumulation wave (which drove the rebound) sits near $78,200. With price now below this level, that cohort has shifted into unrealized loss—transforming prior support into overhead supply and adding incremental selling pressure to any rebound attempt.
Below spot, the cost basis of investors who accumulated during the February–April consolidation phase (now classified as 1–3 month holders) sits near $71,400. As their profit margins narrow—and with growing incentive to protect gains if conditions deteriorate further—this represents the most likely near-term support level.
Off-Chain Insights
Resurgence of Spot Selling Pressure
Latest spot flow data continues revealing underlying weakness in aggregate demand: all-exchange spot CVD remained negative during the recent pullback toward the $77,000 high. This indicates selling pressure continues exceeding aggressive spot buying across major exchanges.
Recently, Binance spot flows modestly rebounded from deeply negative territory, while Coinbase activity remained relatively muted. This divergence suggests stronger overseas speculative participation, whereas U.S. institutional spot demand remains unconvinced near current price levels.
Despite Bitcoin’s relative structural resilience, latest spot positioning data indicates broad-based spot accumulation has not yet fully re-emerged.
CME Recovery vs. Slowing ETF Demand
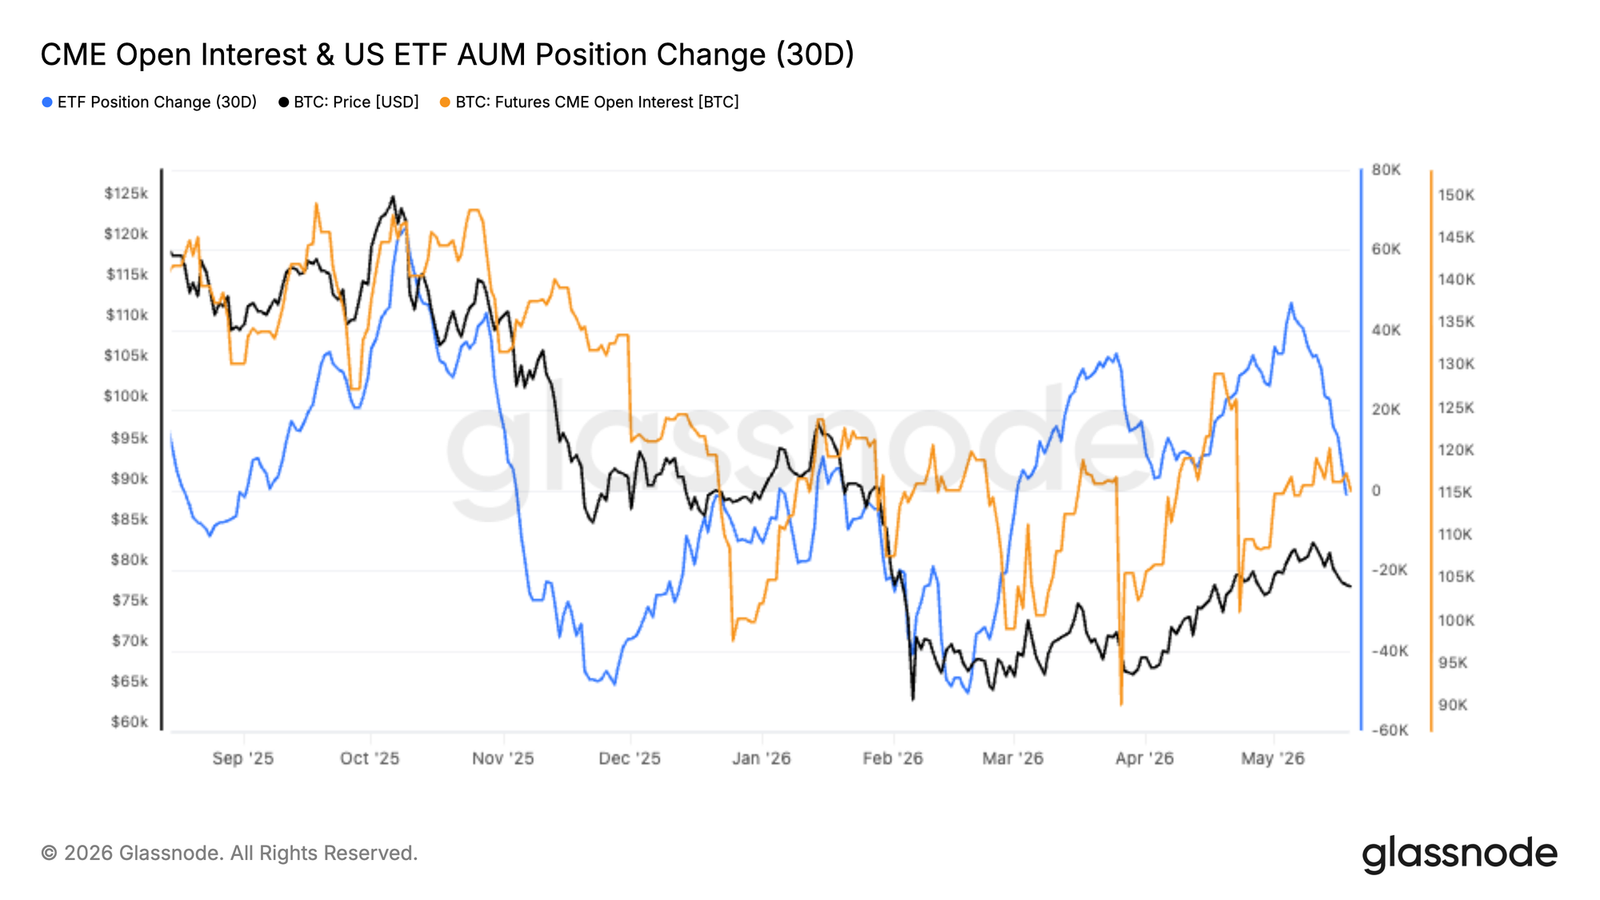
CME futures open interest continued rising steadily as Bitcoin rebounded into the low-$80,000 range—suggesting institutional traders are rebuilding exposure after February’s selloff. This CME revival signals growing institutional participation in derivatives, even amid persistently restrictive macro conditions.
Meanwhile, U.S. spot ETF accumulation momentum has begun to slow. The 30-day change in ETF holdings flattened markedly after strong buying in April and early May—indicating waning aggressiveness in U.S. institutional spot demand near current price levels.
The result is a market increasingly driven by futures positioning—not robust spot accumulation. Recent upside continues attracting leveraged participation, but fresh spot buying has slowed as Bitcoin approaches the upper end of its current range.
Spot Weakness Amid Crowded Longs
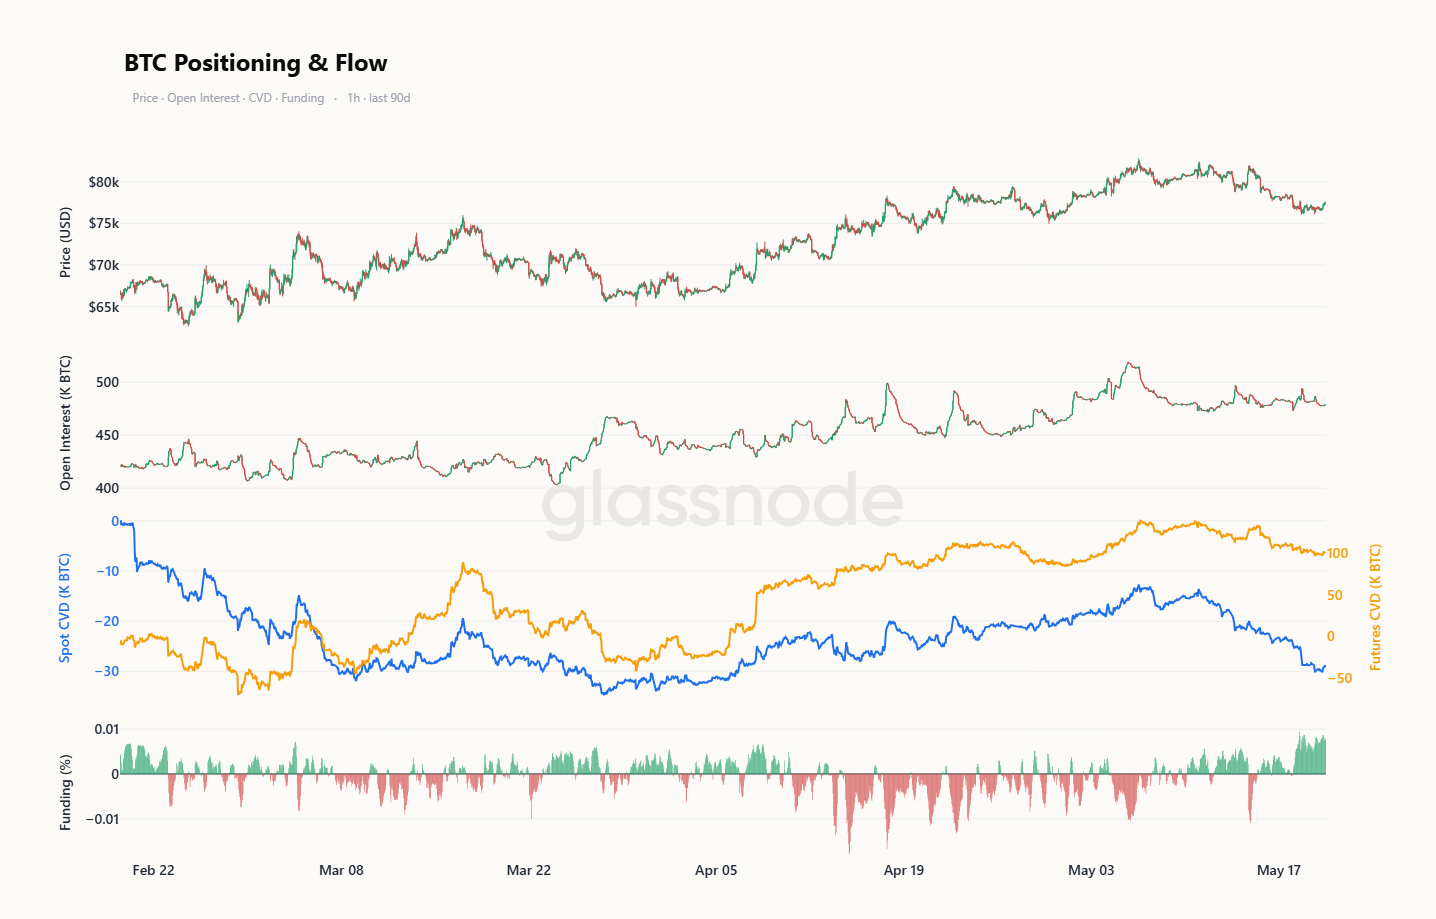
Latest order-flow data shows the recent pullback is primarily spot-driven beneath the surface. Futures open interest declined only modestly and remains elevated relative to the last time Bitcoin traded in this range, while spot CVD weakness far exceeds futures CVD weakness. This indicates the recent decline stems more from persistent spot selling than aggressive short positioning.
Funding rates reinforce this picture. Rather than resetting downward with price, funding rates have remained positive—and recently begun strengthening again—indicating leveraged longs continue paying fees to maintain exposure amid weakness.
Taken together, the market maintains elevated long positioning despite weak spot demand—a configuration typically resolved via either fresh spot buying or broader derivatives unwinding.
Implied Volatility Rebuilding from Lows
Beginning with implied volatility, markets are repricing volatility—but from a low base.
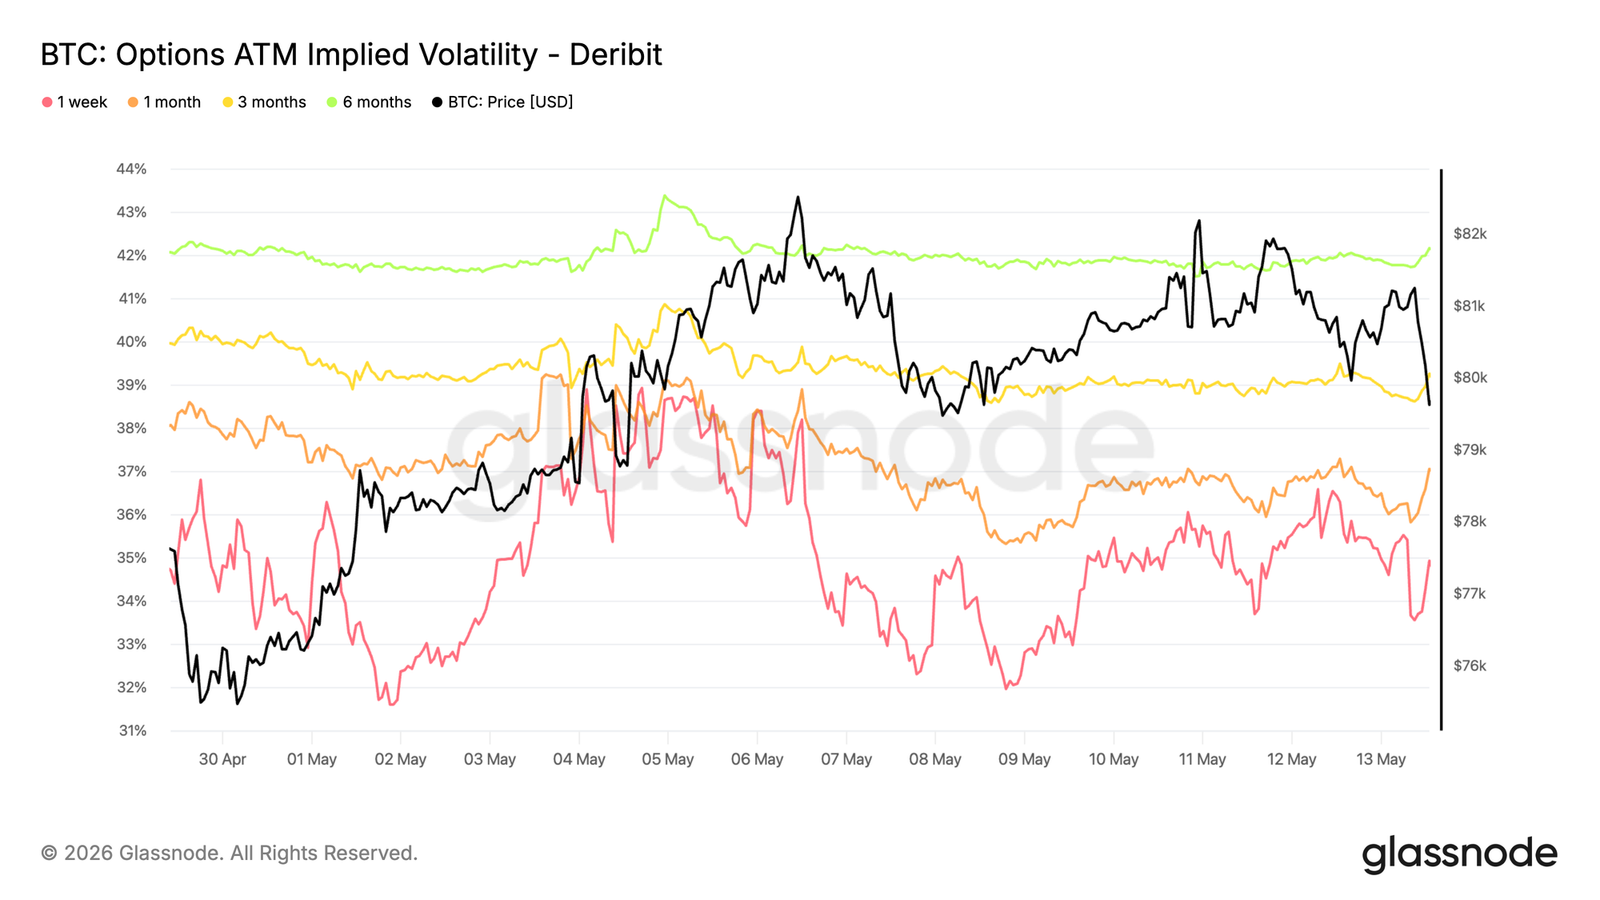
Bitcoin’s implied volatility across tenors rose week-on-week: front-end volatility increased from 32% to 36%. The 6-month tenor held relatively steady near 42%, suggesting longer-dated expectations remain unchanged despite recent spot volatility.
The chart shows pronounced front-end sensitivity to spot movement within the trading range, while the back-end remains anchored. Traders are paying marginally higher premiums for short-dated options—but have not yet assigned a broader volatility regime shift.
With implied volatility still near recent lows, hedging costs remain relatively inexpensive—especially for short-term event risk.
Current structure reflects mild short-term volatility demand rebuilding, while longer-dated expectations hold steady and largely unchanged.
Falling Realized Volatility Widens Volatility Risk Premium
As implied volatility rebuilds mildly, realized volatility continues trending lower.
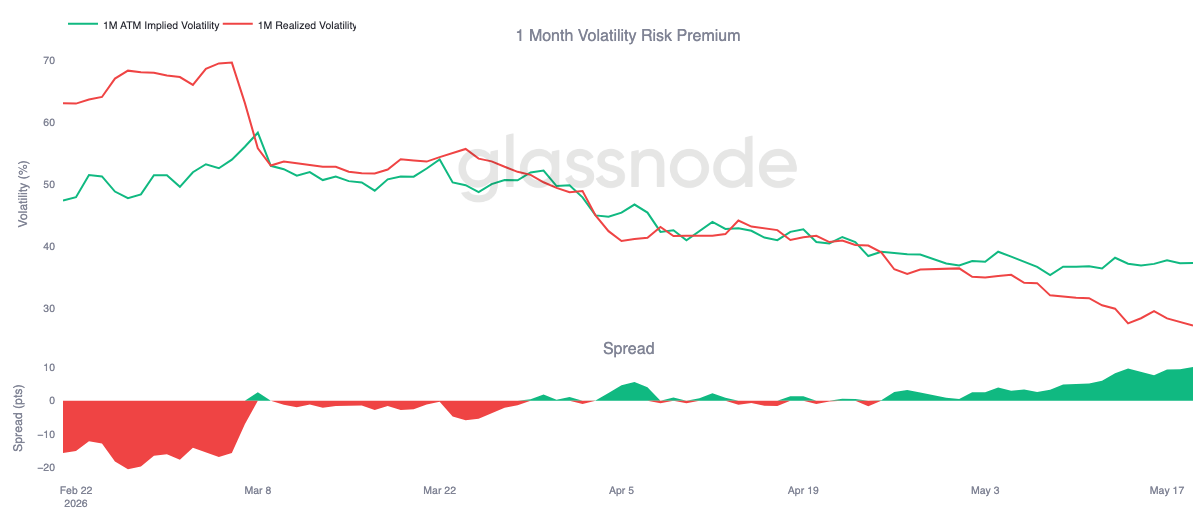
Bitcoin’s 30-day realized volatility currently stands at 27%, extending its multi-week downward trajectory. Meanwhile, 1-month implied volatility remains near 37%—keeping implied volatility significantly above realized volatility.
This pushes the 1-month volatility risk premium back to ~10 volatility points—the highest level in recent weeks. The right side of the chart shows steady widening, driven more by continued compression of realized volatility as spot action stabilizes—not aggressive implied buying.
For hedgers, the key takeaway is that—despite recent implied volatility rebuilding—protection costs remain relatively low.
Current structure reflects a market where realized volatility is declining faster than implied volatility is repricing downward—allowing the volatility risk premium to widen further.
25-Delta Skew Shows Renewed Downside Demand
While implied volatility begins mild rebuilding, skew shows traders remain focused on bidding for protection—not upside exposure.
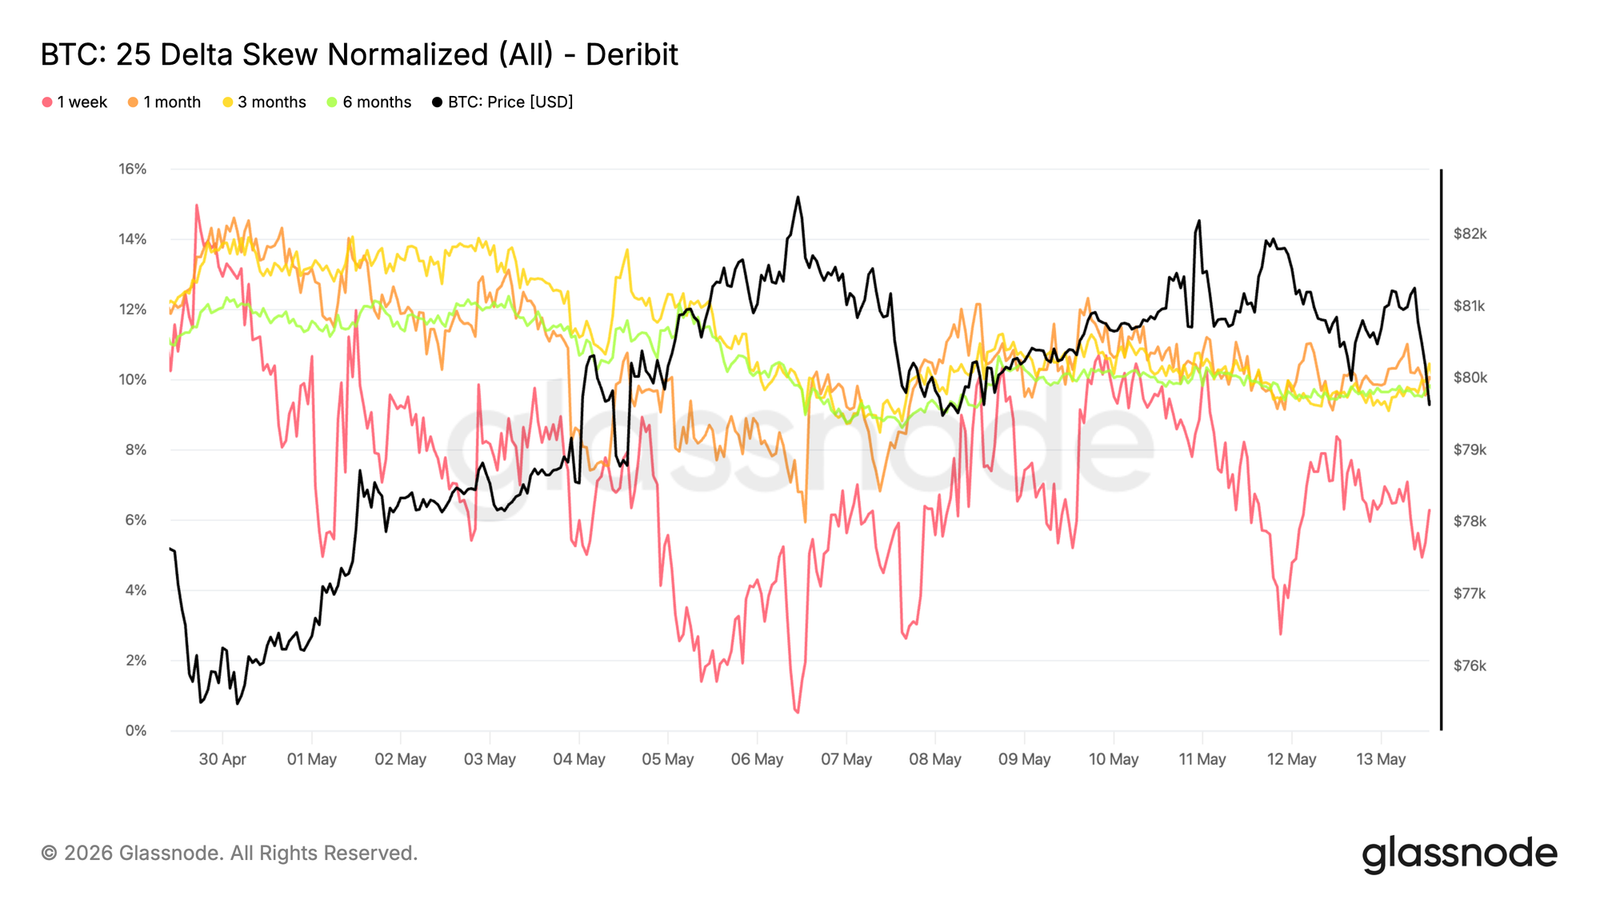
Bitcoin’s 25-delta skew turned more bearish over the past week, with traders paying higher premiums for downside protection across tenors. This shift is most pronounced at the front-end, where skew rose from 2.7% to 6.2%—signaling a sharp increase in short-dated put demand.
Longer tenors also show higher put premiums—but to a lesser degree—with the 6-month tenor remaining near the 10% range. This suggests markets are not only hedging near-term risk but maintaining broader downside protection preferences.
Current skew structure reflects a clear defensive tilt—even as implied volatility remains relatively low—indicating short-term hedging demand is rebuilding.
Gamma Exposure Reveals Fragile Price Range
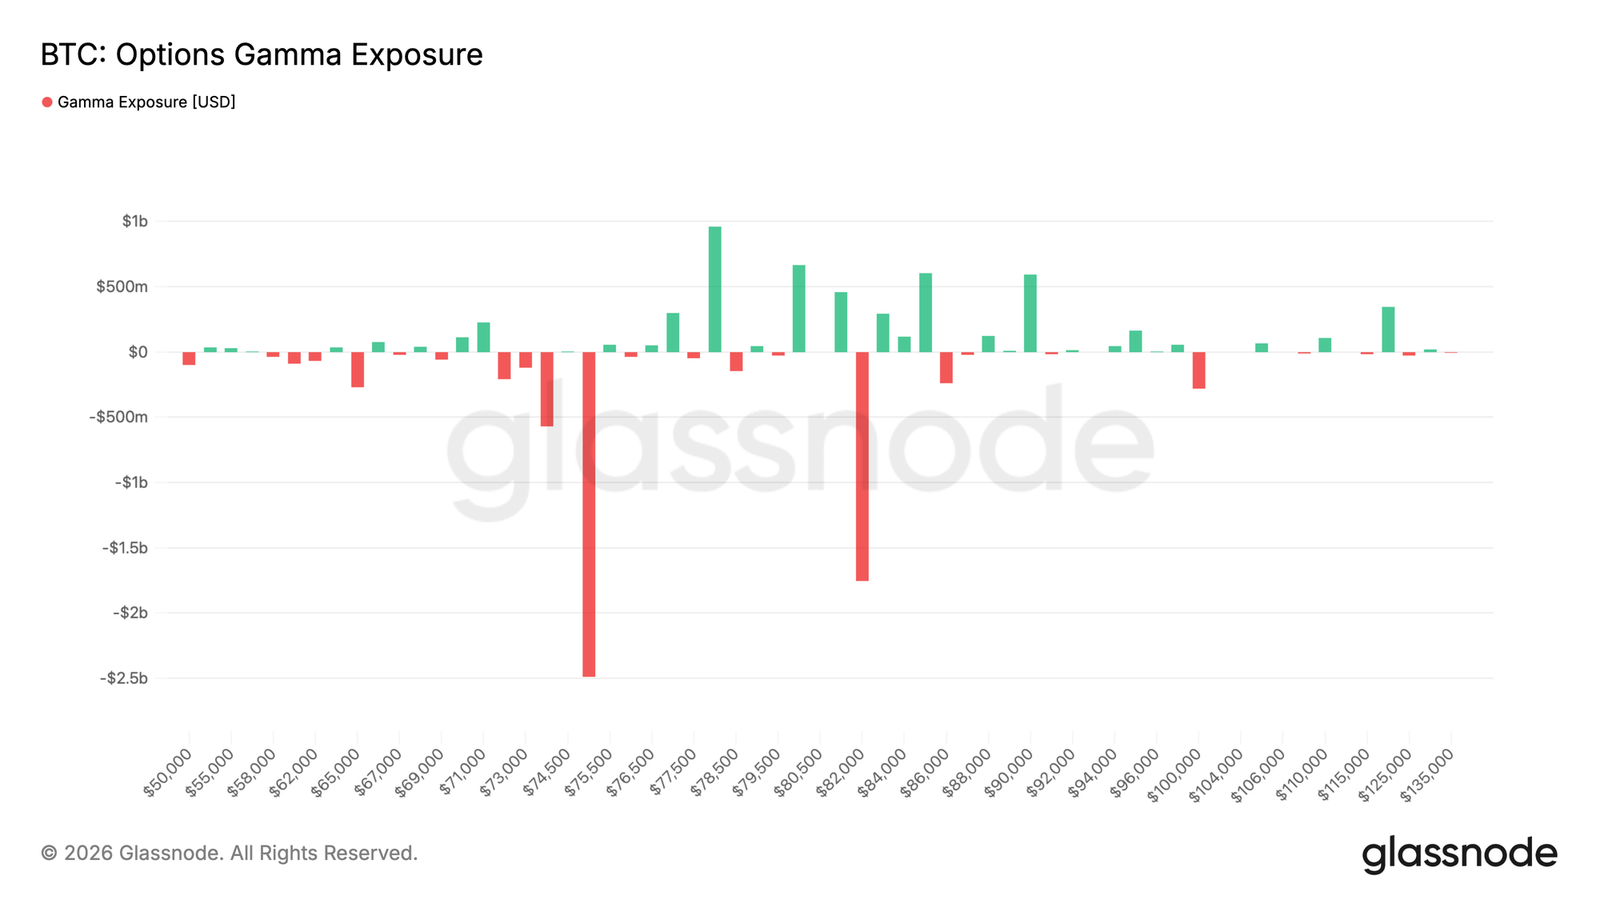
The largest short gamma cluster resides near the $75,000 strike—currently ~$2.5B in negative gamma exposure below spot ($77,500). Another large short gamma cluster remains near $82,000 (~$2B exposure), though ~$2B of positive gamma is spread across three strikes above spot—creating resistance before reaching the higher short gamma acceleration zone at $82,000.
This structure renders spot more sensitive to sharp downside moves near the key negative gamma strike ($75,000), where market-maker hedging flows could amplify weakness. This accumulation aligns with recent flow activity: put buying accounted for 55.5% of taker premium flows over the past 7 days—and over 90% over the past 24 hours—demonstrating clear downside hedging rotation.
Current gamma distribution reflects a more fragile structure: concentrated put demand creates critical zones where spot re-entry could amplify volatility.
Conclusion
Bitcoin remains in a constructive structural position, yet latest positioning and flow data suggest momentum is becoming increasingly selective beneath the surface. Institutional futures participation continues recovering, and price holds resiliently above key support—but broad-based spot demand has not yet fully re-accelerated, particularly at U.S. institutional venues.
Meanwhile, options positioning and the volatility market reveal a more cautious environment forming near current upper-range levels. Weaker aggregate spot accumulation, softer ETF momentum, and resurgent downside hedging demand collectively indicate the market still seeks a stronger catalyst to sustain expansion above the low-$80,000 level.
In summary, the broader trend remains constructive—but latest data shows the market is increasingly driven by positioning and derivatives activity—not broad-based spot conviction. Until liquidity conditions improve further and stronger spot demand re-emerges, Bitcoin may continue experiencing more volatile price action within its current range.
Join TechFlow official community to stay tuned
Telegram:https://t.me/TechFlowDaily
X (Twitter):https://x.com/TechFlowPost
X (Twitter) EN:https://x.com/BlockFlow_News
 @glassnode