
2024 Crypto Report: Full-Spectrum Data on Public Blockchains, L2s, DeFi, NFTs, and Developers
TechFlow Selected TechFlow Selected
2024 Crypto Report: Full-Spectrum Data on Public Blockchains, L2s, DeFi, NFTs, and Developers
Asia is now the continent with the highest proportion of developers, with one in every three crypto developers residing in Asia.
Author: Maria, Electric Capital
Translation: 1912212.eth, Foresight News
The sixth annual Electric Capital Developer Report was created with the participation of 829 individuals. We analyzed a record 902 million code commits across 1.7 million repositories.
How did crypto industry data perform in 2024?
Key Takeaways:
-
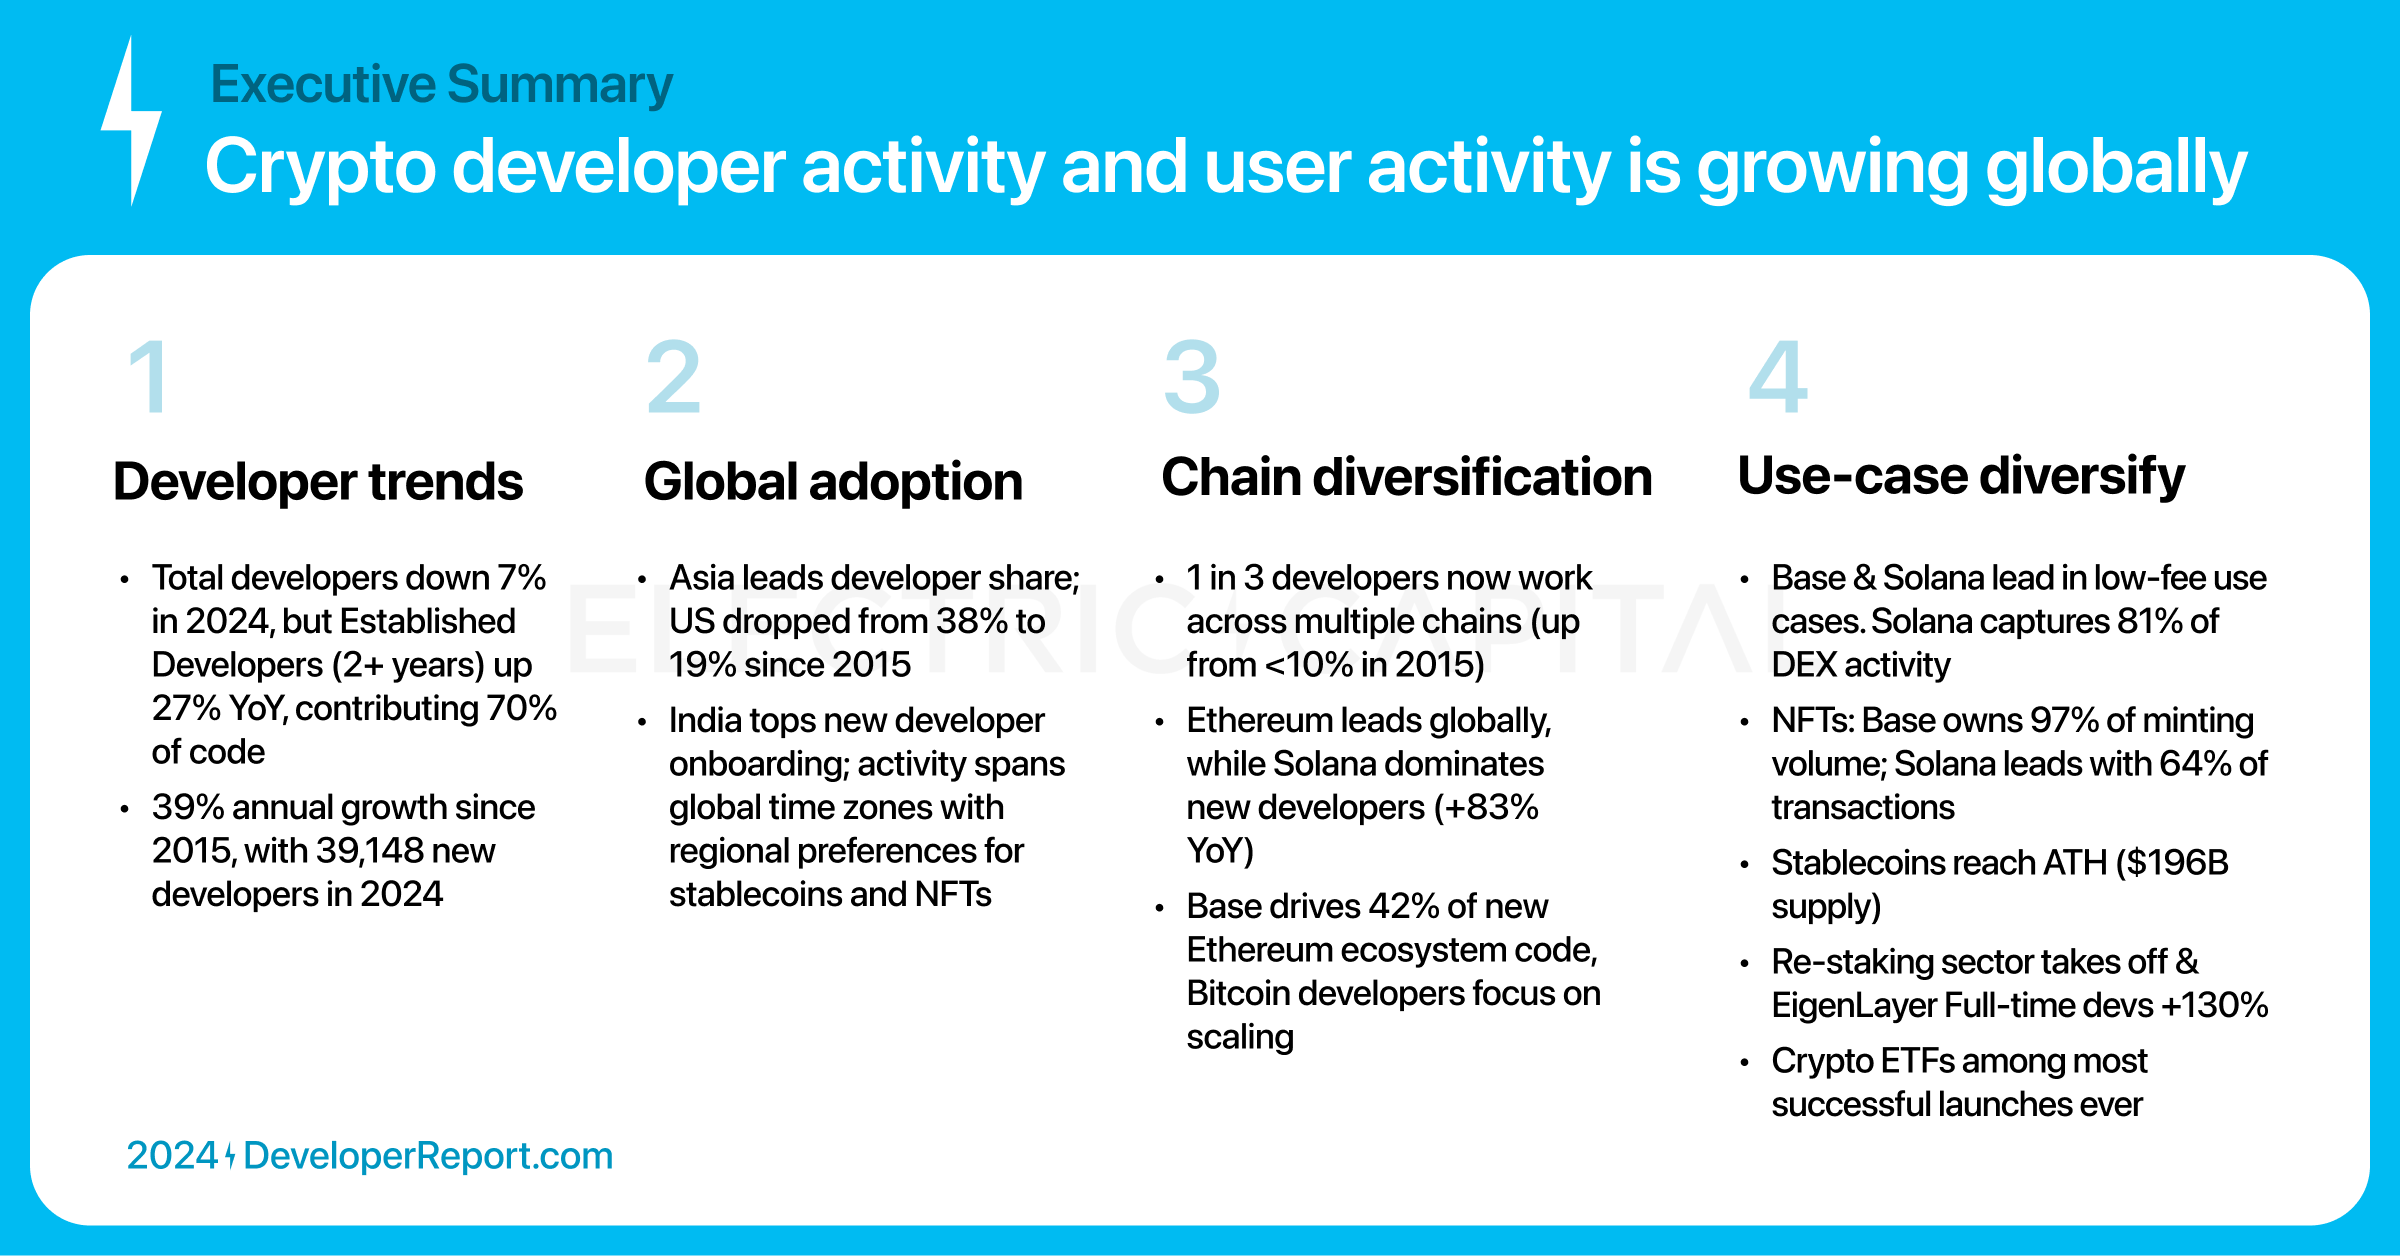
The crypto industry is global, with developer momentum shifting from North America to other regions.
-
Developers and use cases are diversifying across different ecosystems.
-
Applications span all time zones, indicating widespread global adoption.
We underestimated the number of developers in crypto because our analysis only tracks open-source development activity.
Our methodology includes:
-
Merging developer profiles into single canonical identities.
-
Identifying and excluding bot accounts.
-
Removing repositories that don’t reflect actual development (e.g., data listing repos).
Since Ethereum’s launch in 2015, the crypto industry has grown at an average rate of 39% per year. In 2015, there were approximately 1,000 monthly active developers. Today: monthly active developers have grown to 23,613.
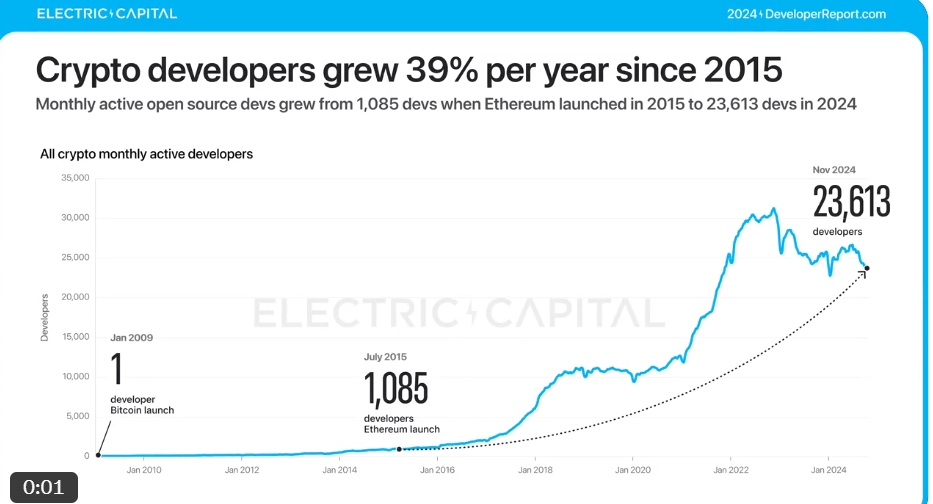
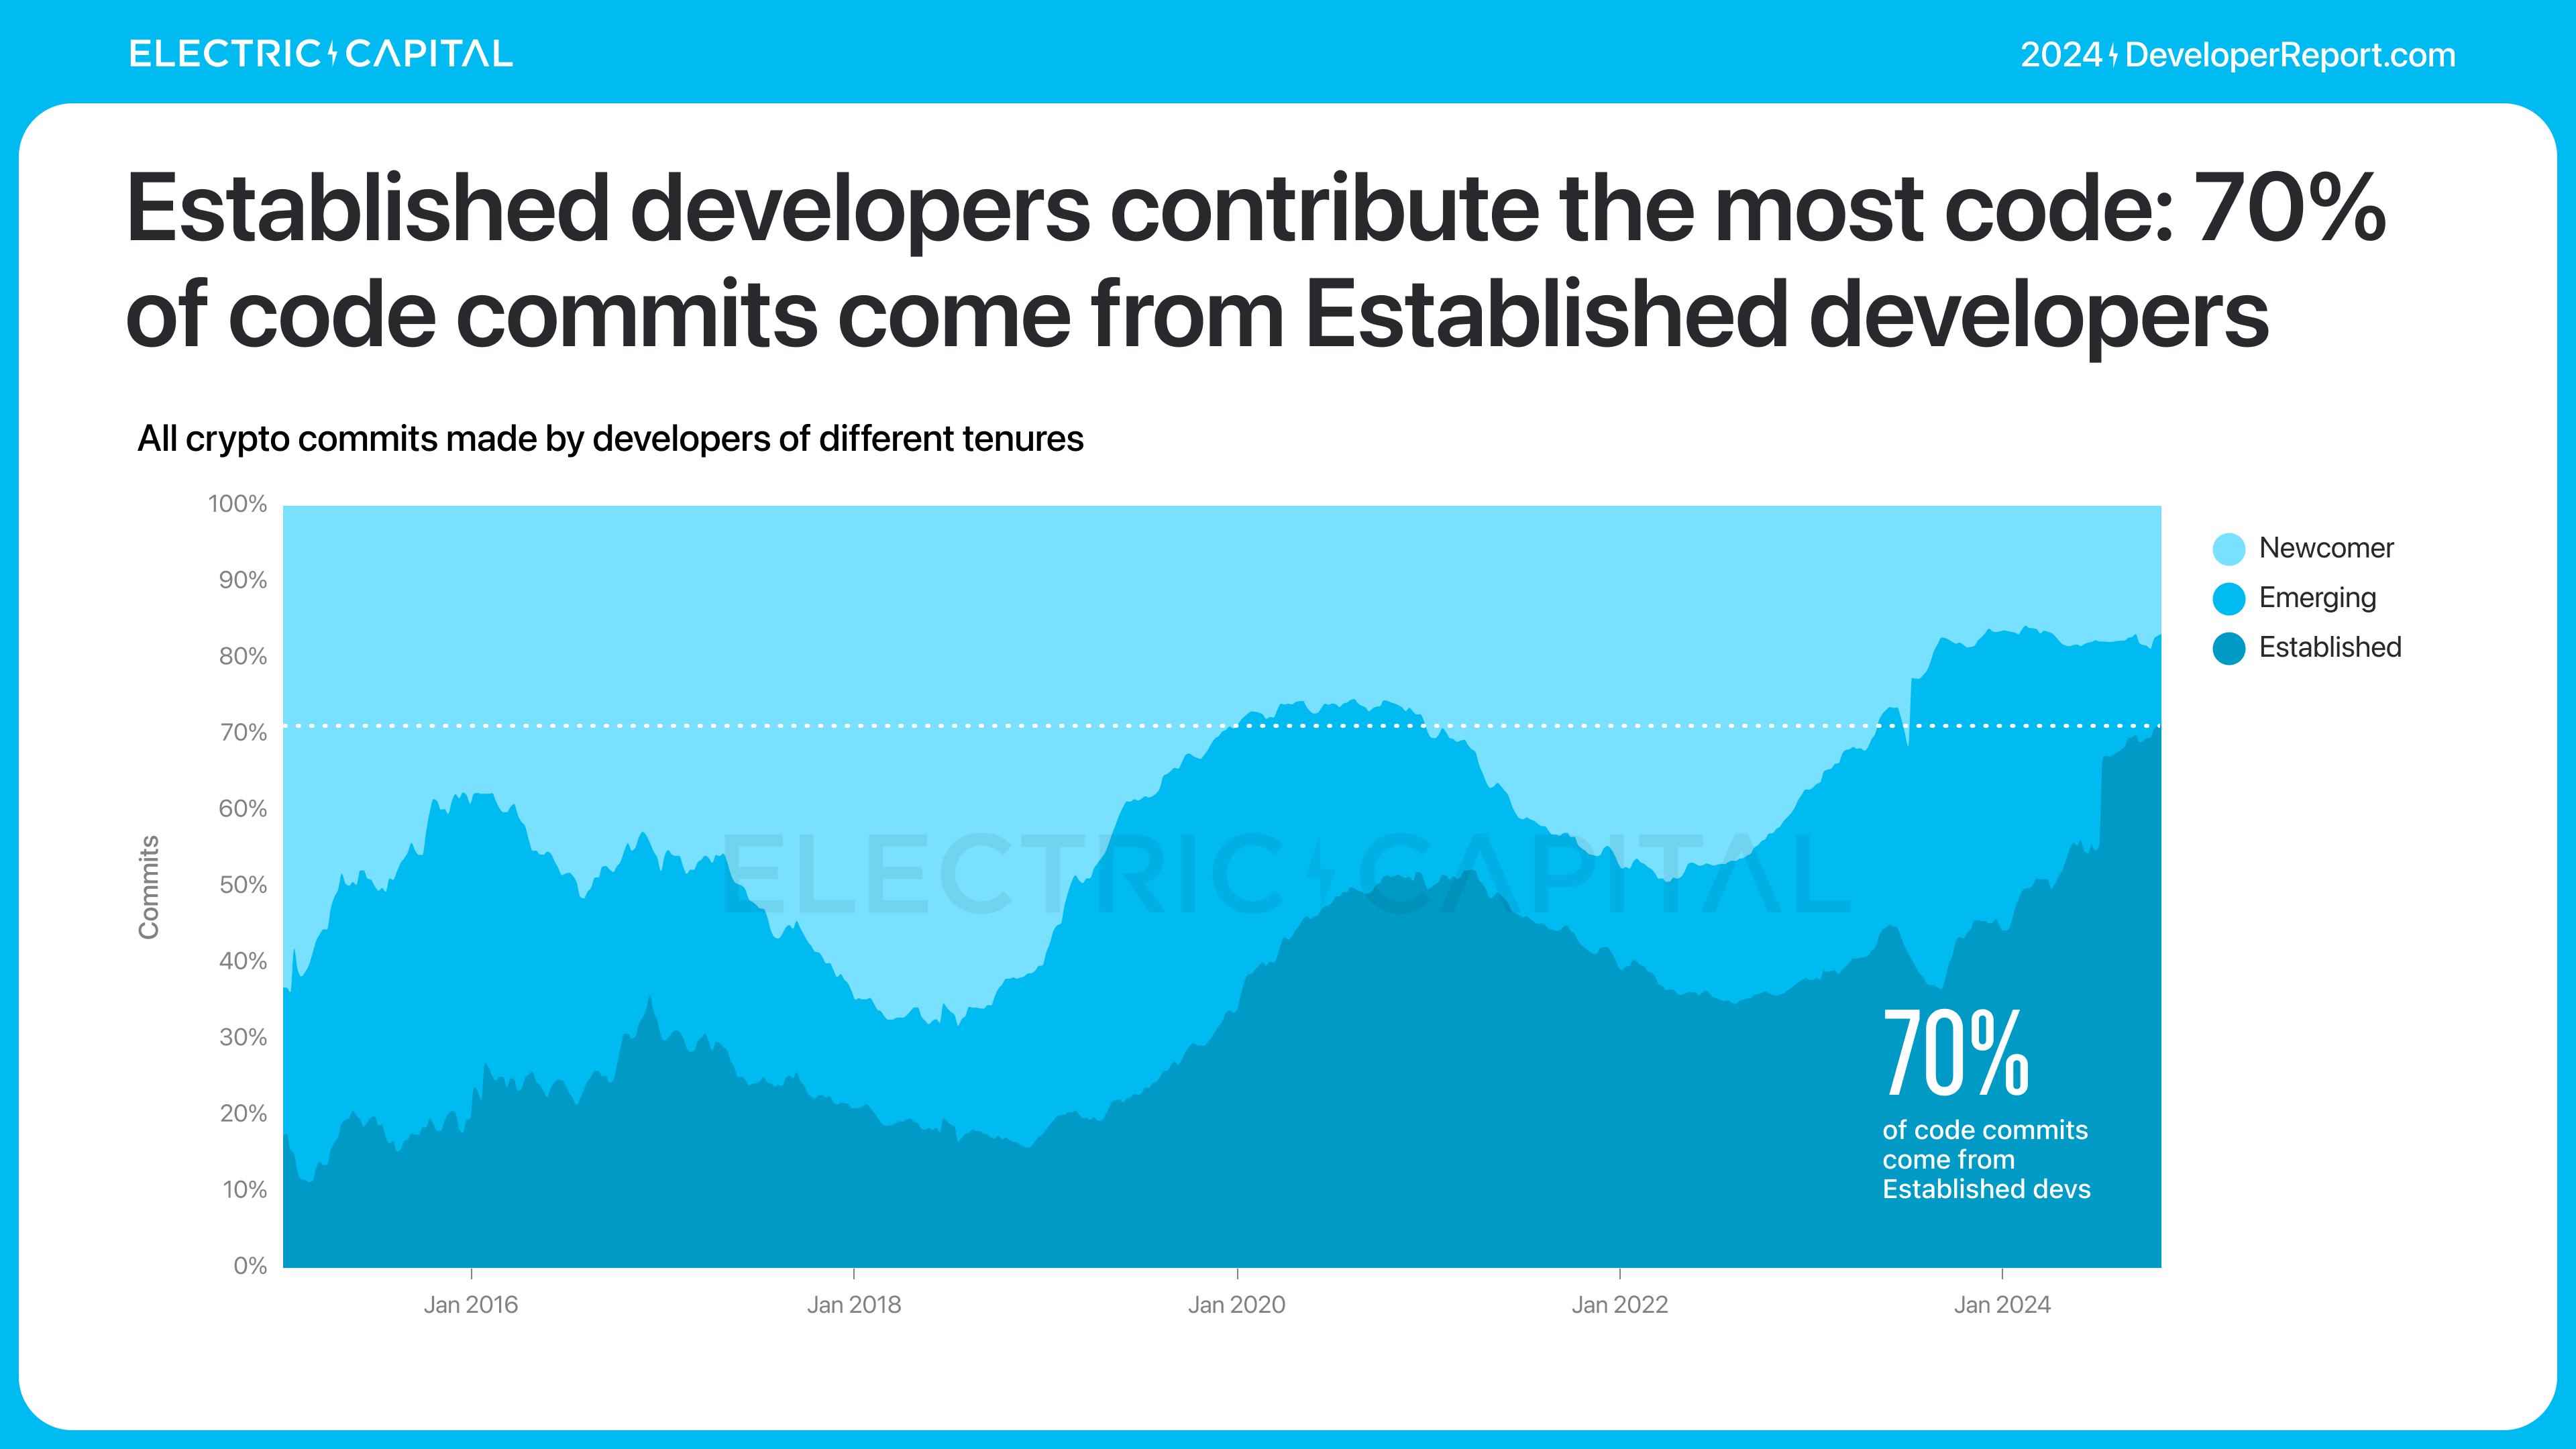
Over the past year, the number of monthly active developers declined slightly by 7%.

However, the number of developers who have been working in crypto for over two years grew by 27%.
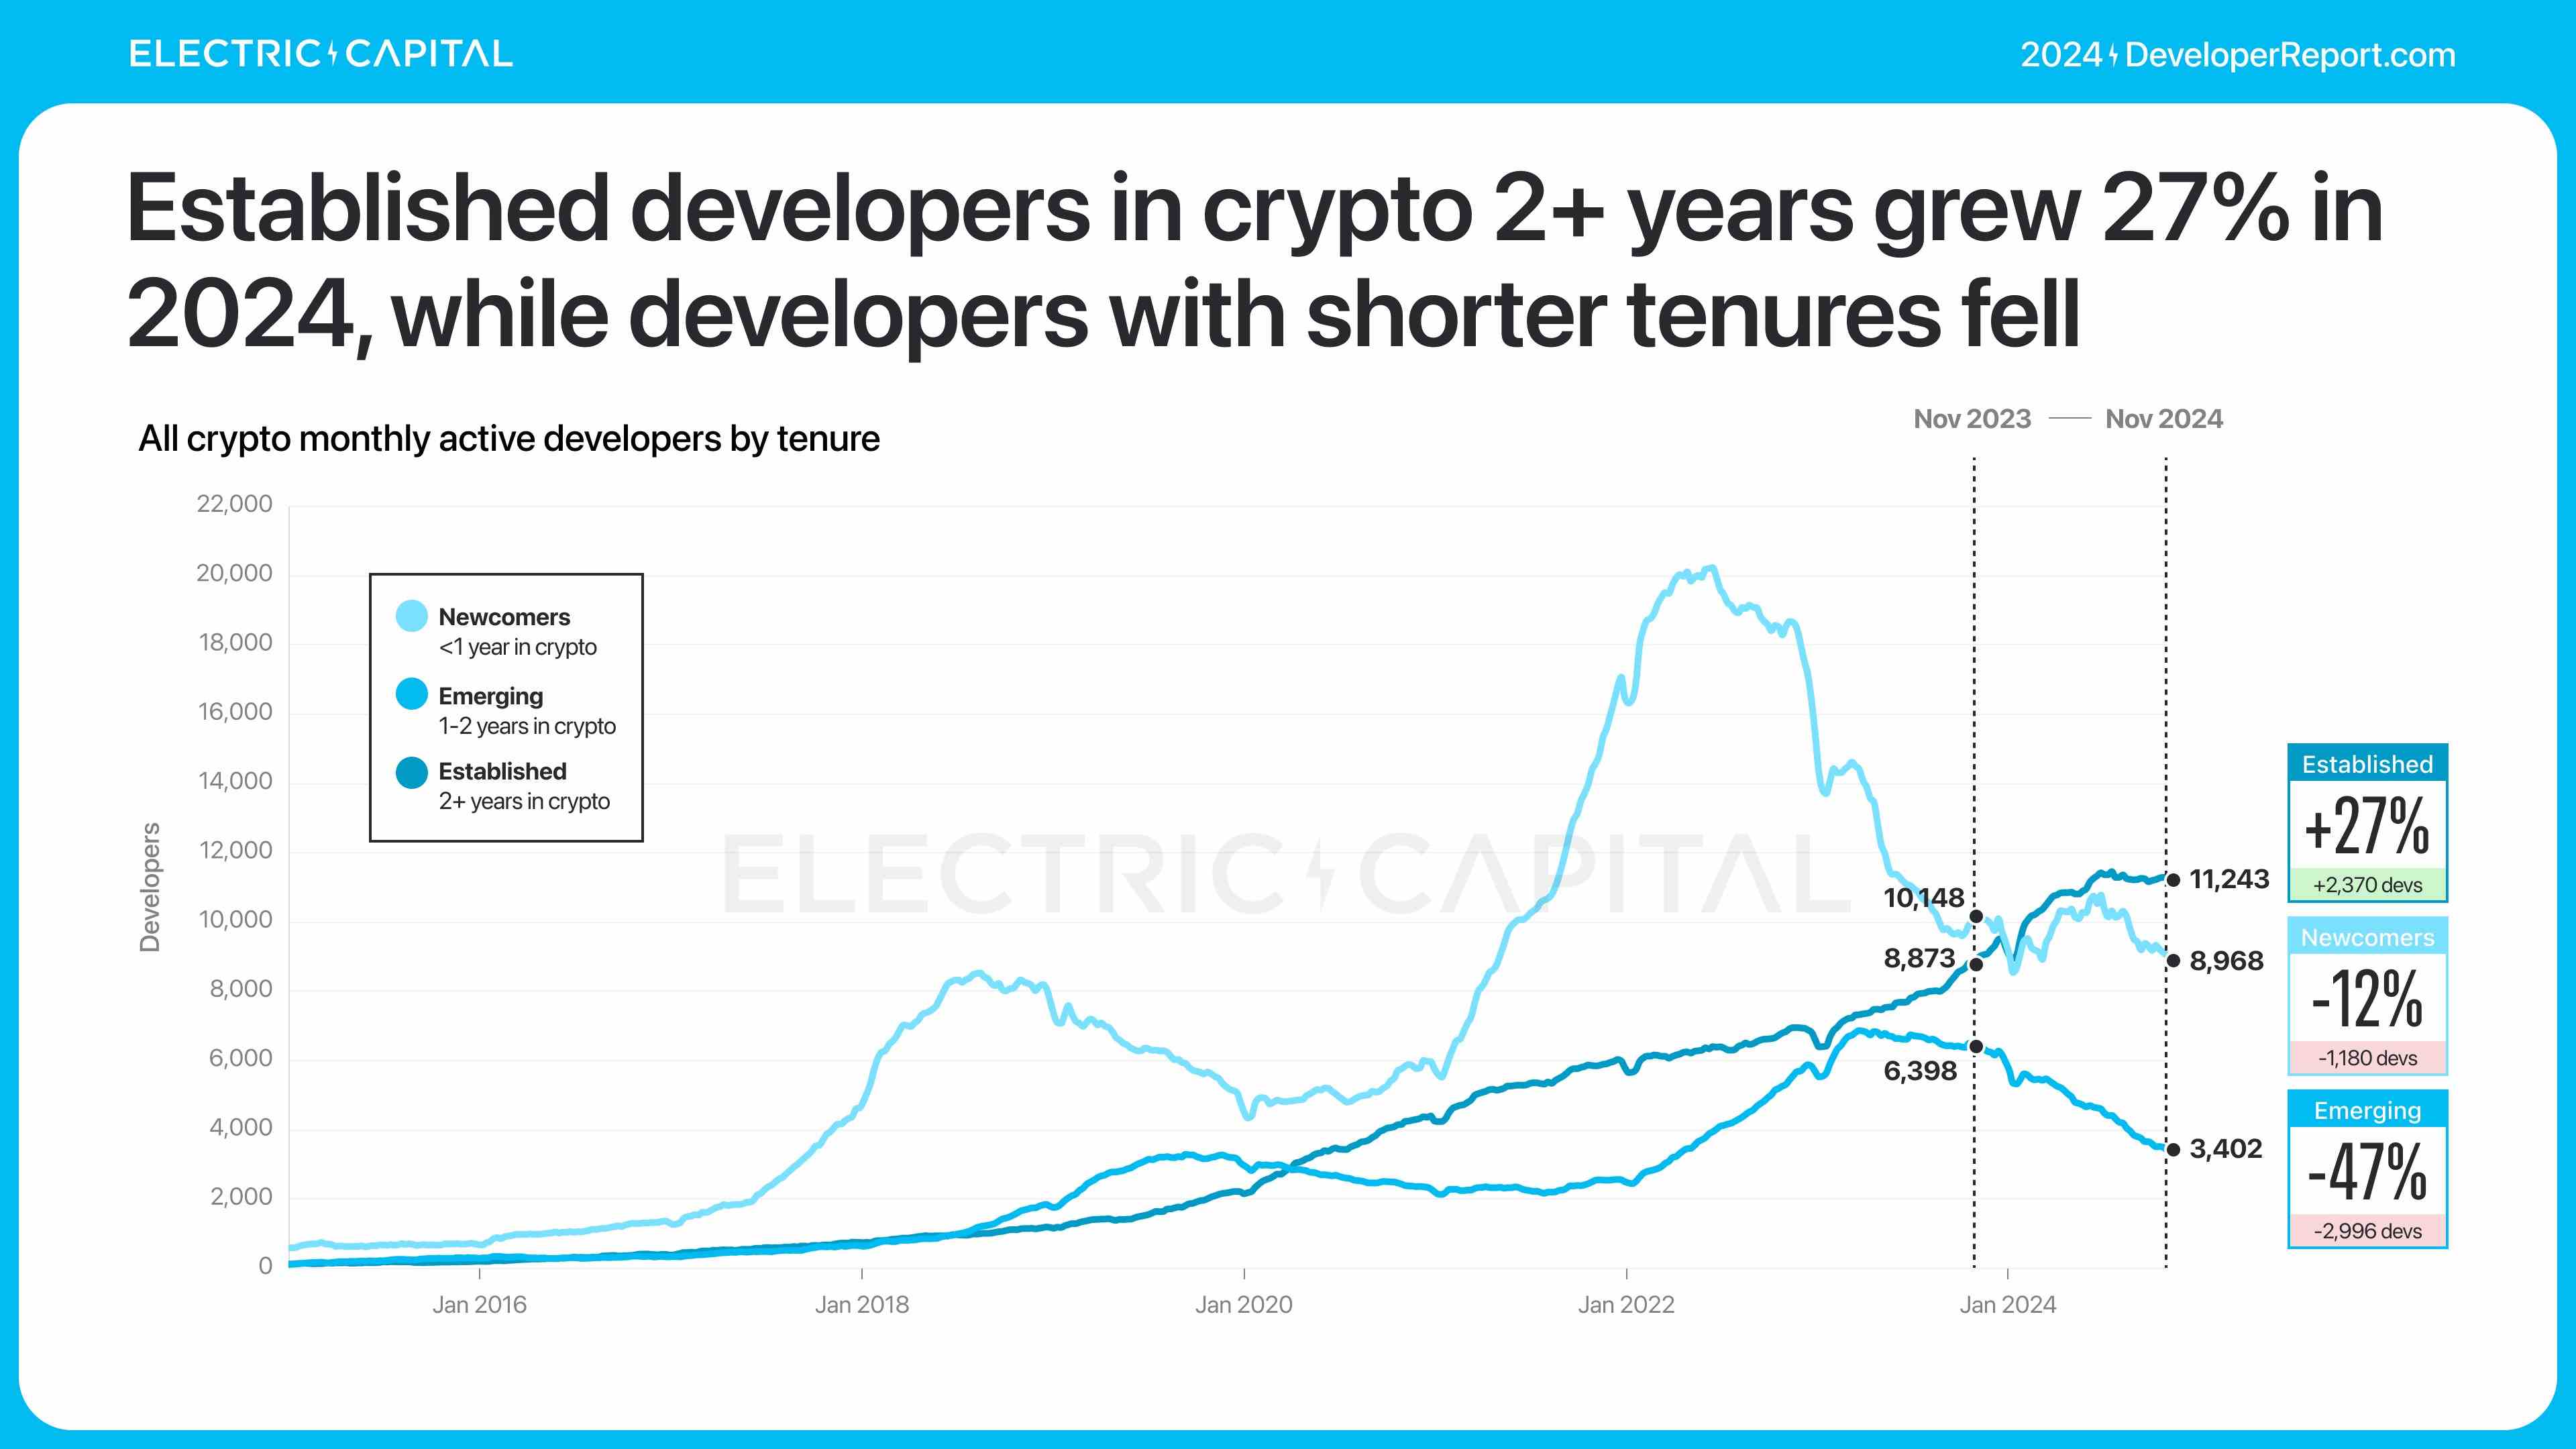
These experienced developers are driving progress, contributing 70% of all code submissions.
How has the crypto industry changed since 2015? Let's examine the global diversity of crypto developers.
The center of gravity for developer distribution has shifted from the U.S. and Europe accounting for 82% to now being dominated by the rest of the world.
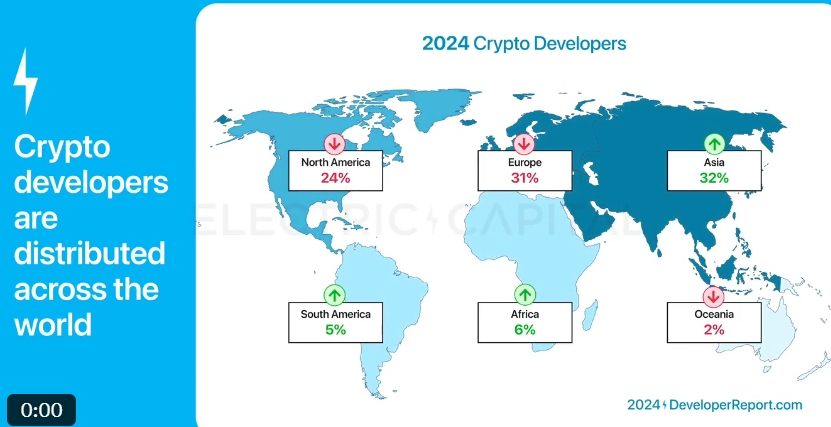
Asia now has the highest share of developers among continents— one in every three crypto developers resides in Asia. Europe ranks second. Since 2015, North America has dropped from first to third place.
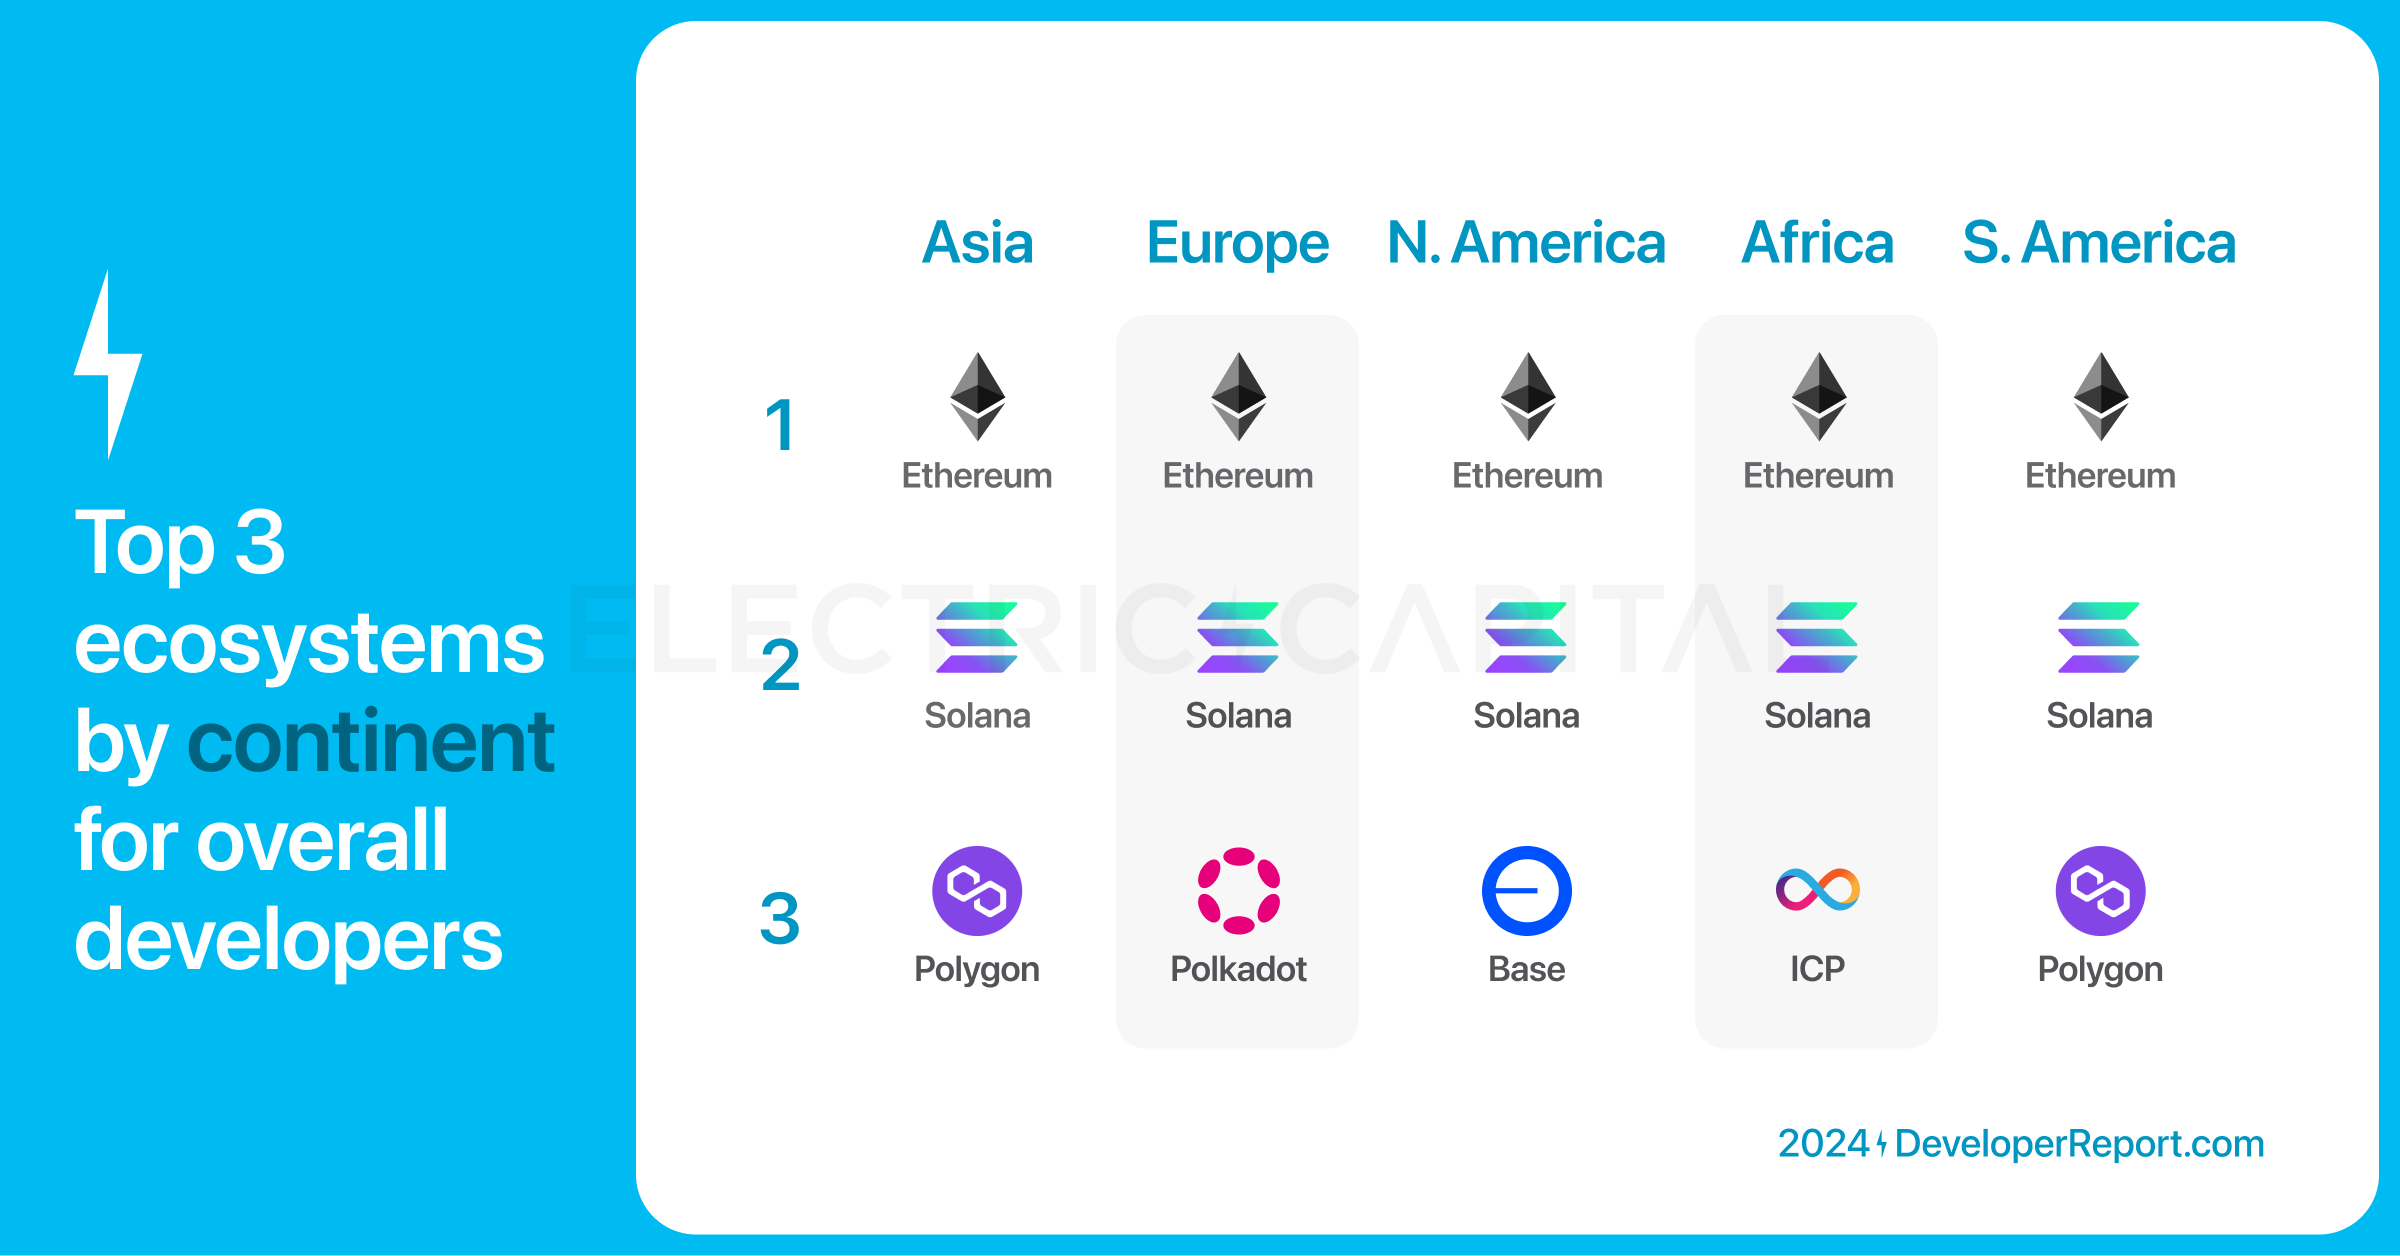
We can identify top ecosystems within these continents based on developer share.
Ethereum leads as the #1 ecosystem by developer share on every major continent.
-
Solana ranks second overall.
-
Polygon ranks third in Asia and South America.
-
Polkadot ranks third in Europe.
-
Base ranks third in North America.
-
Dfinity ranks third in Africa.
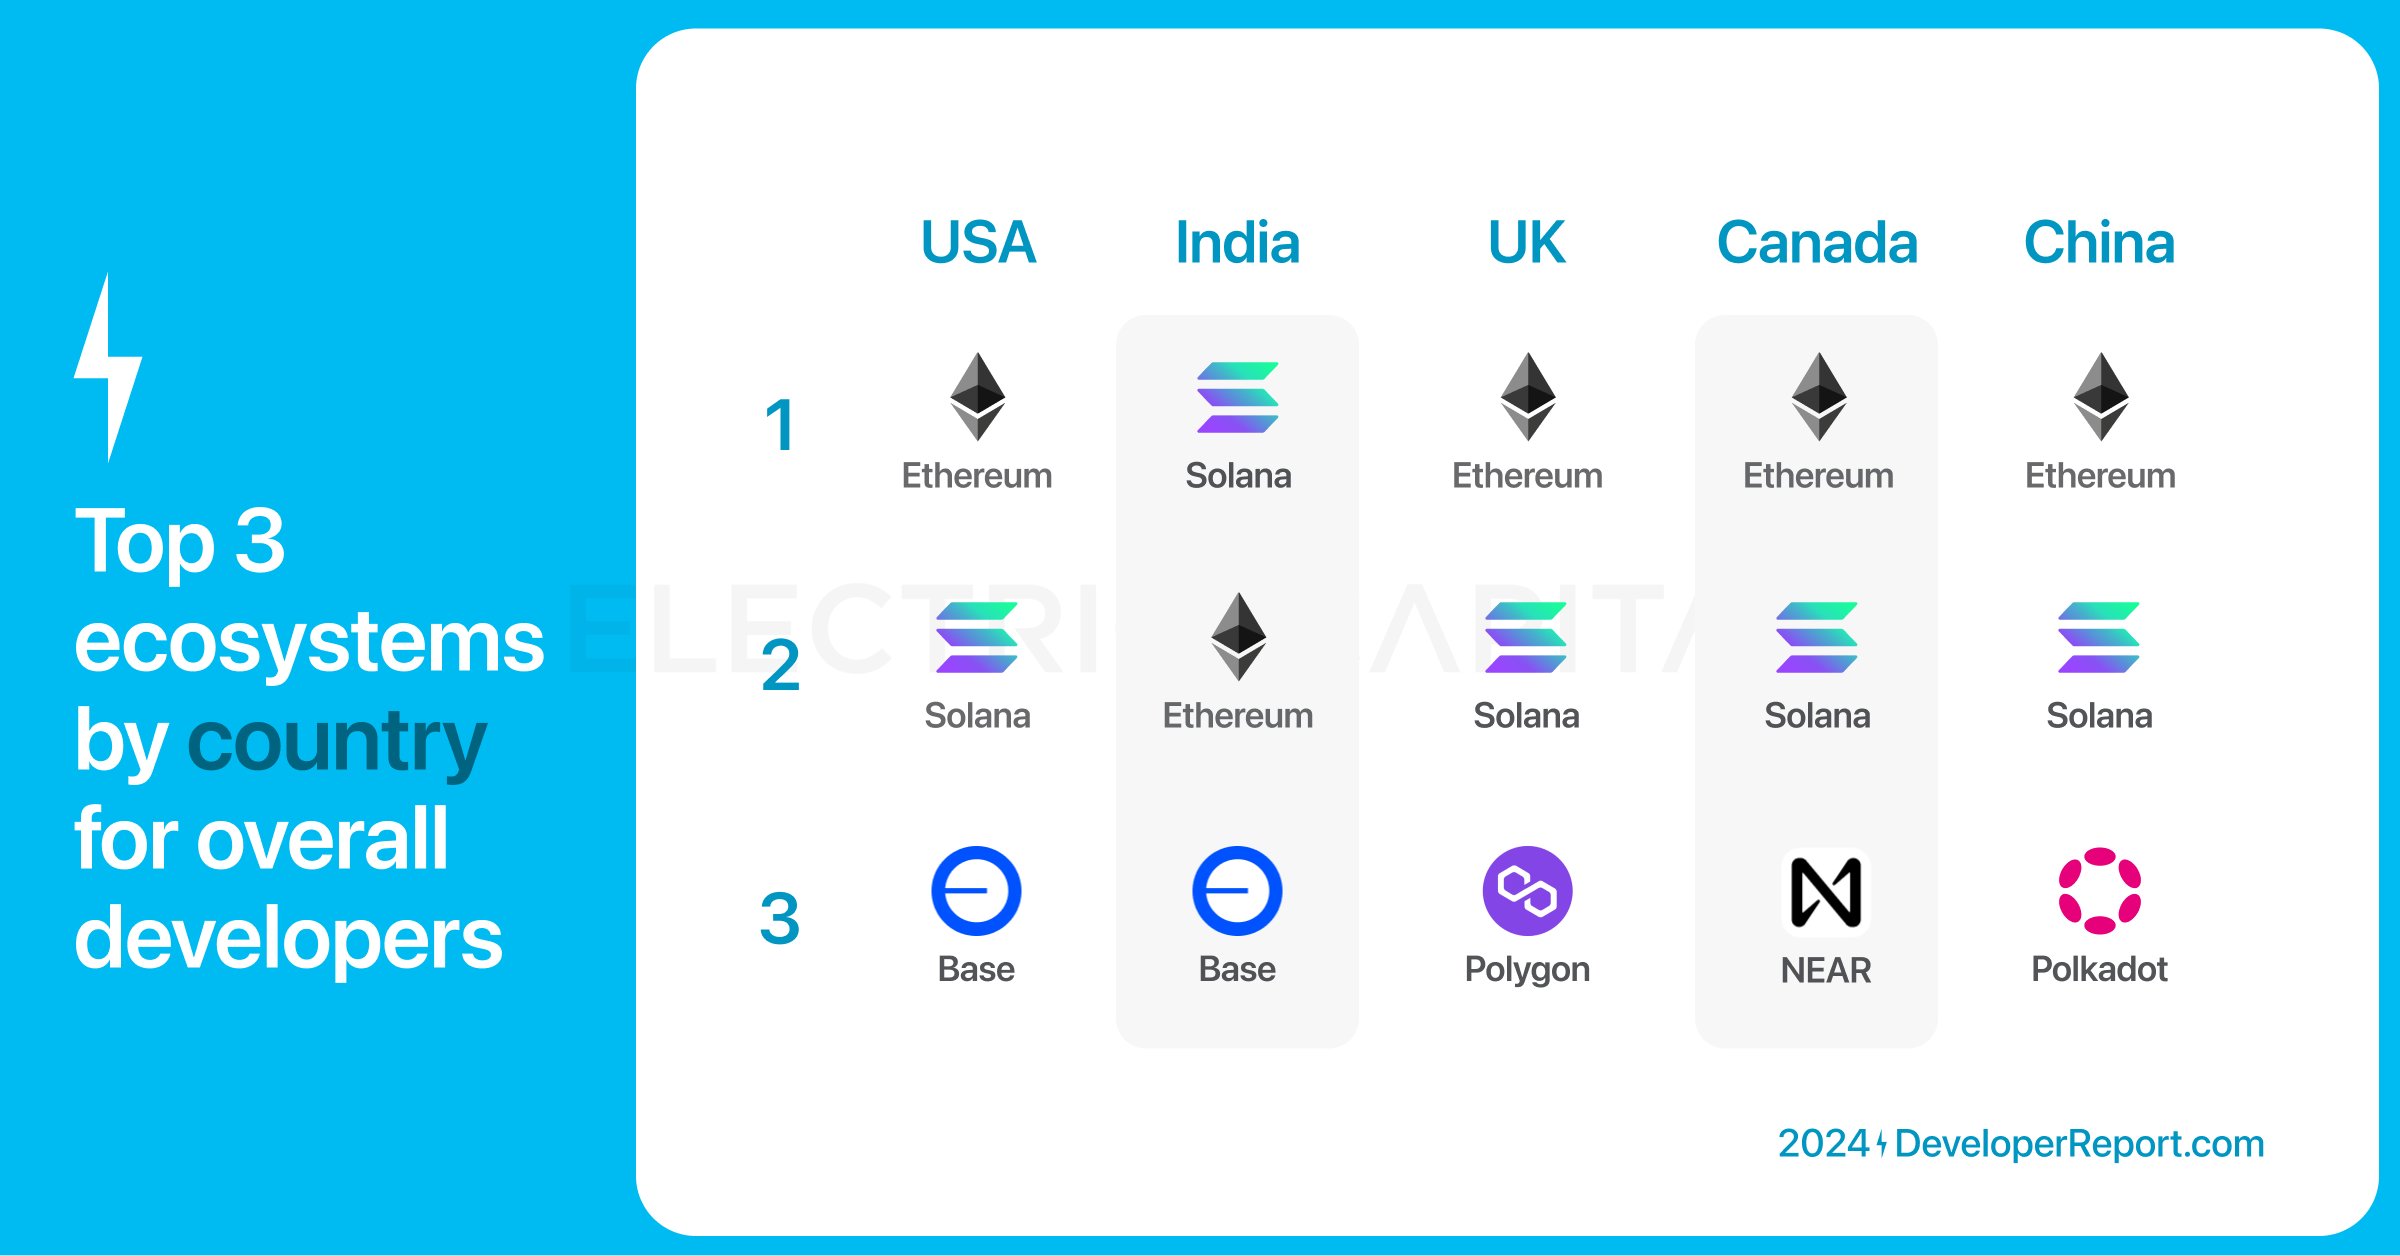
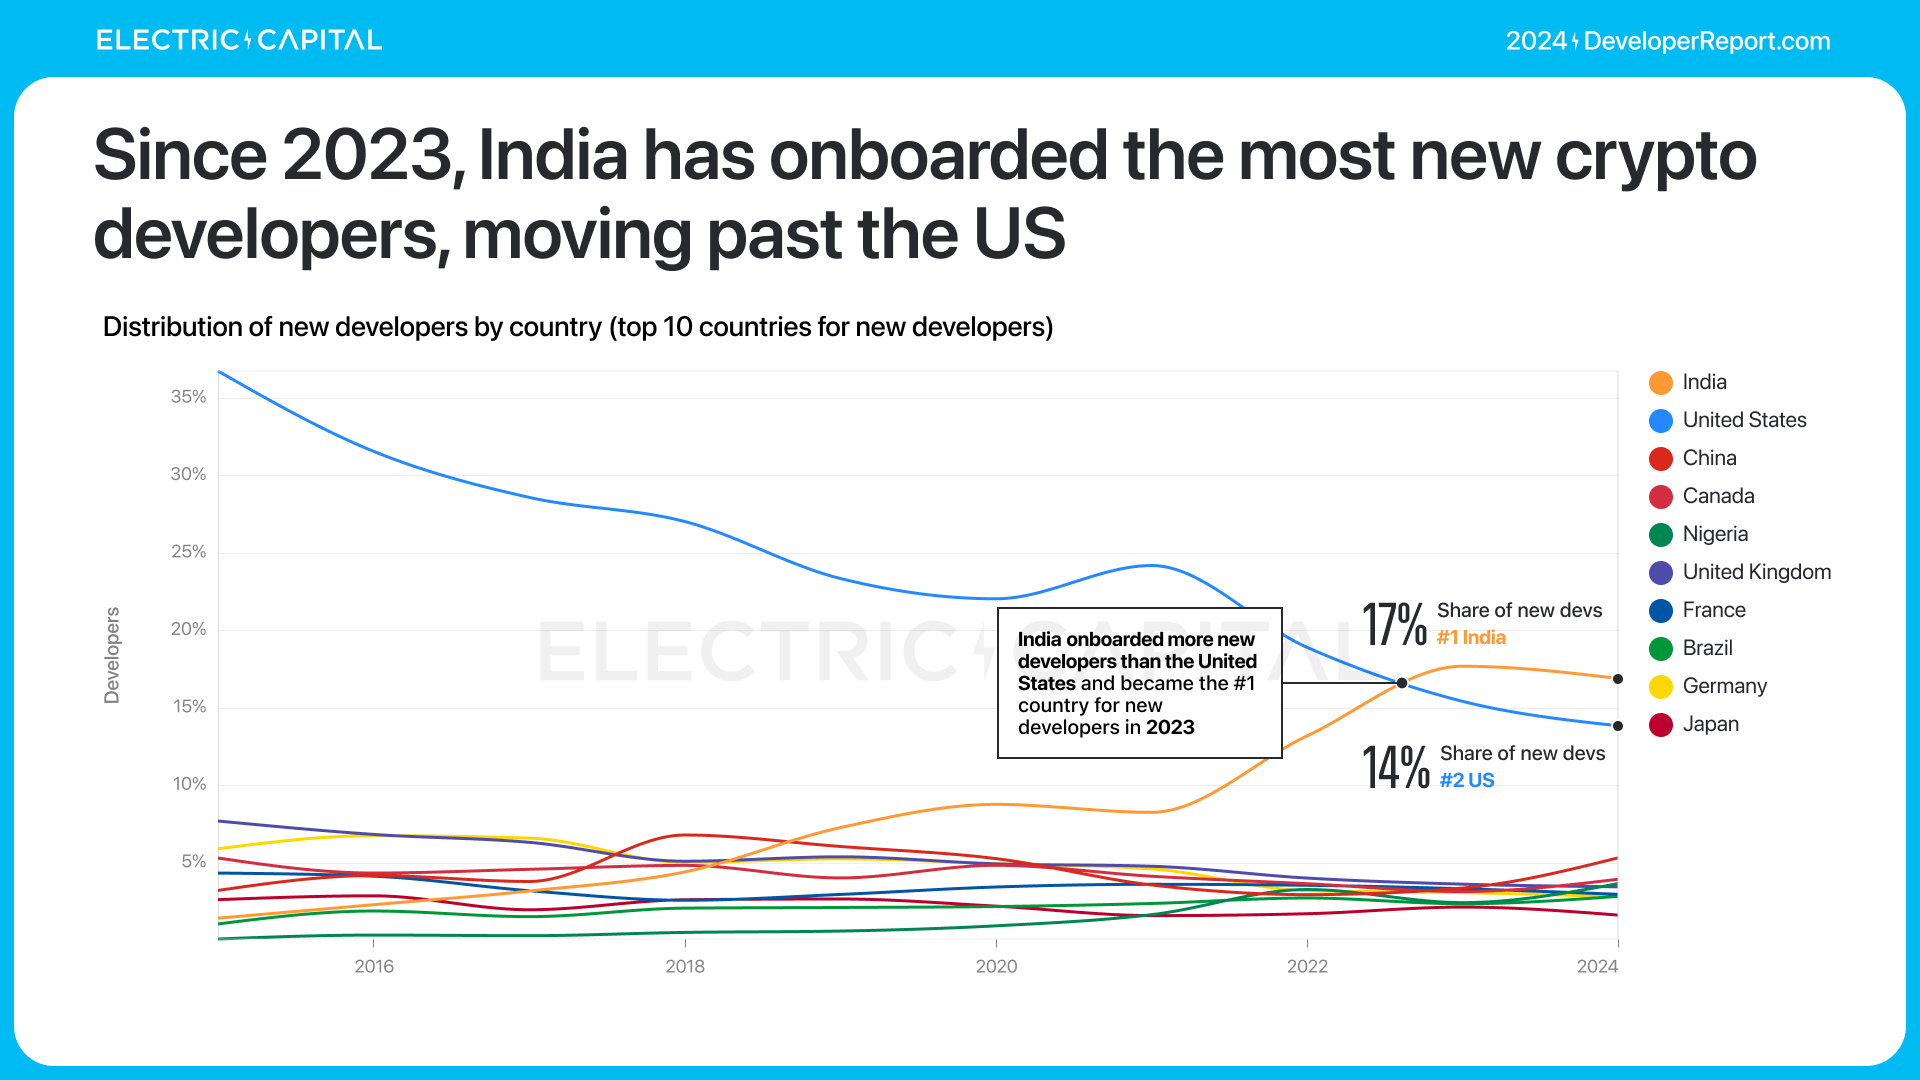
The United States, India, the UK, China, and Canada hold the largest shares of global crypto developers.

The U.S. remains the country with the highest share of crypto developers but has been steadily declining since 2015. India rose from 10th to 2nd place.
Top three ecosystems by developer share per country:
-
Ethereum ranks #1 in the U.S., UK, China, and Canada, and #2 in India.
-
Solana ranks #1 in India and #2 elsewhere.
-
Base ranks #3 in the U.S. and India.
-
Polygon ranks #3 in the UK.
-
NEAR Protocol ranks #3 in Canada.
-
Polkadot ranks #3 in China.
India welcomed the most new crypto developers in 2024. 17% of new crypto developers came from India.
Let’s focus on new developers—the 39,148 new developers who explored crypto in 2024. We can break them down by ecosystem.
Solana became the ecosystem with the most new monthly developers joining in July 2024.
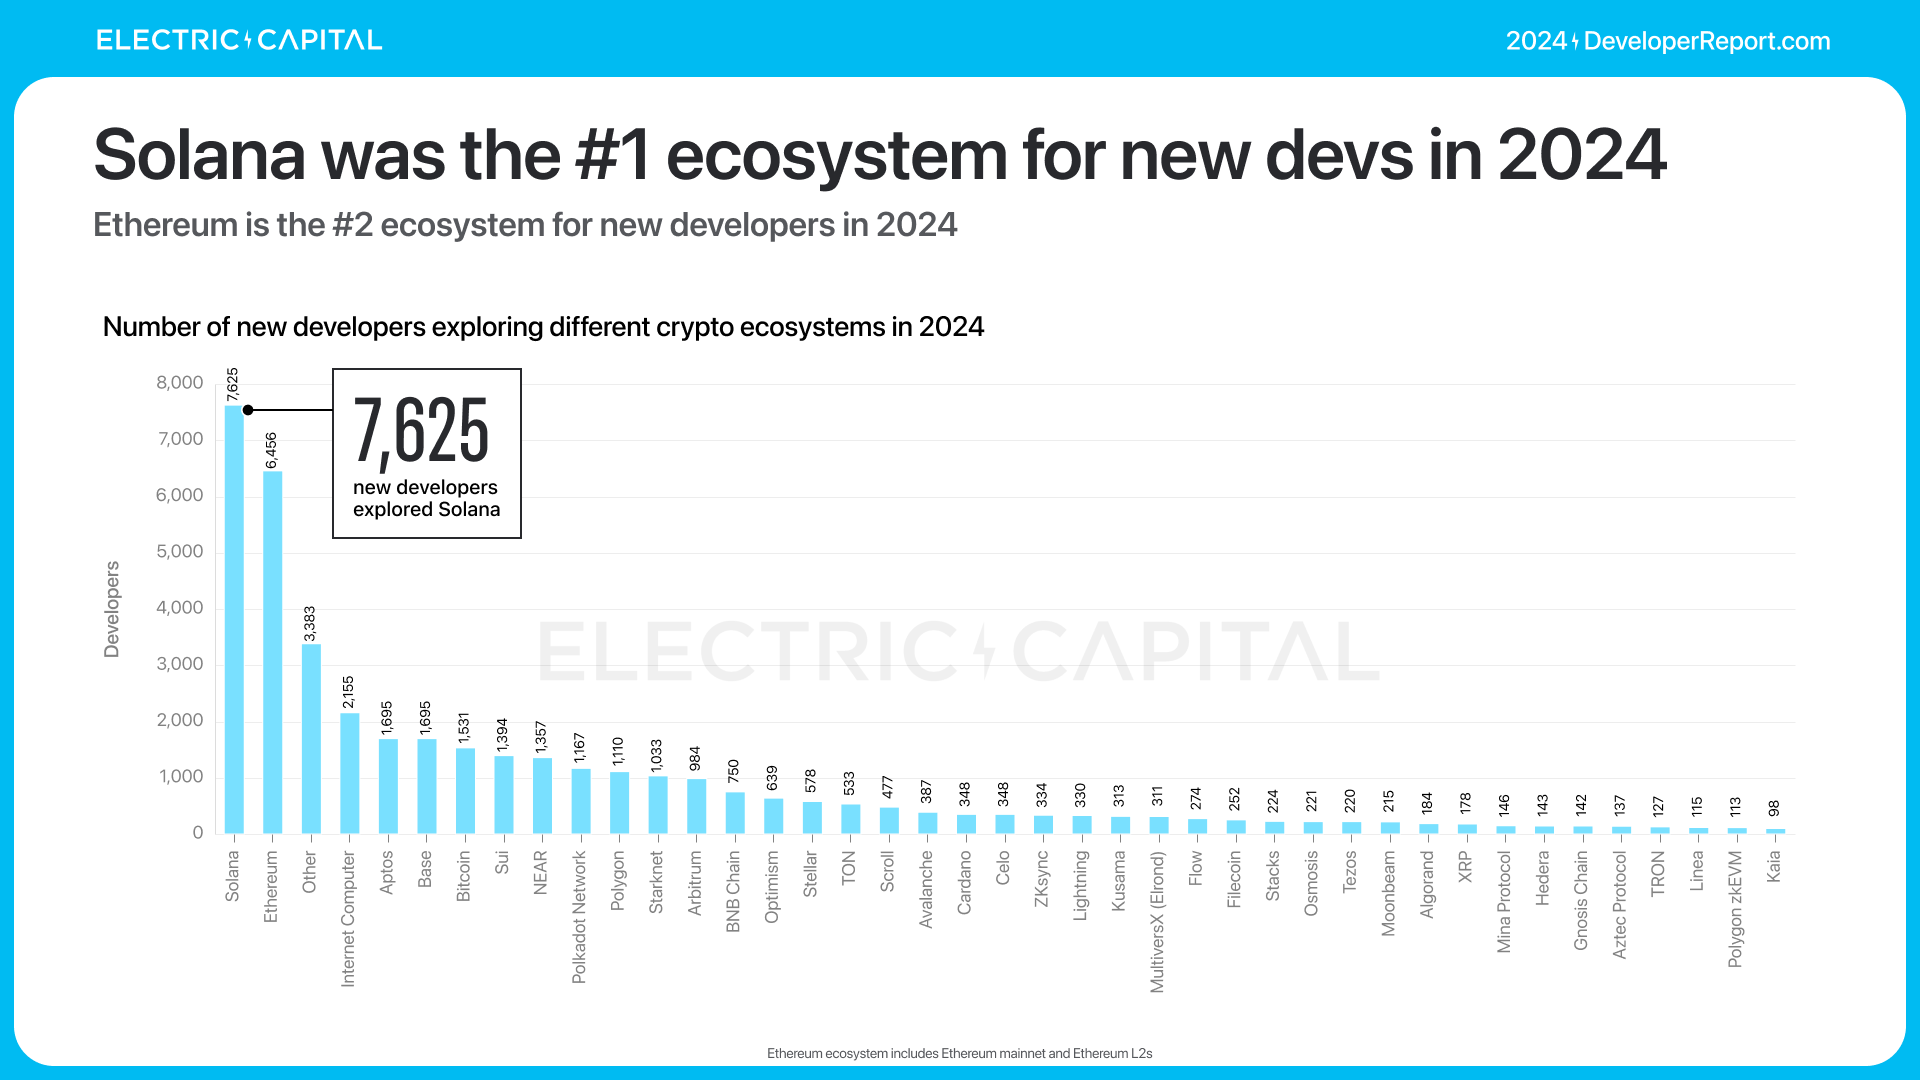
Overall picture for new developers in 2024: Solana leads as the top ecosystem for new developers.
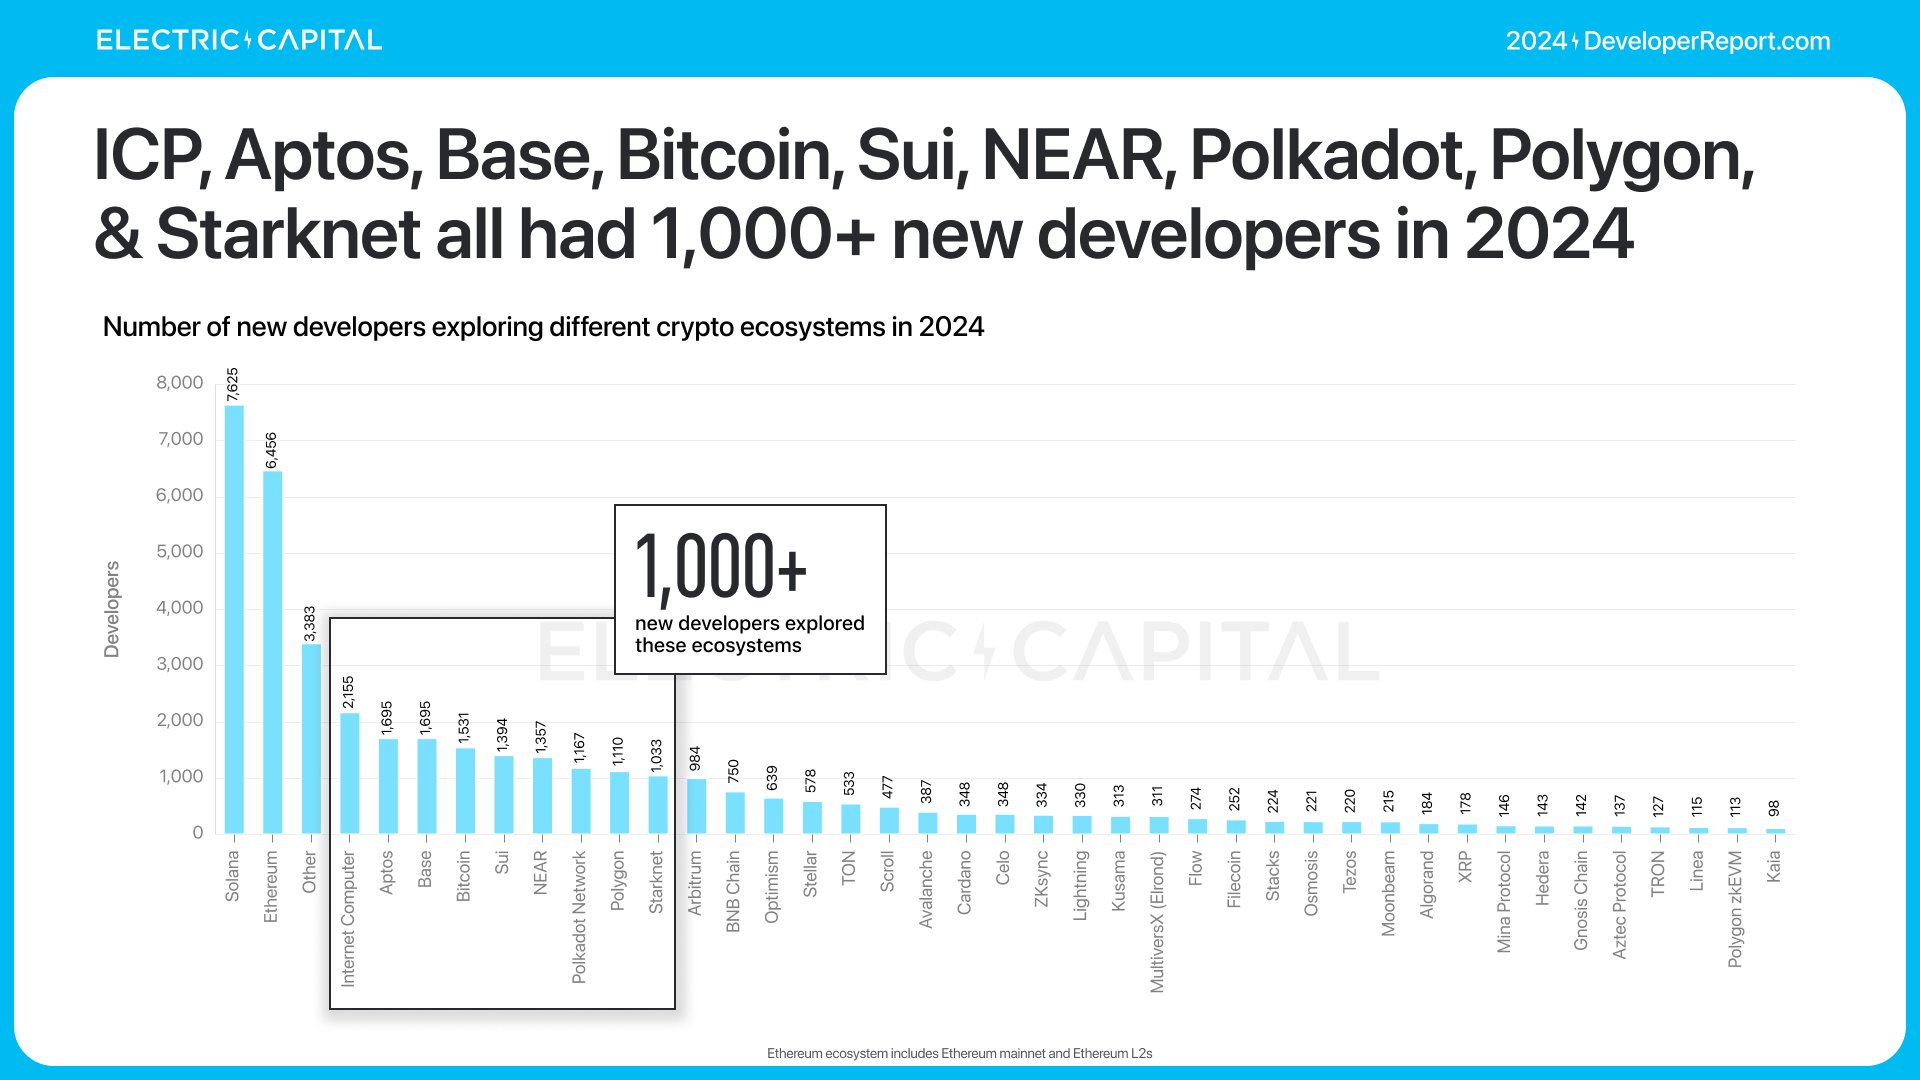
Ethereum ranks second. Dfinity, Aptos, Base, Bitcoin, SuiNetwork, NEAR Protocol, Polkadot, Polygon, and Starknet each attracted over 1,000 new developers.
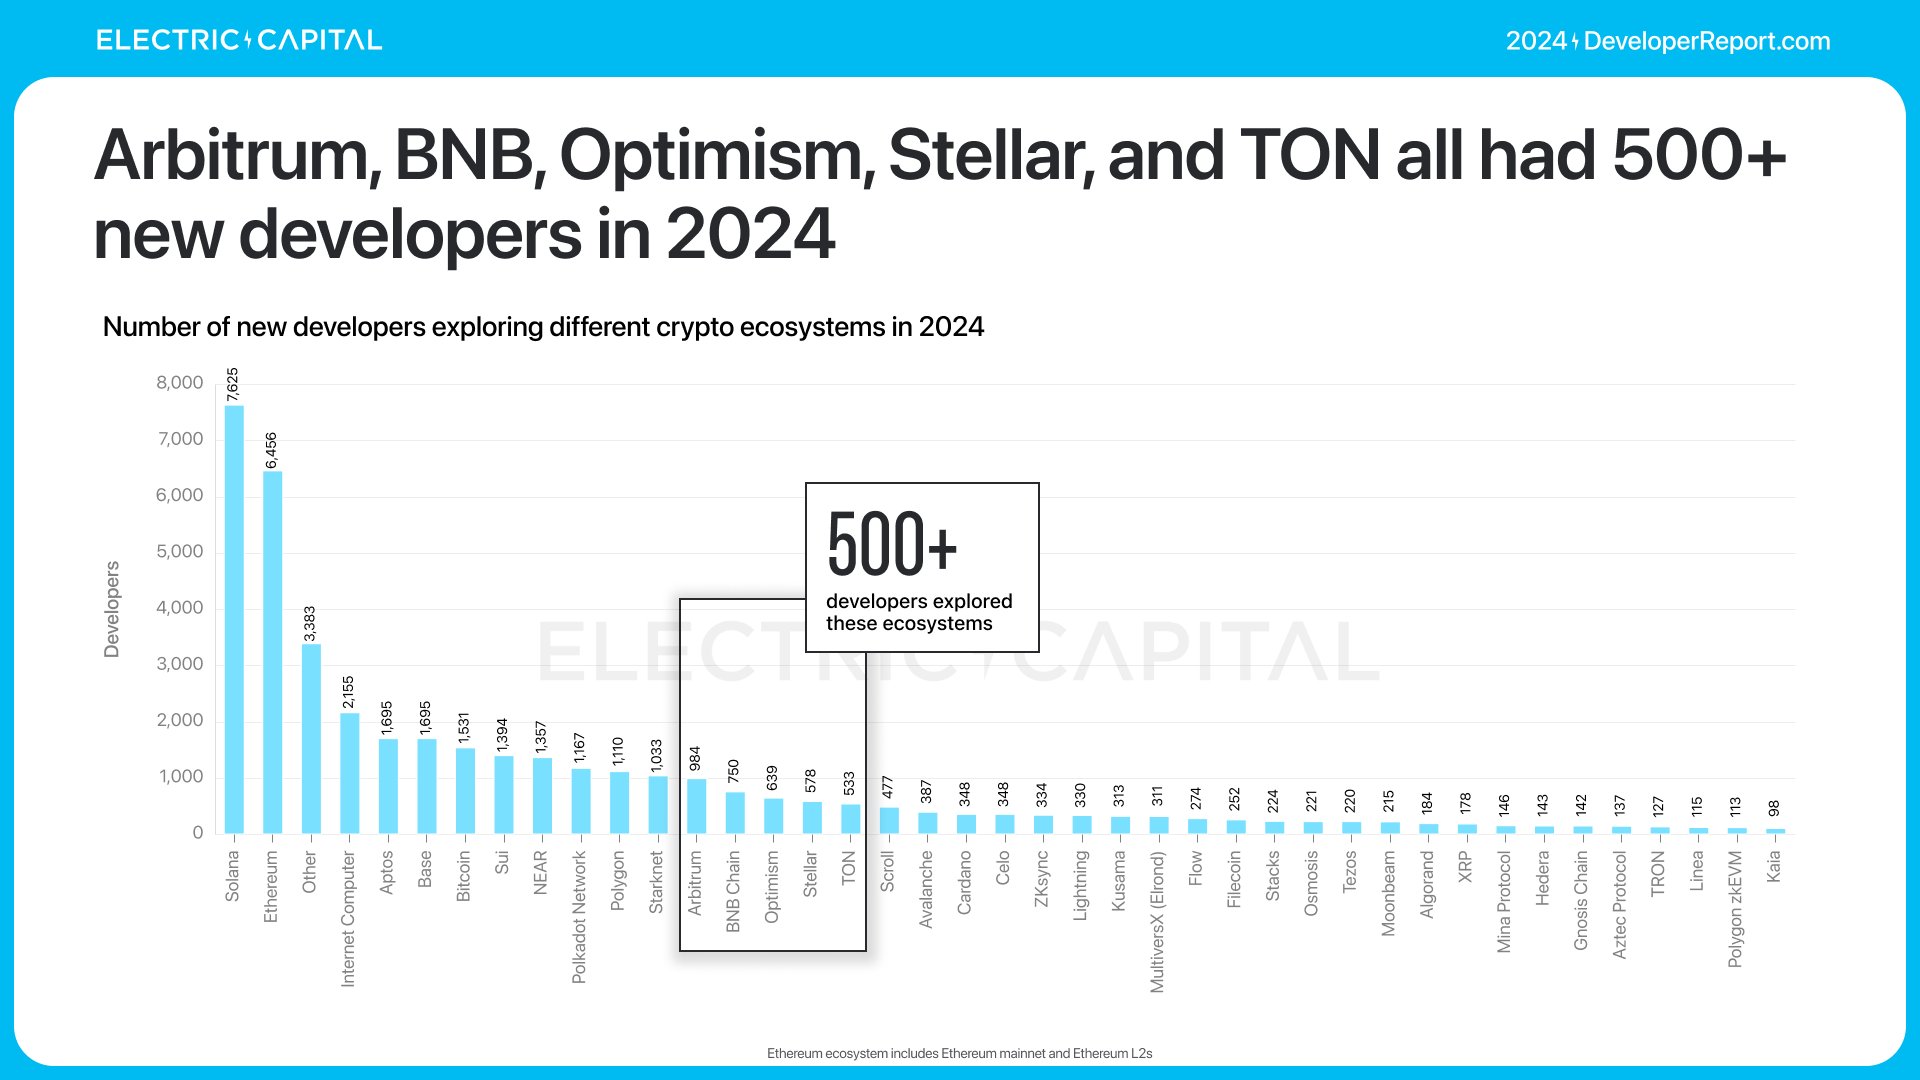
Arbitrum, BNBCHAIN, Optimism, StellarOrg, and ton_blockchain each saw more than 500 new developers join.
Which ecosystems are growing fastest in total developer count? Total developer count reflects interest from both new developers and hackathon participants.
Based on data from Q3 2023 to Q4 2024, the top ten ecosystems with the fastest growth in total developers are:

Which ecosystems are growing fastest in full-time developers? Full-time developers contribute code for more than 10 days per month, providing consistent work to their ecosystems.
Based on data from Q3 2023 to Q4 2024, the top ten ecosystems with the fastest growth in full-time developers are:

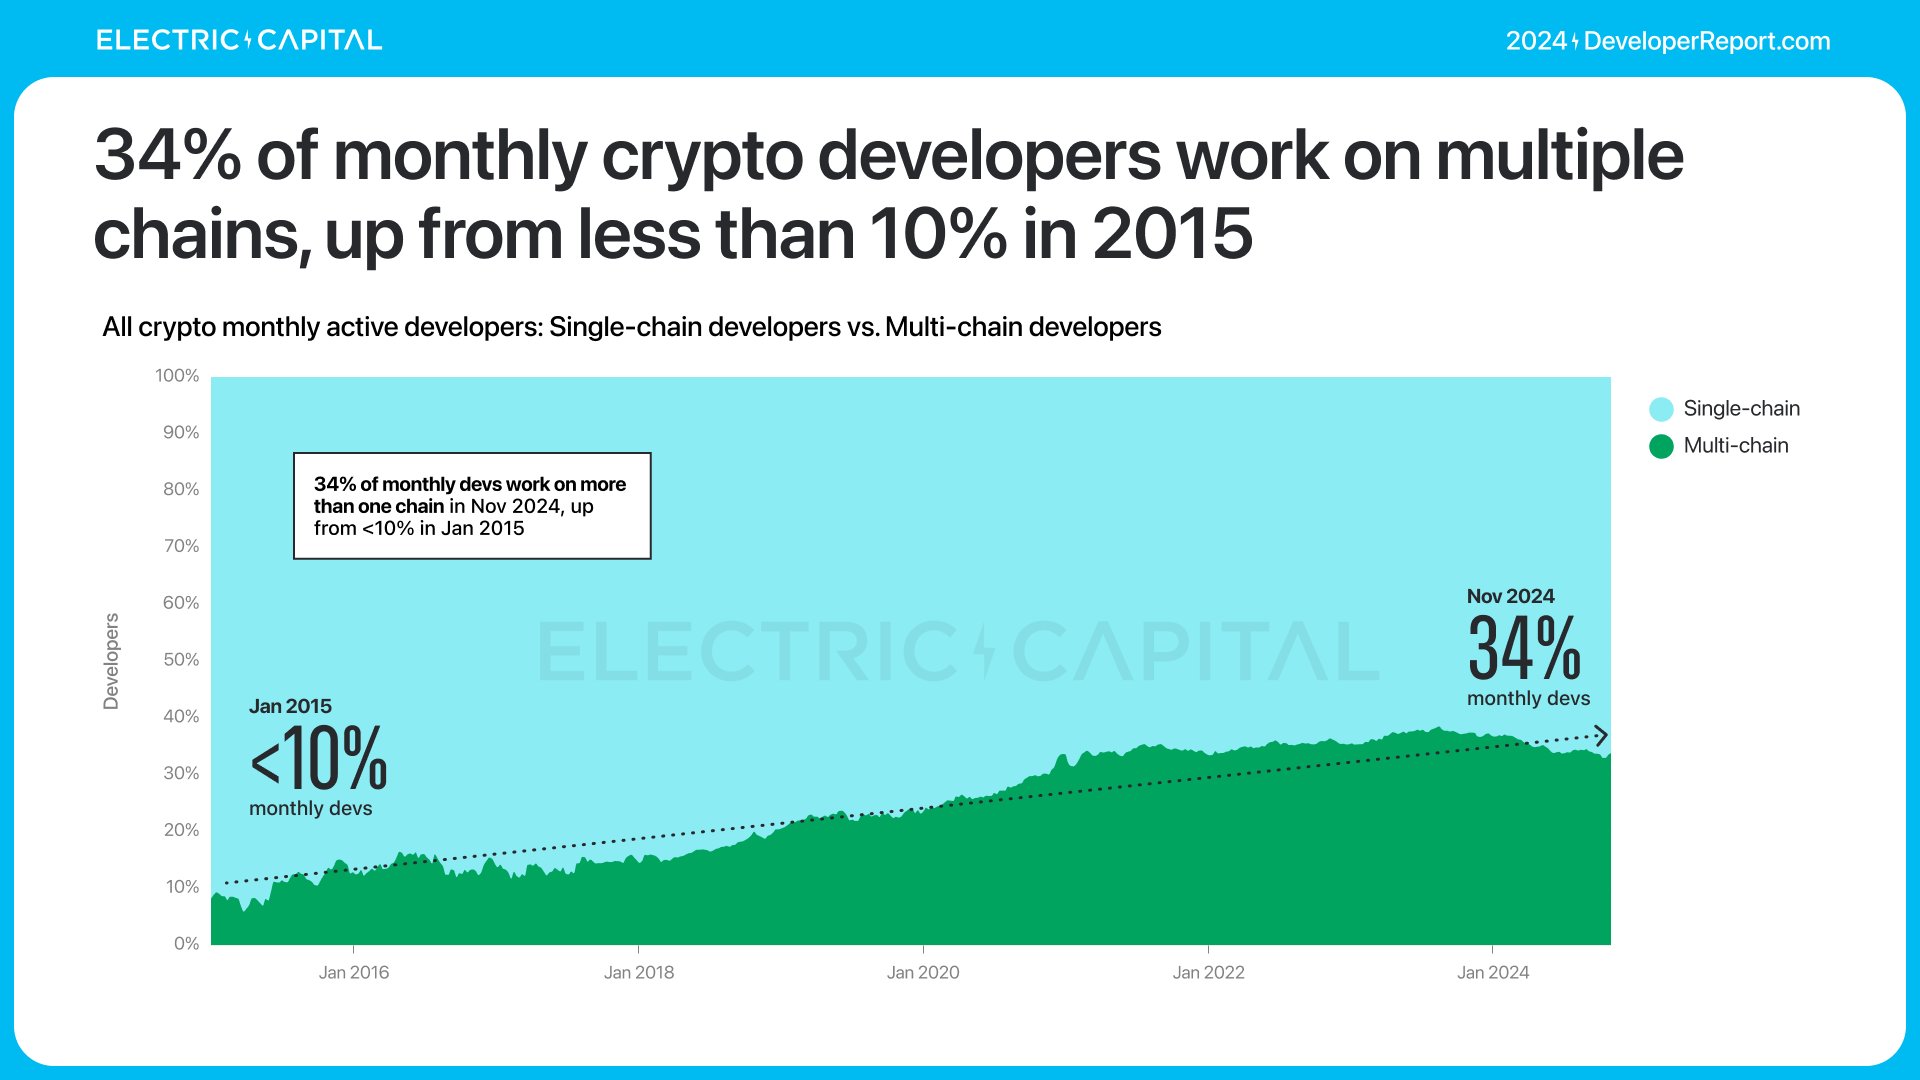
Many developers are active across multiple chains—now, one in three crypto developers works across multiple chains, and this trend is growing. Monthly active multi-chain developers increased from under 10% in 2015 to 34% in 2024.
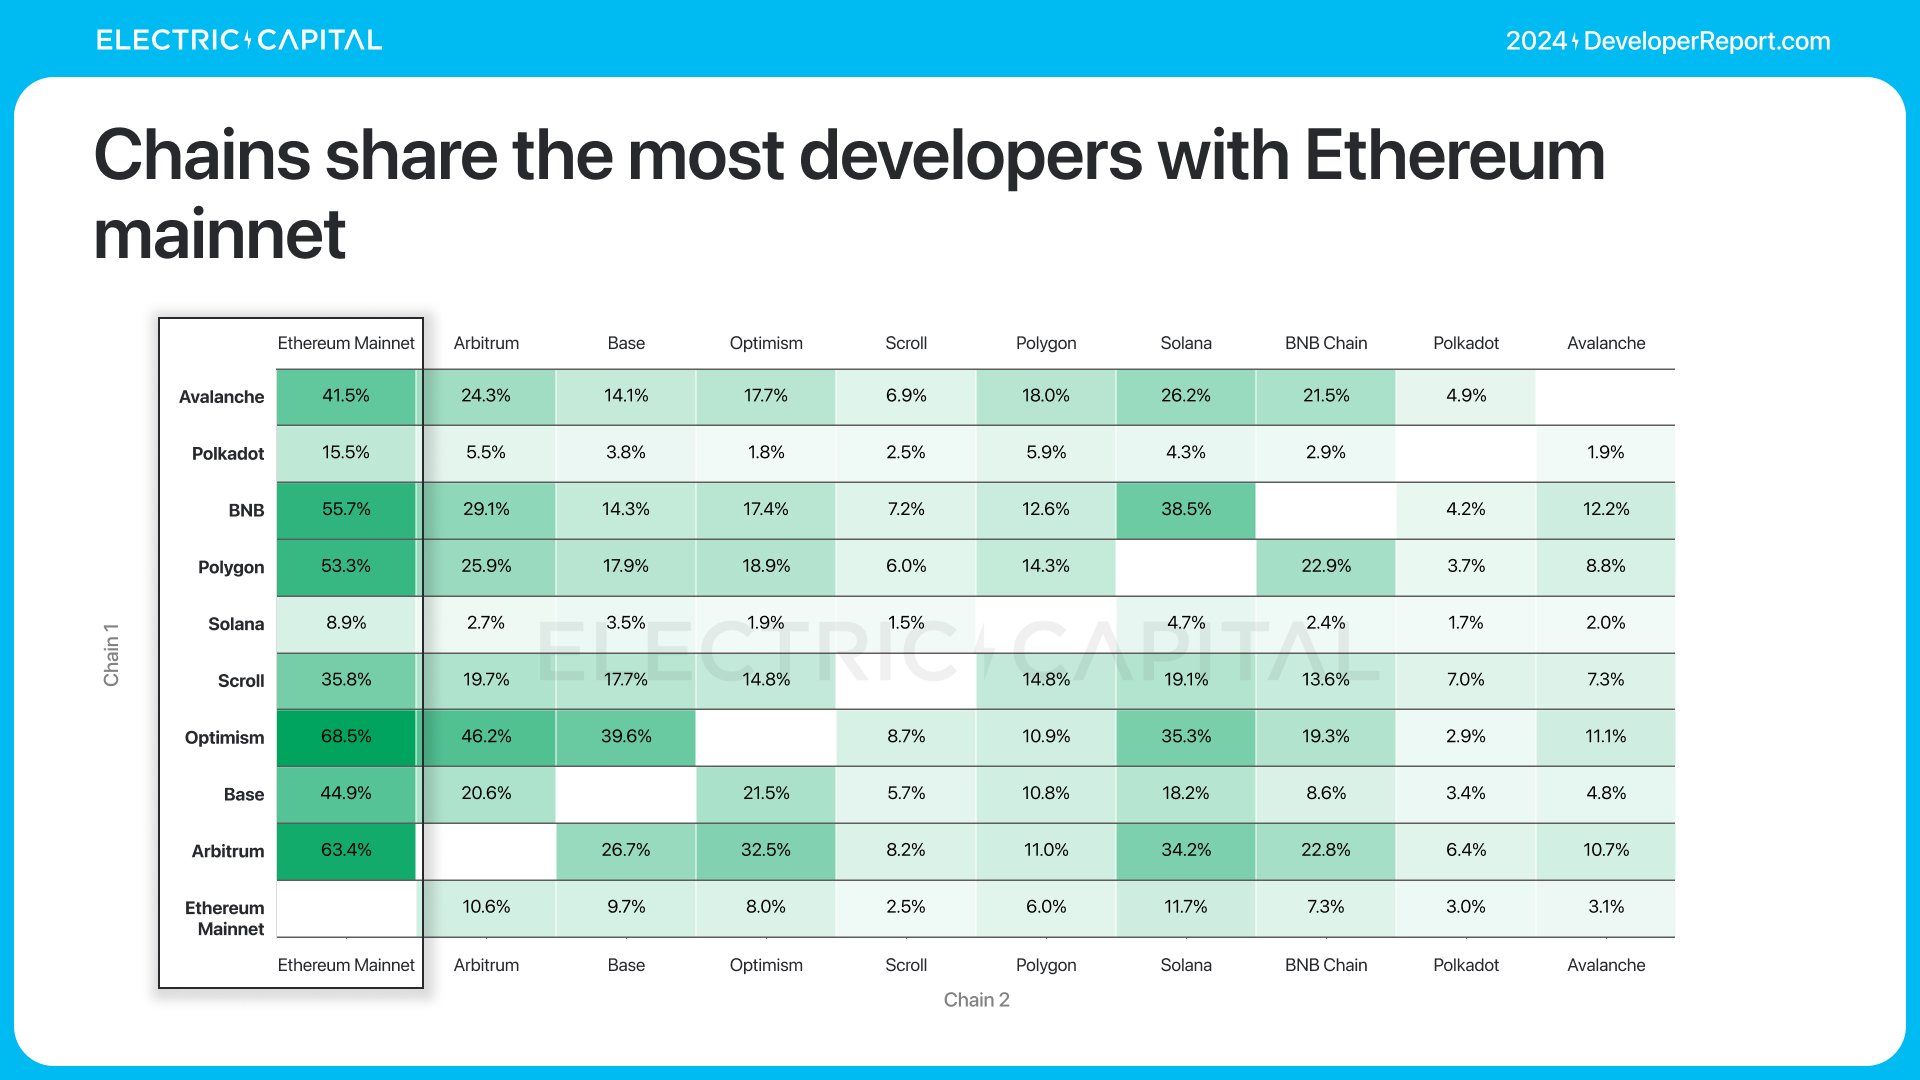
Chains with the most multi-chain developers share developer resources with Ethereum.
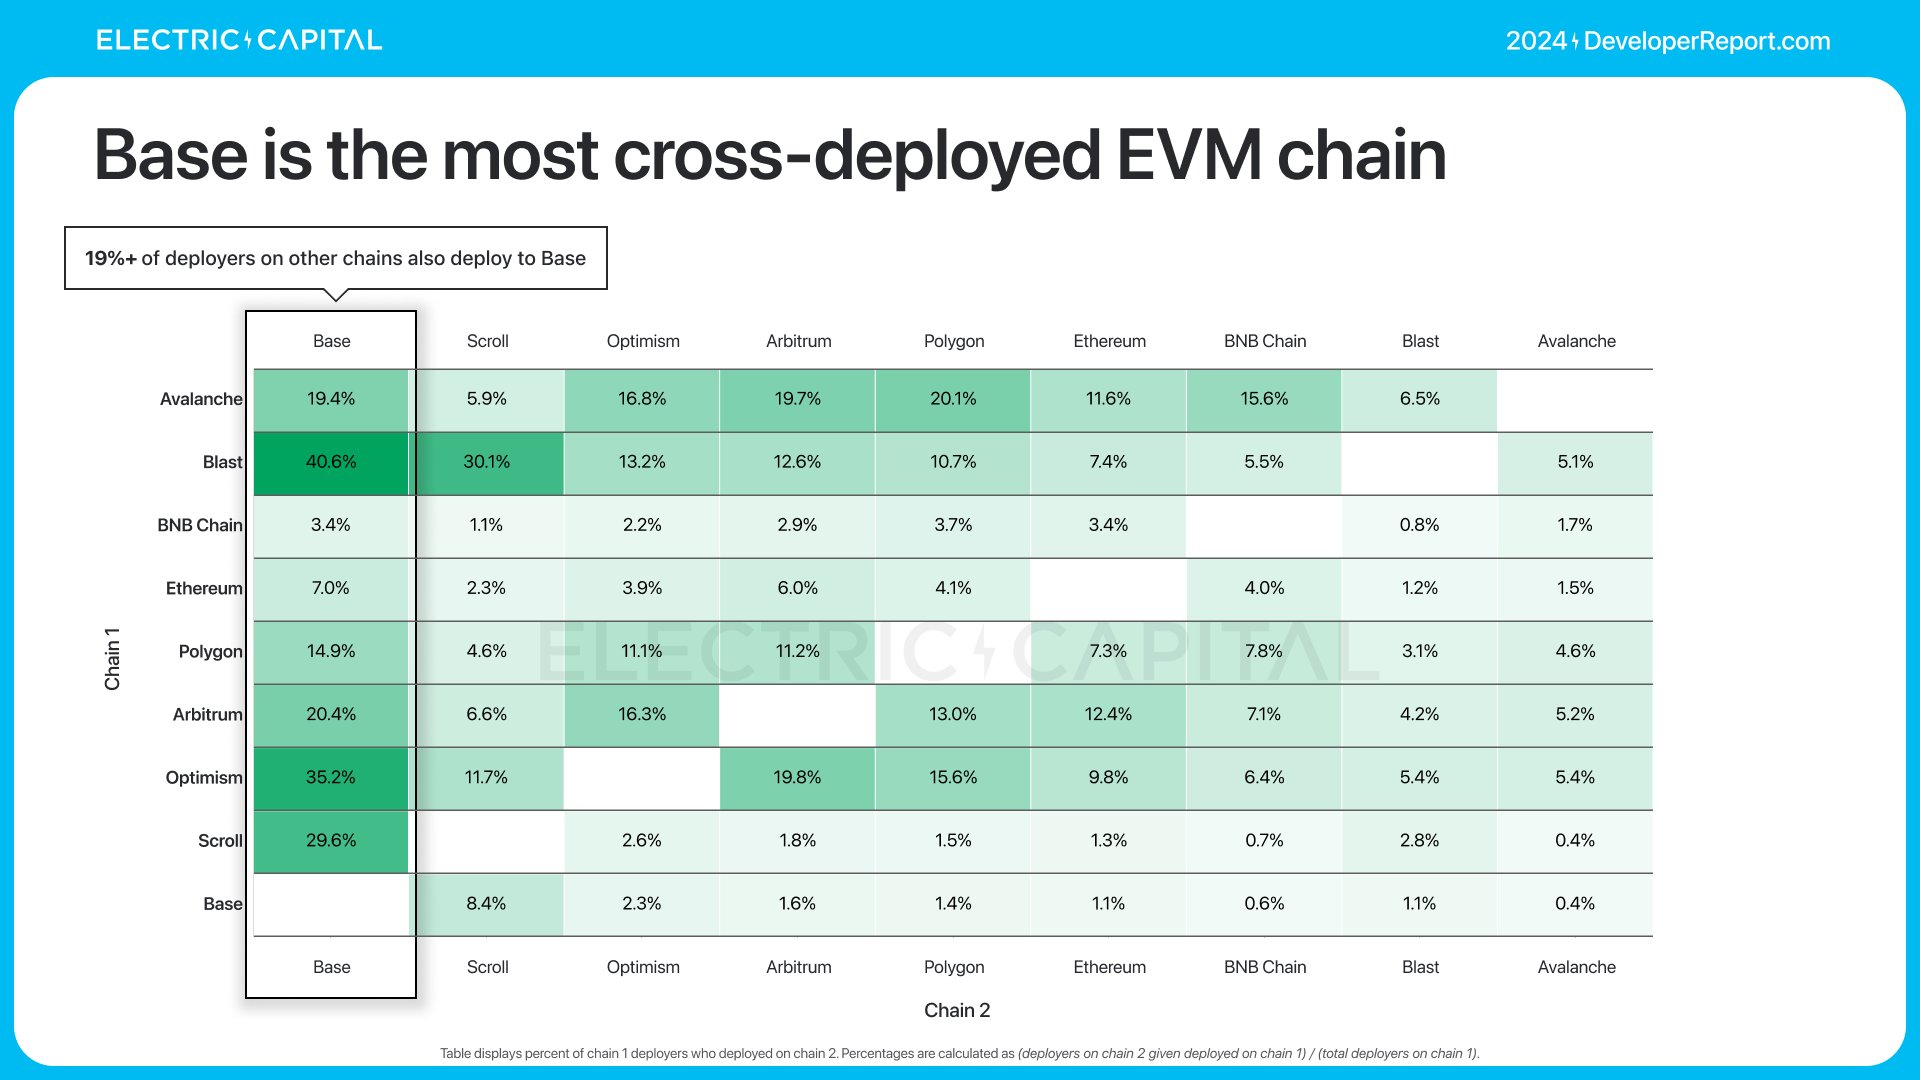
EVM chains share the most developers and exhibit strong network effects: 74% of multi-chain developers work on EVM chains.
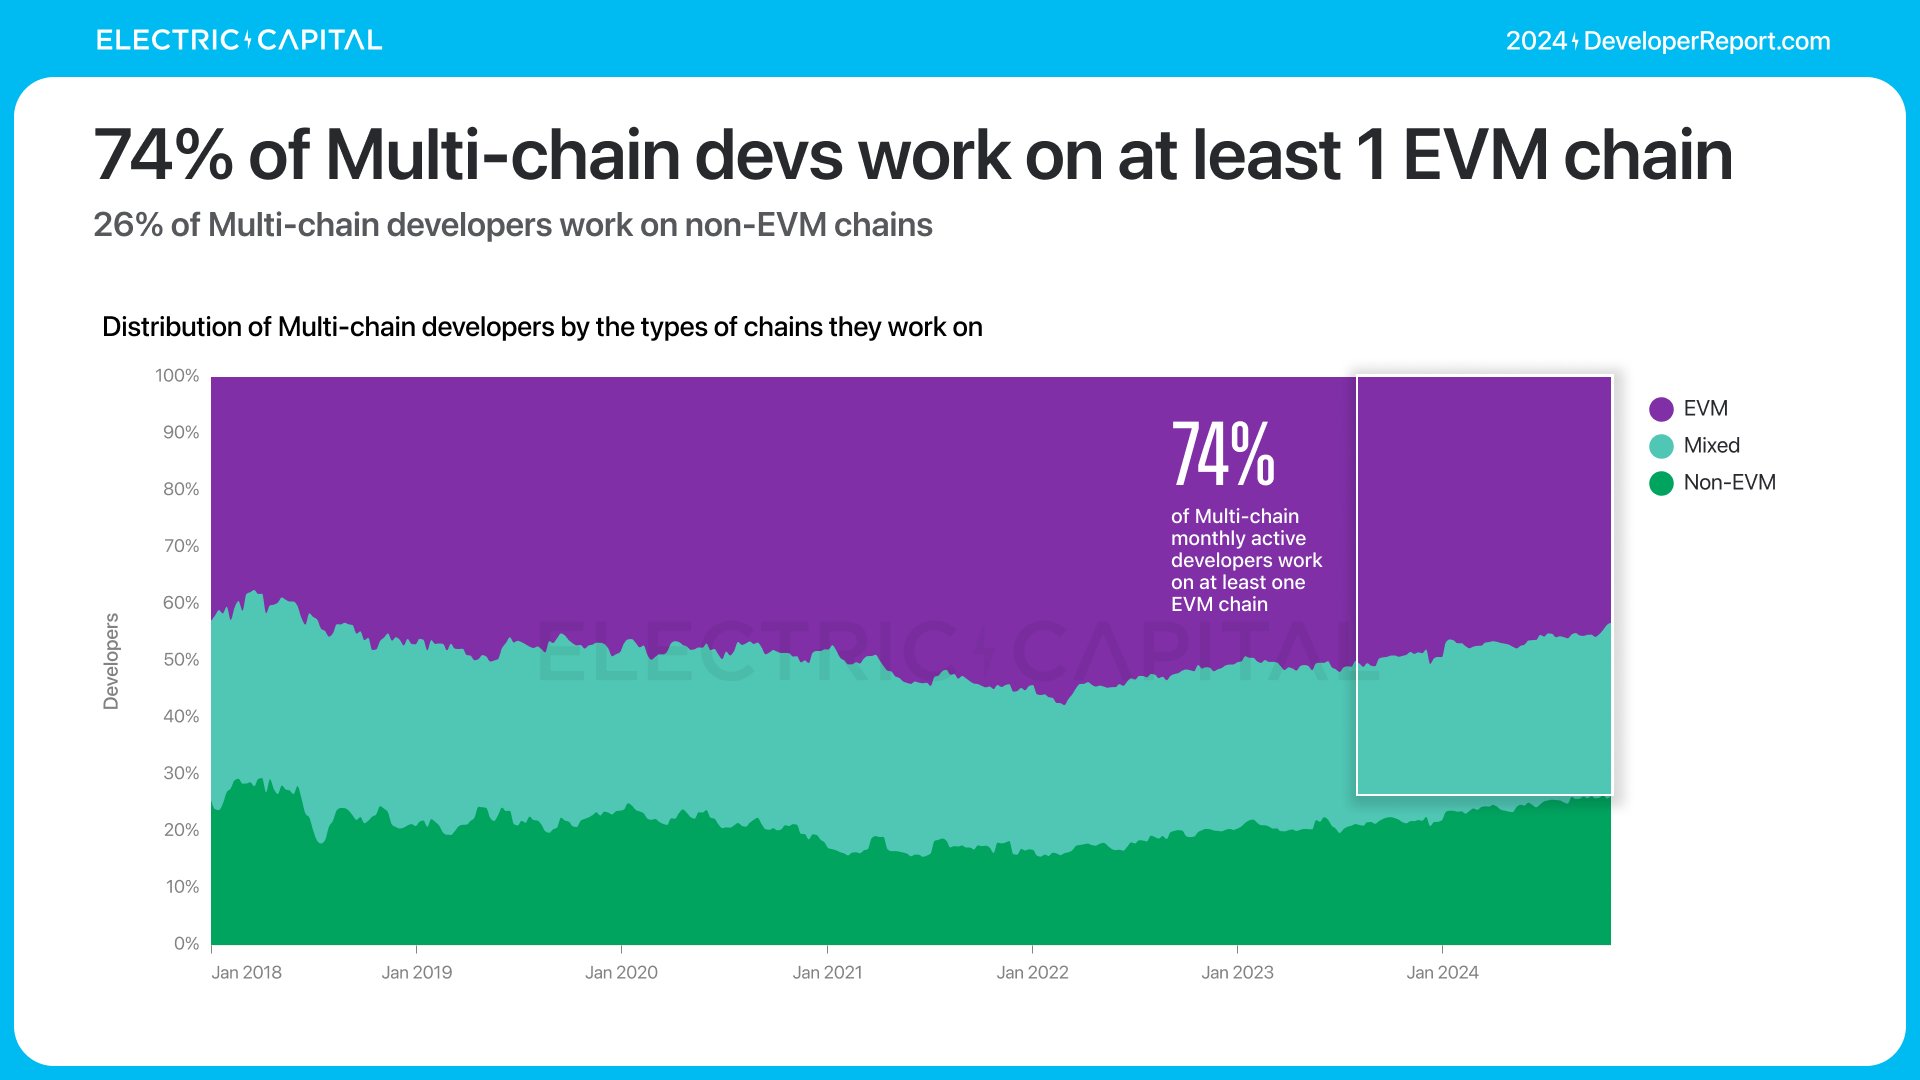
Since 2021, the proportion of EVM cross-chain deployers has grown fourfold.

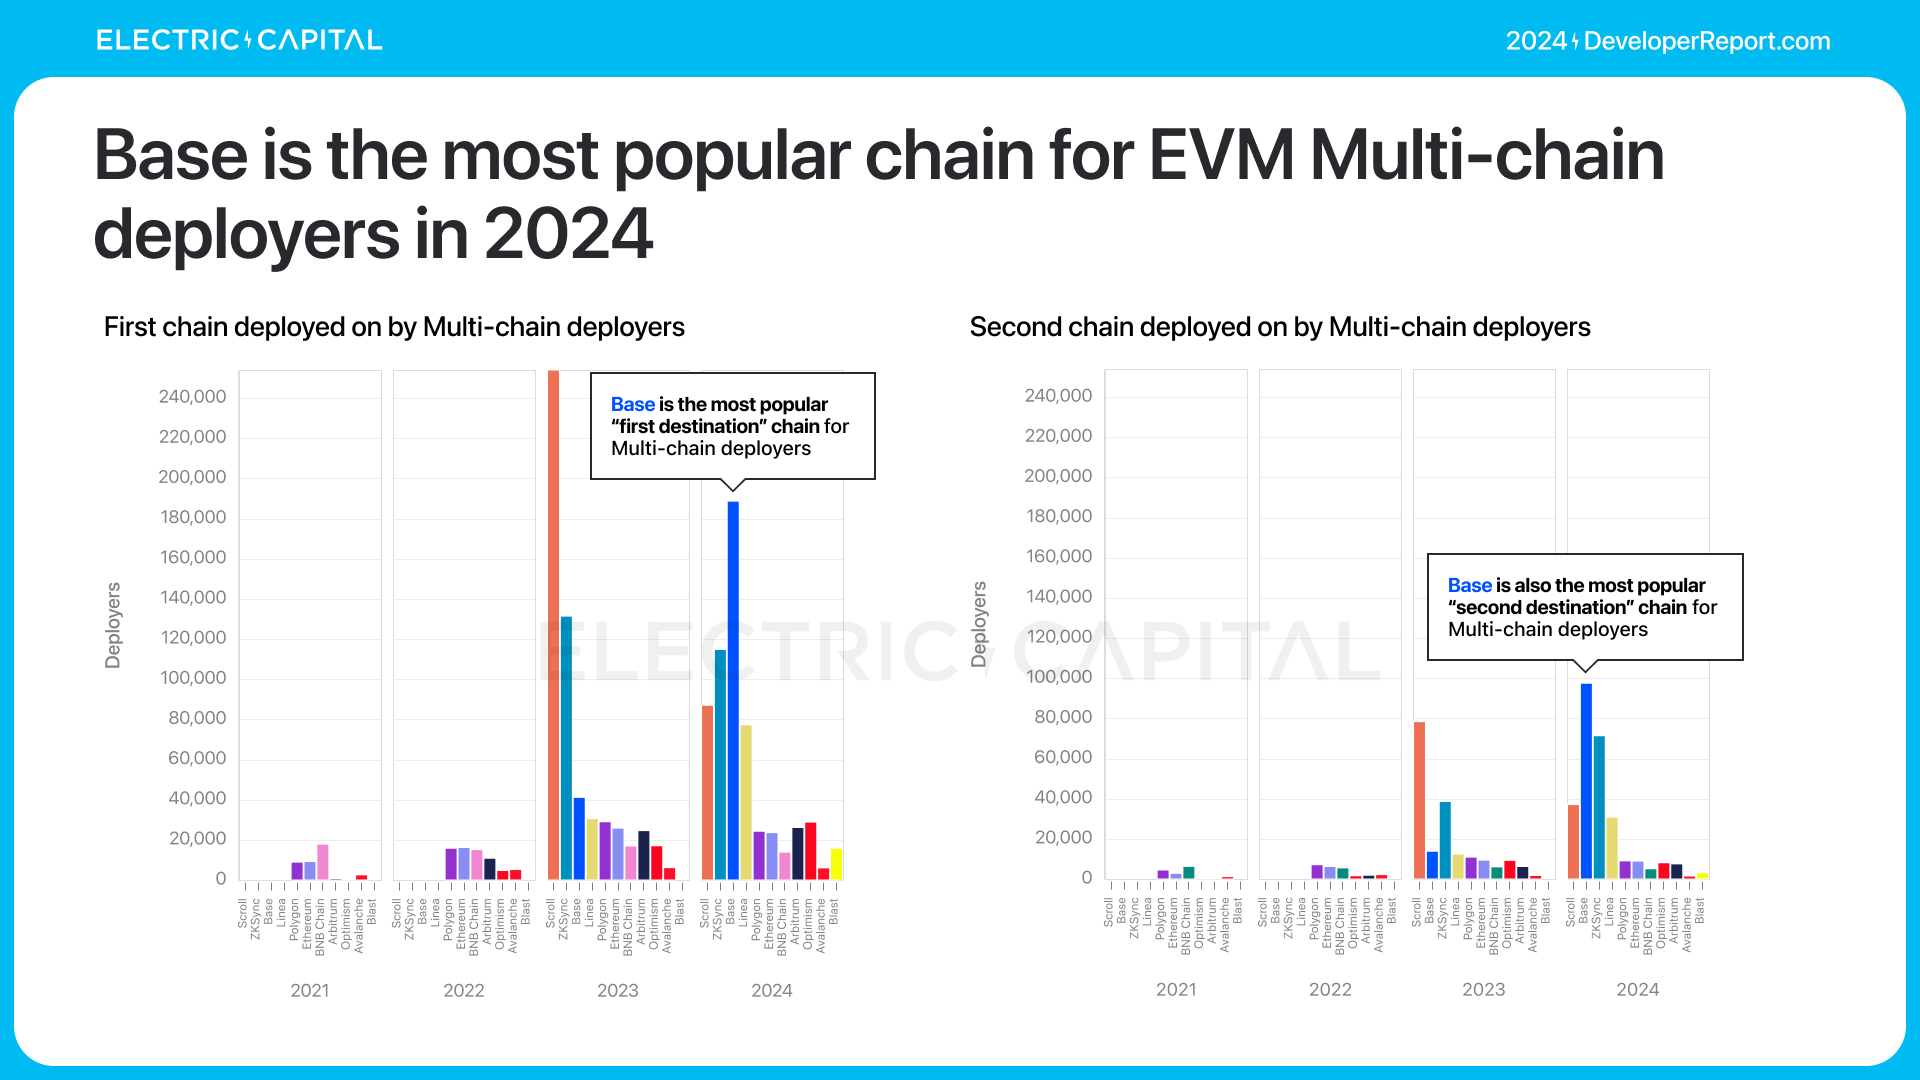
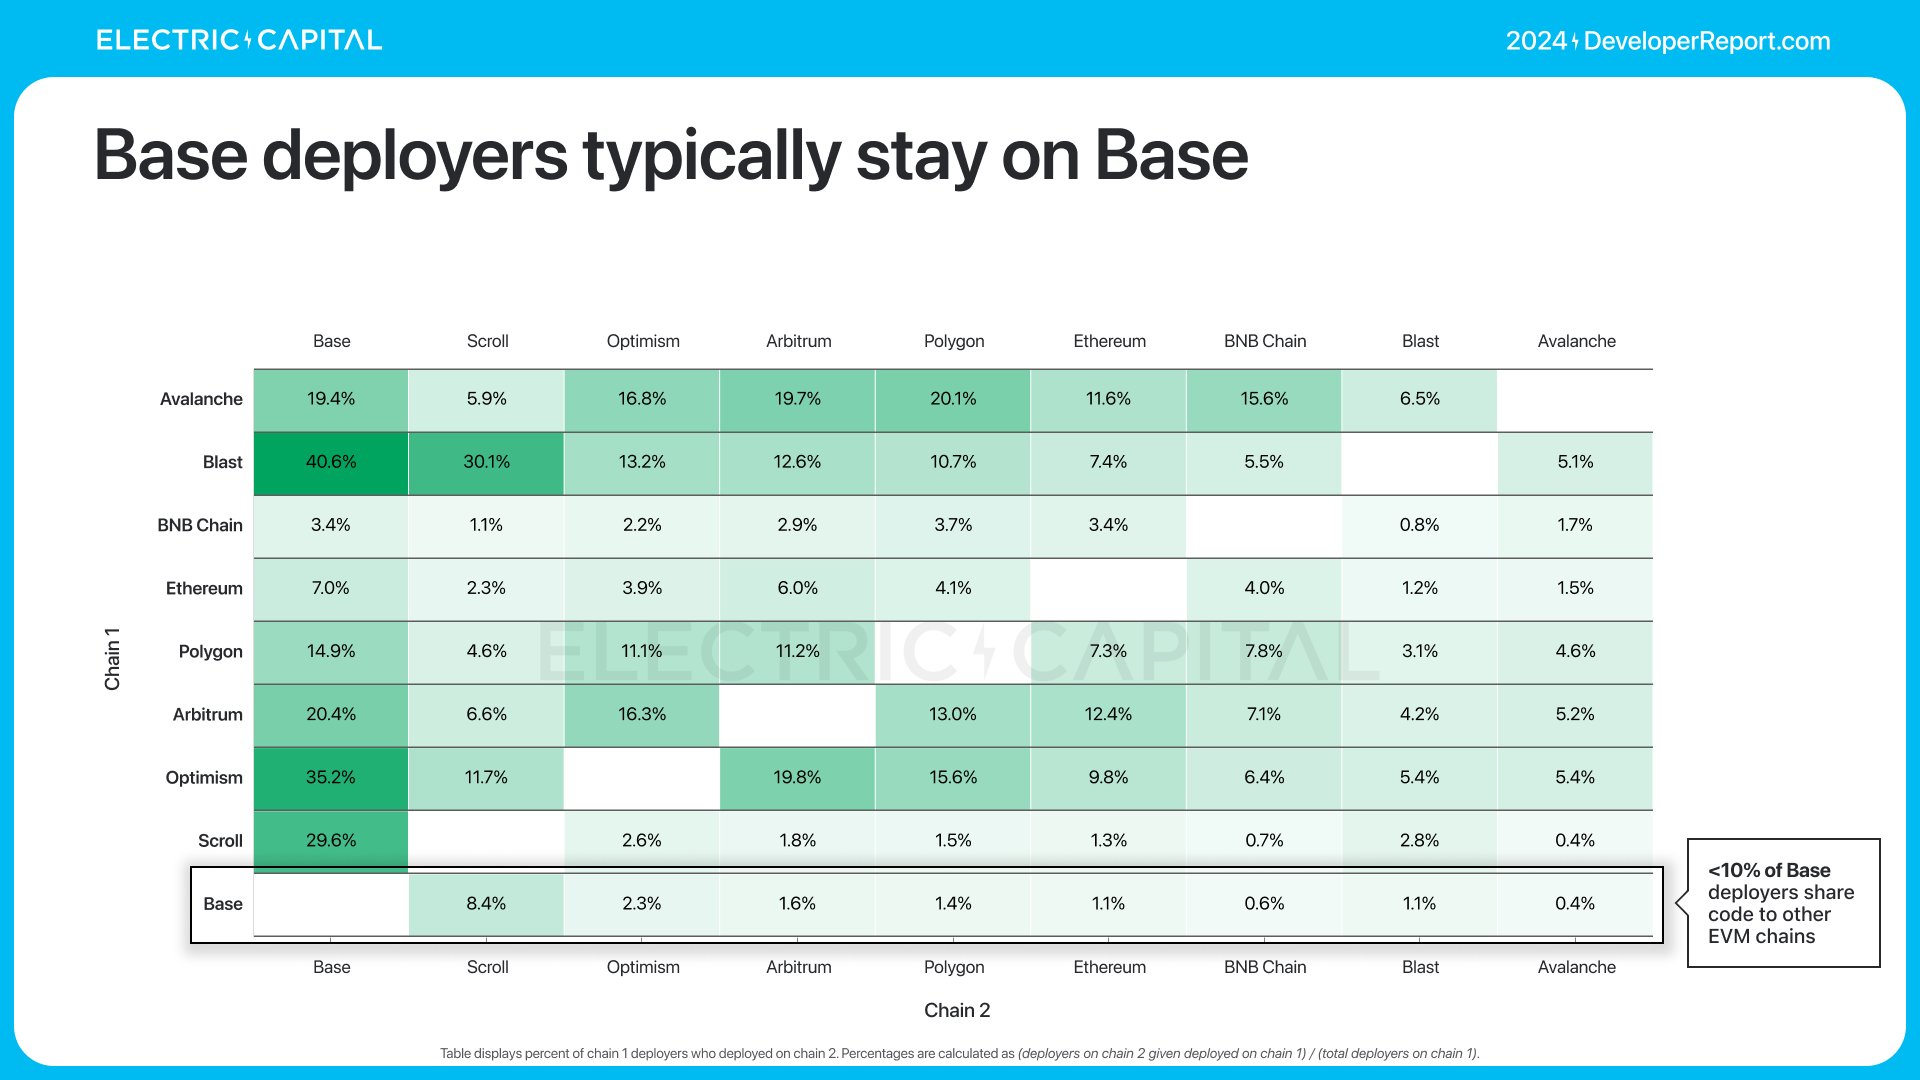
Base is the most popular EVM chain for multi-chain deployers in 2024, but Base’s deployers tend to stay on Base.
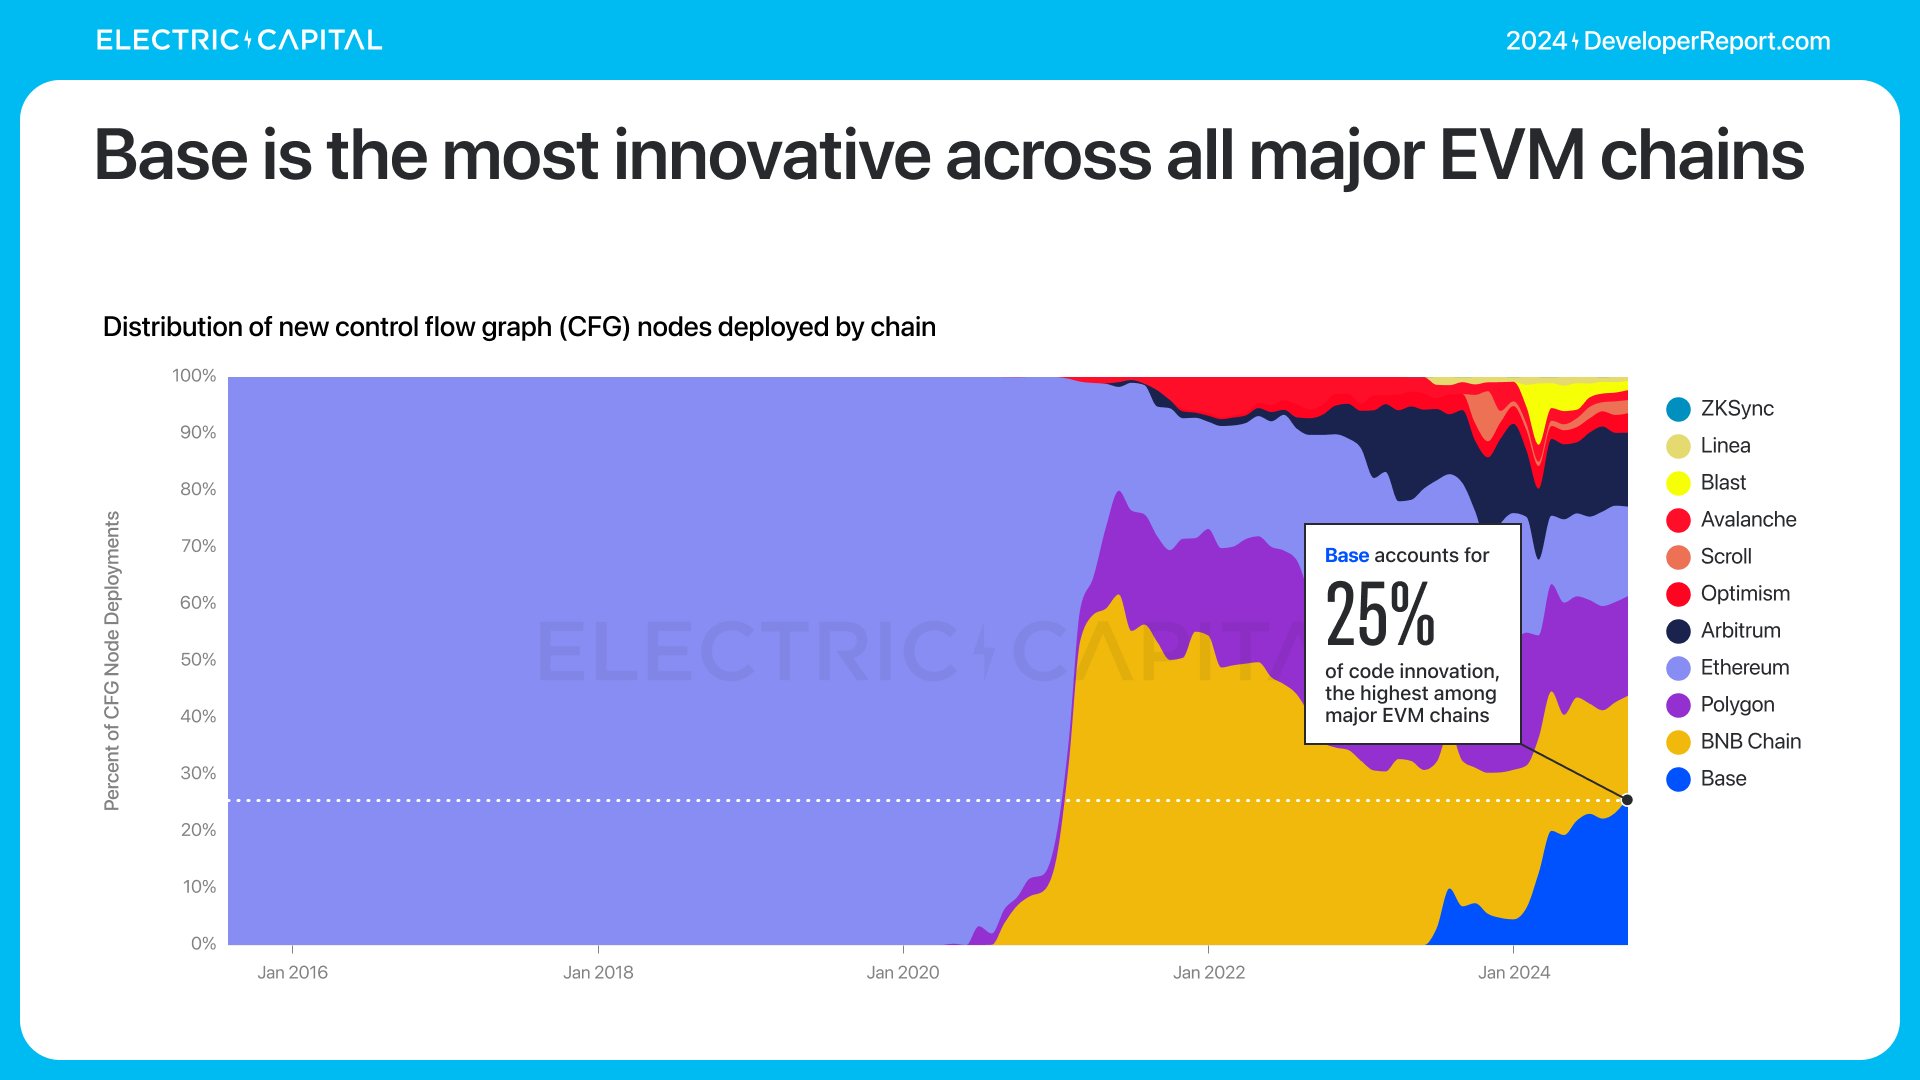
Since deployers publish code across multiple chains, where is most original code written?
Prior to 2020, nearly all original on-chain logic on EVM chains originated on Ethereum.

Now, no single EVM chain accounts for more than 30% of code innovation.

Base now accounts for 25% of all original on-chain logic across EVM chains—the highest among major EVM chains.
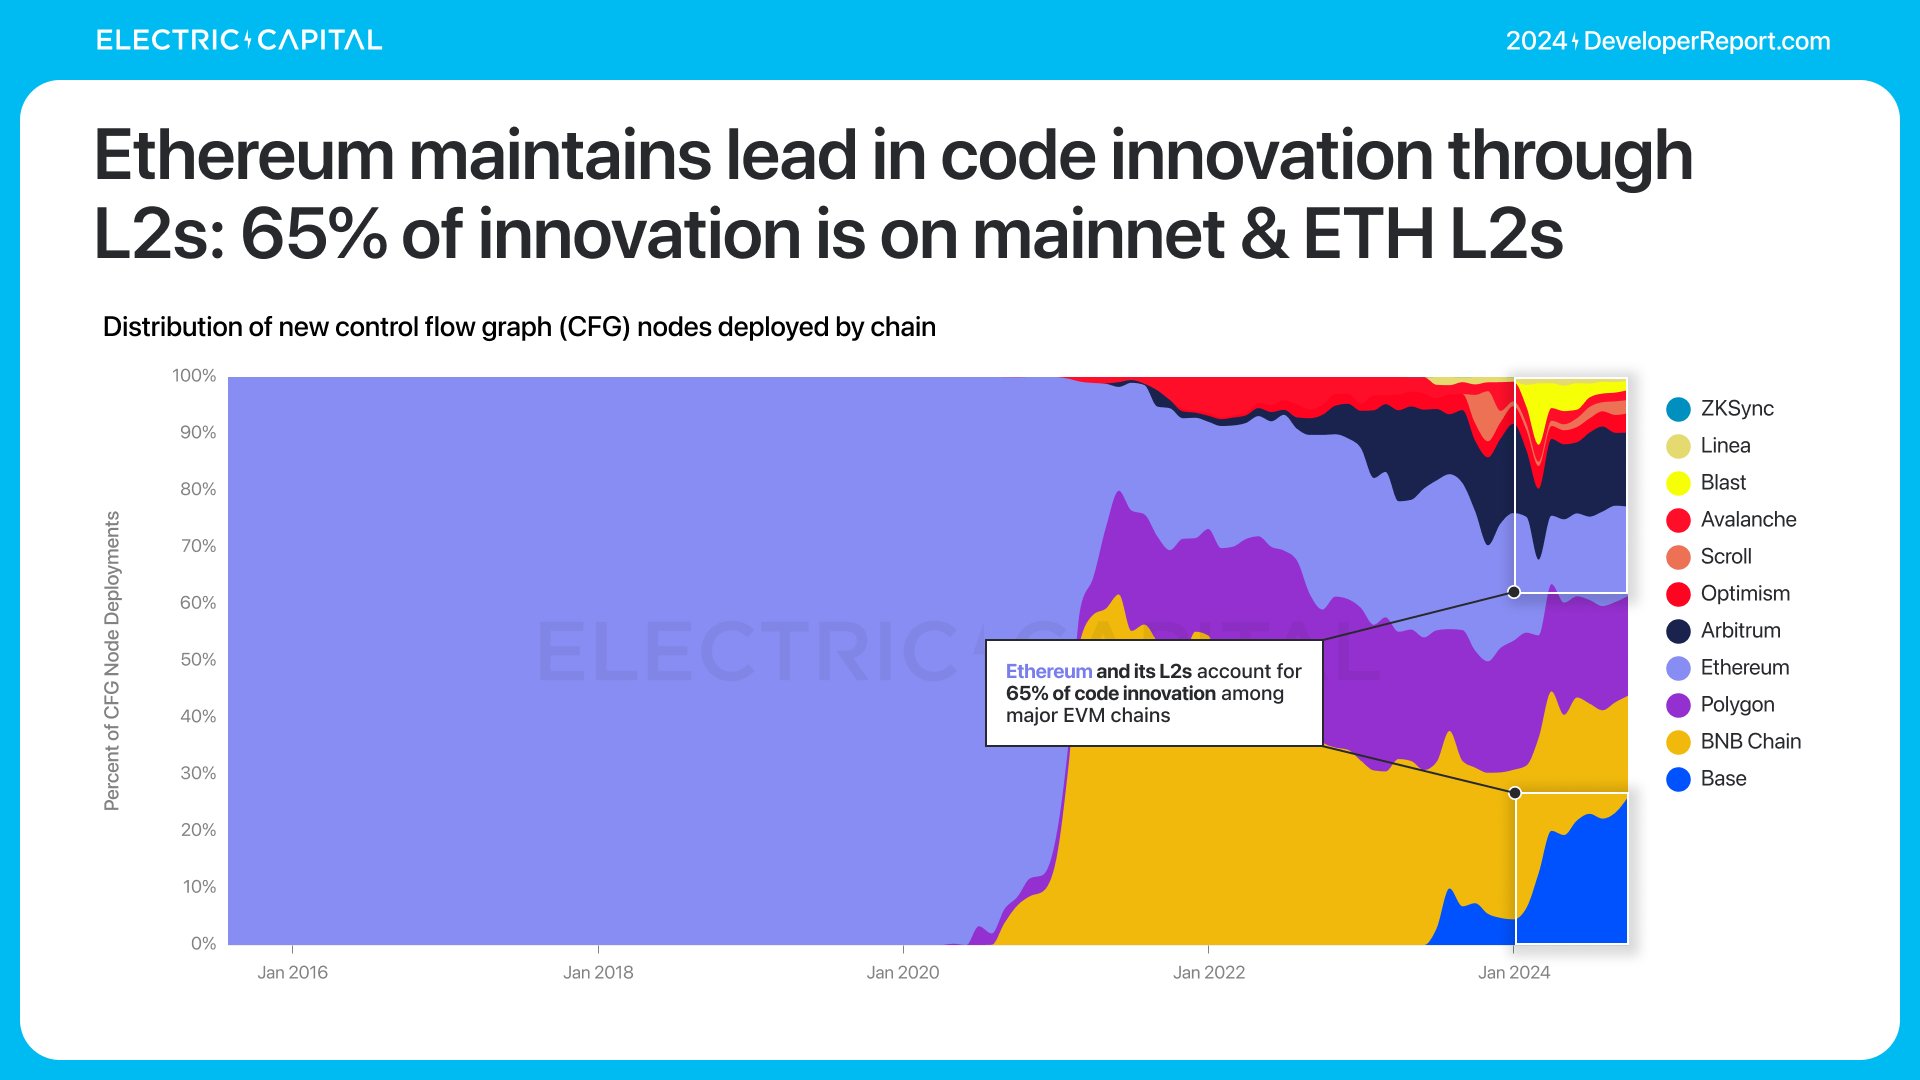
This is how the Ethereum ecosystem maintains its lead in code innovation—through L2 chains. 65% of innovation occurs on Ethereum mainnet and ETH L2s.
Ethereum demonstrates strong network effects through dominance in EVM and multi-chain developers. How is this ecosystem performing?
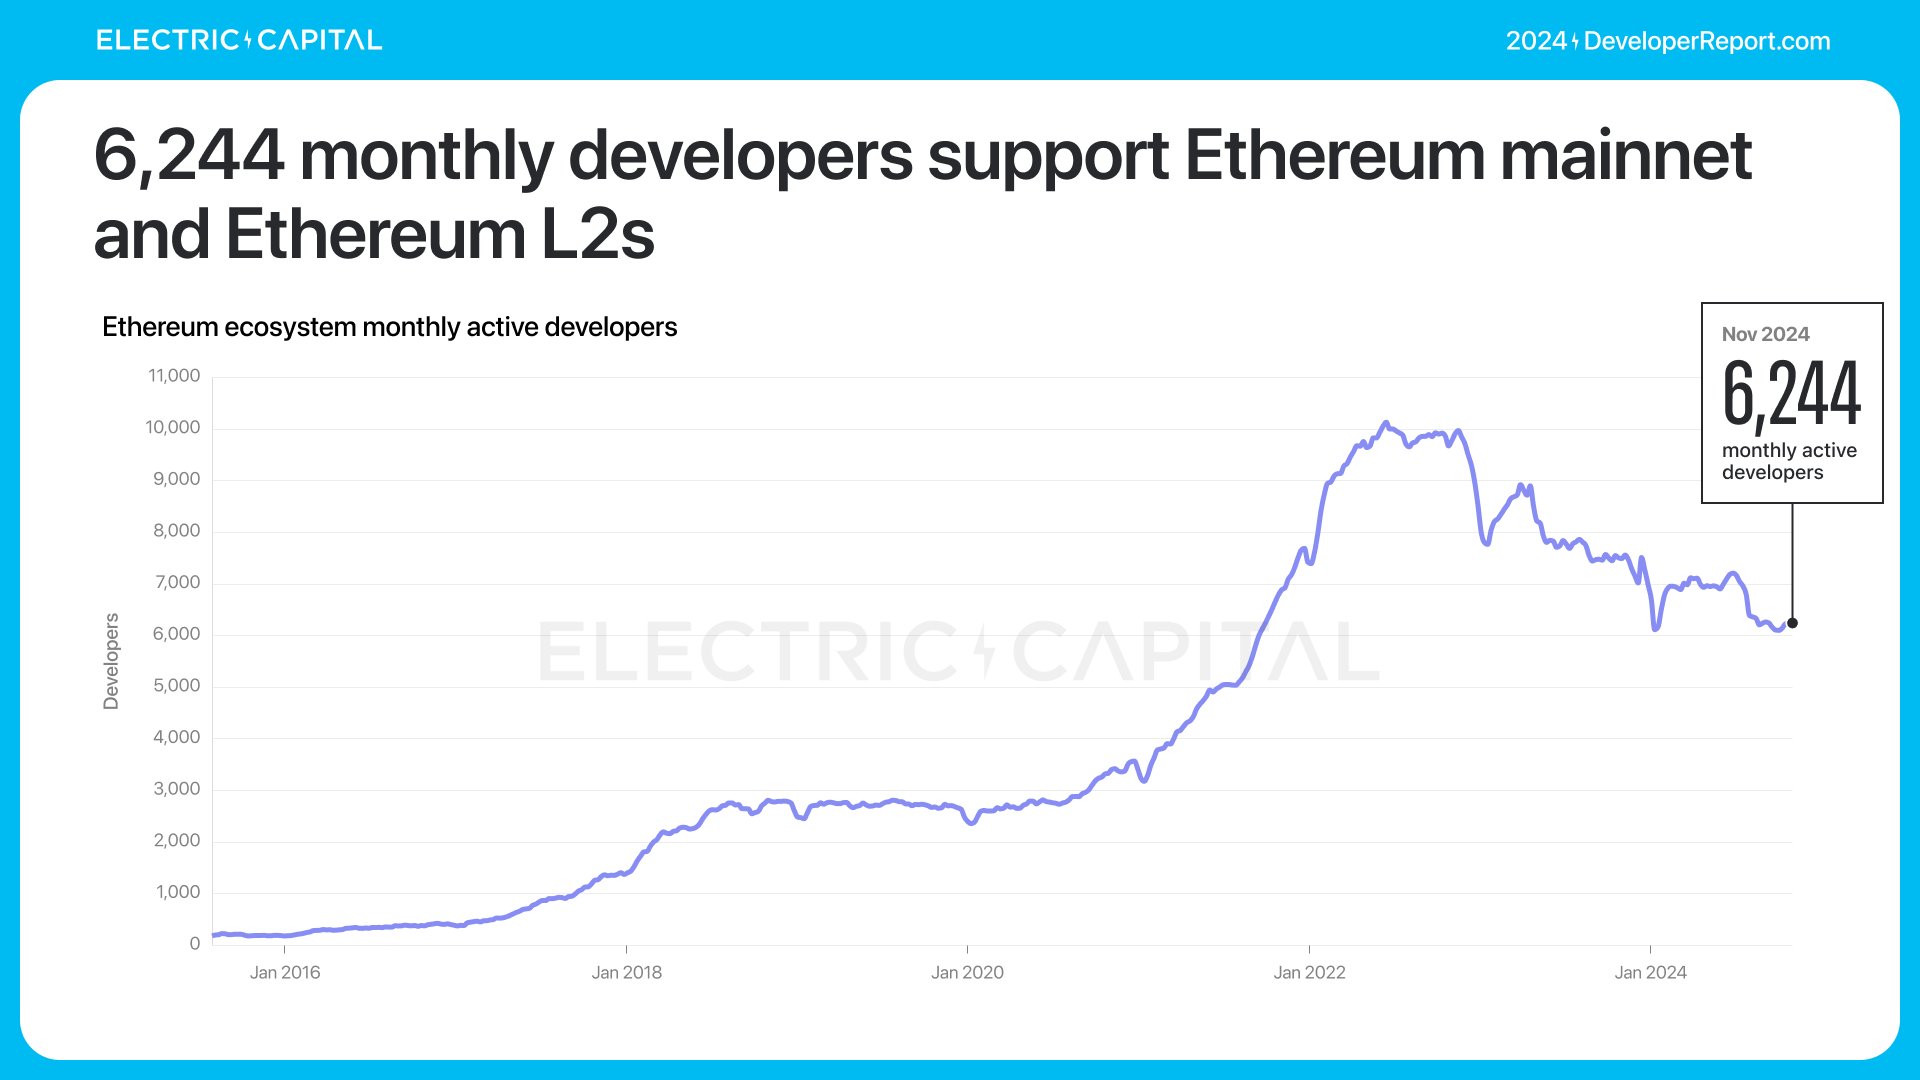
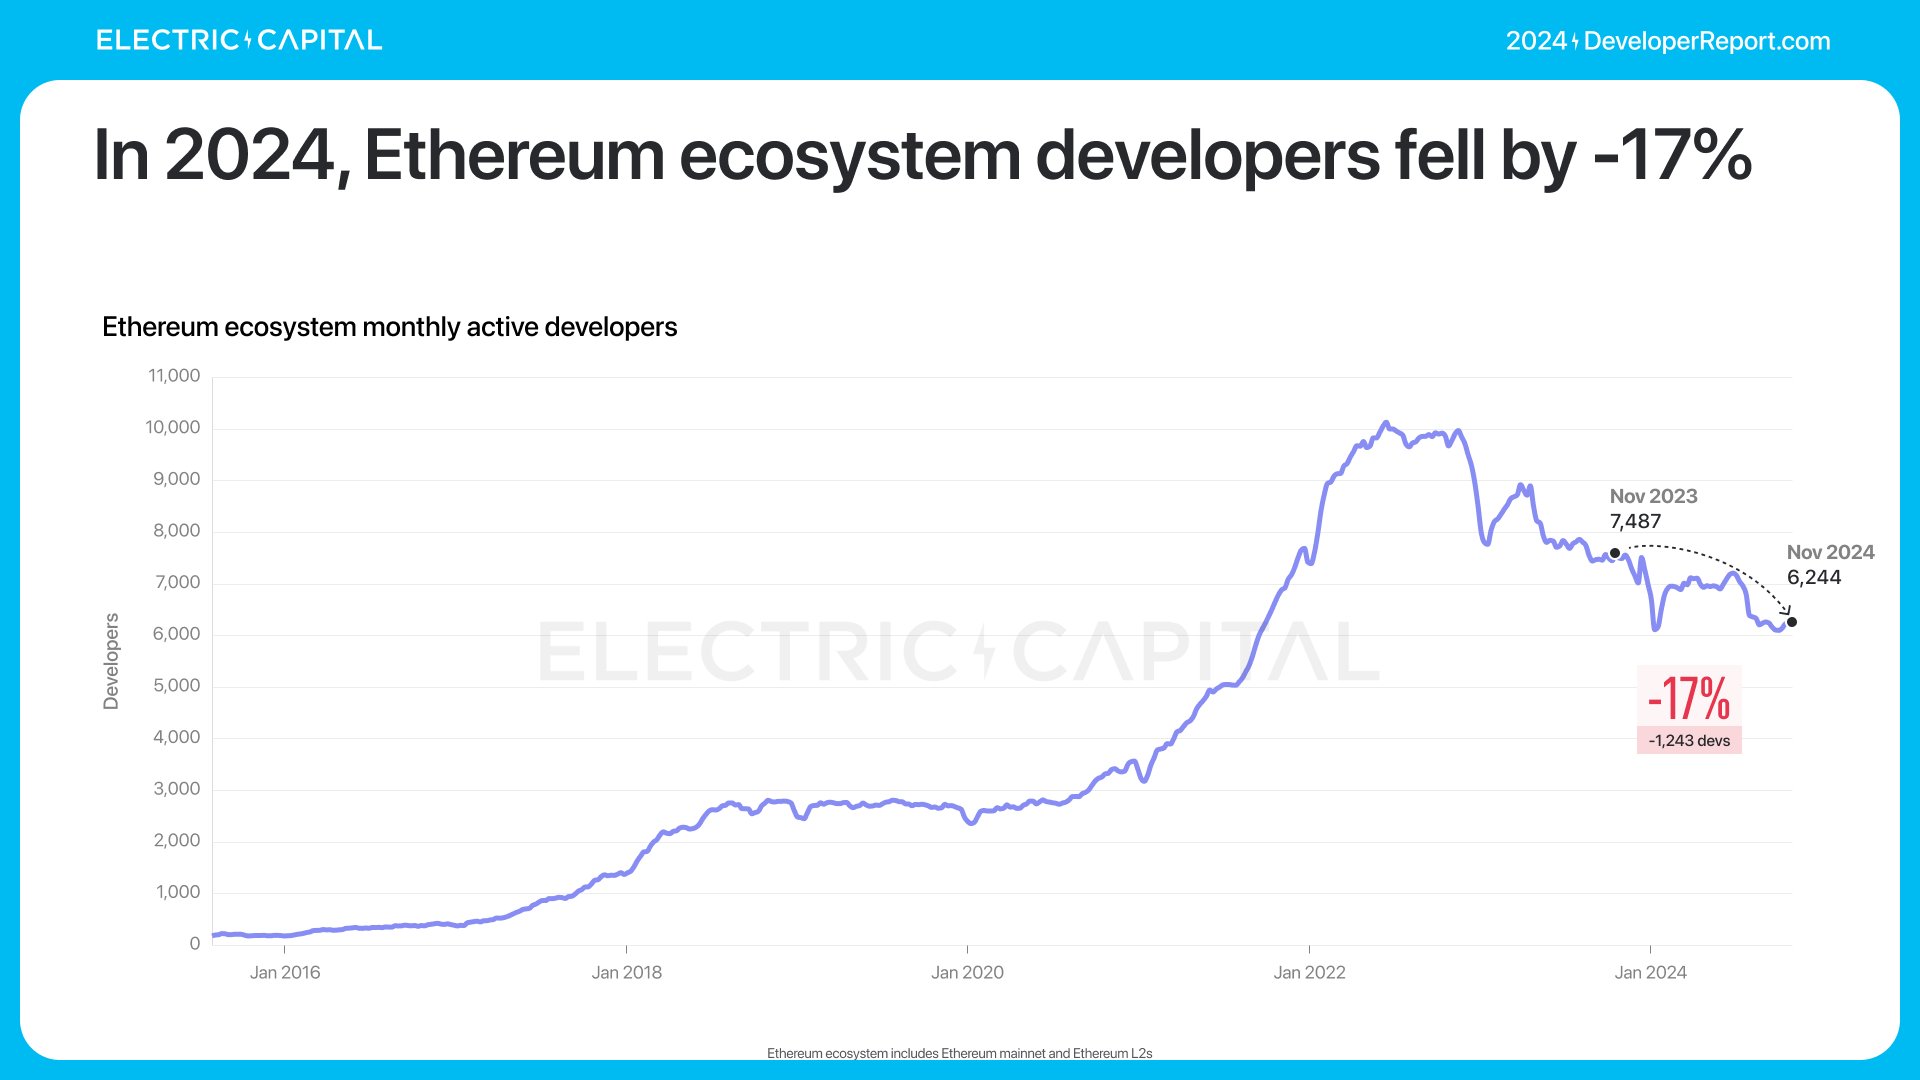
Ethereum has 6,244 monthly active developers, down 17% year-over-year.
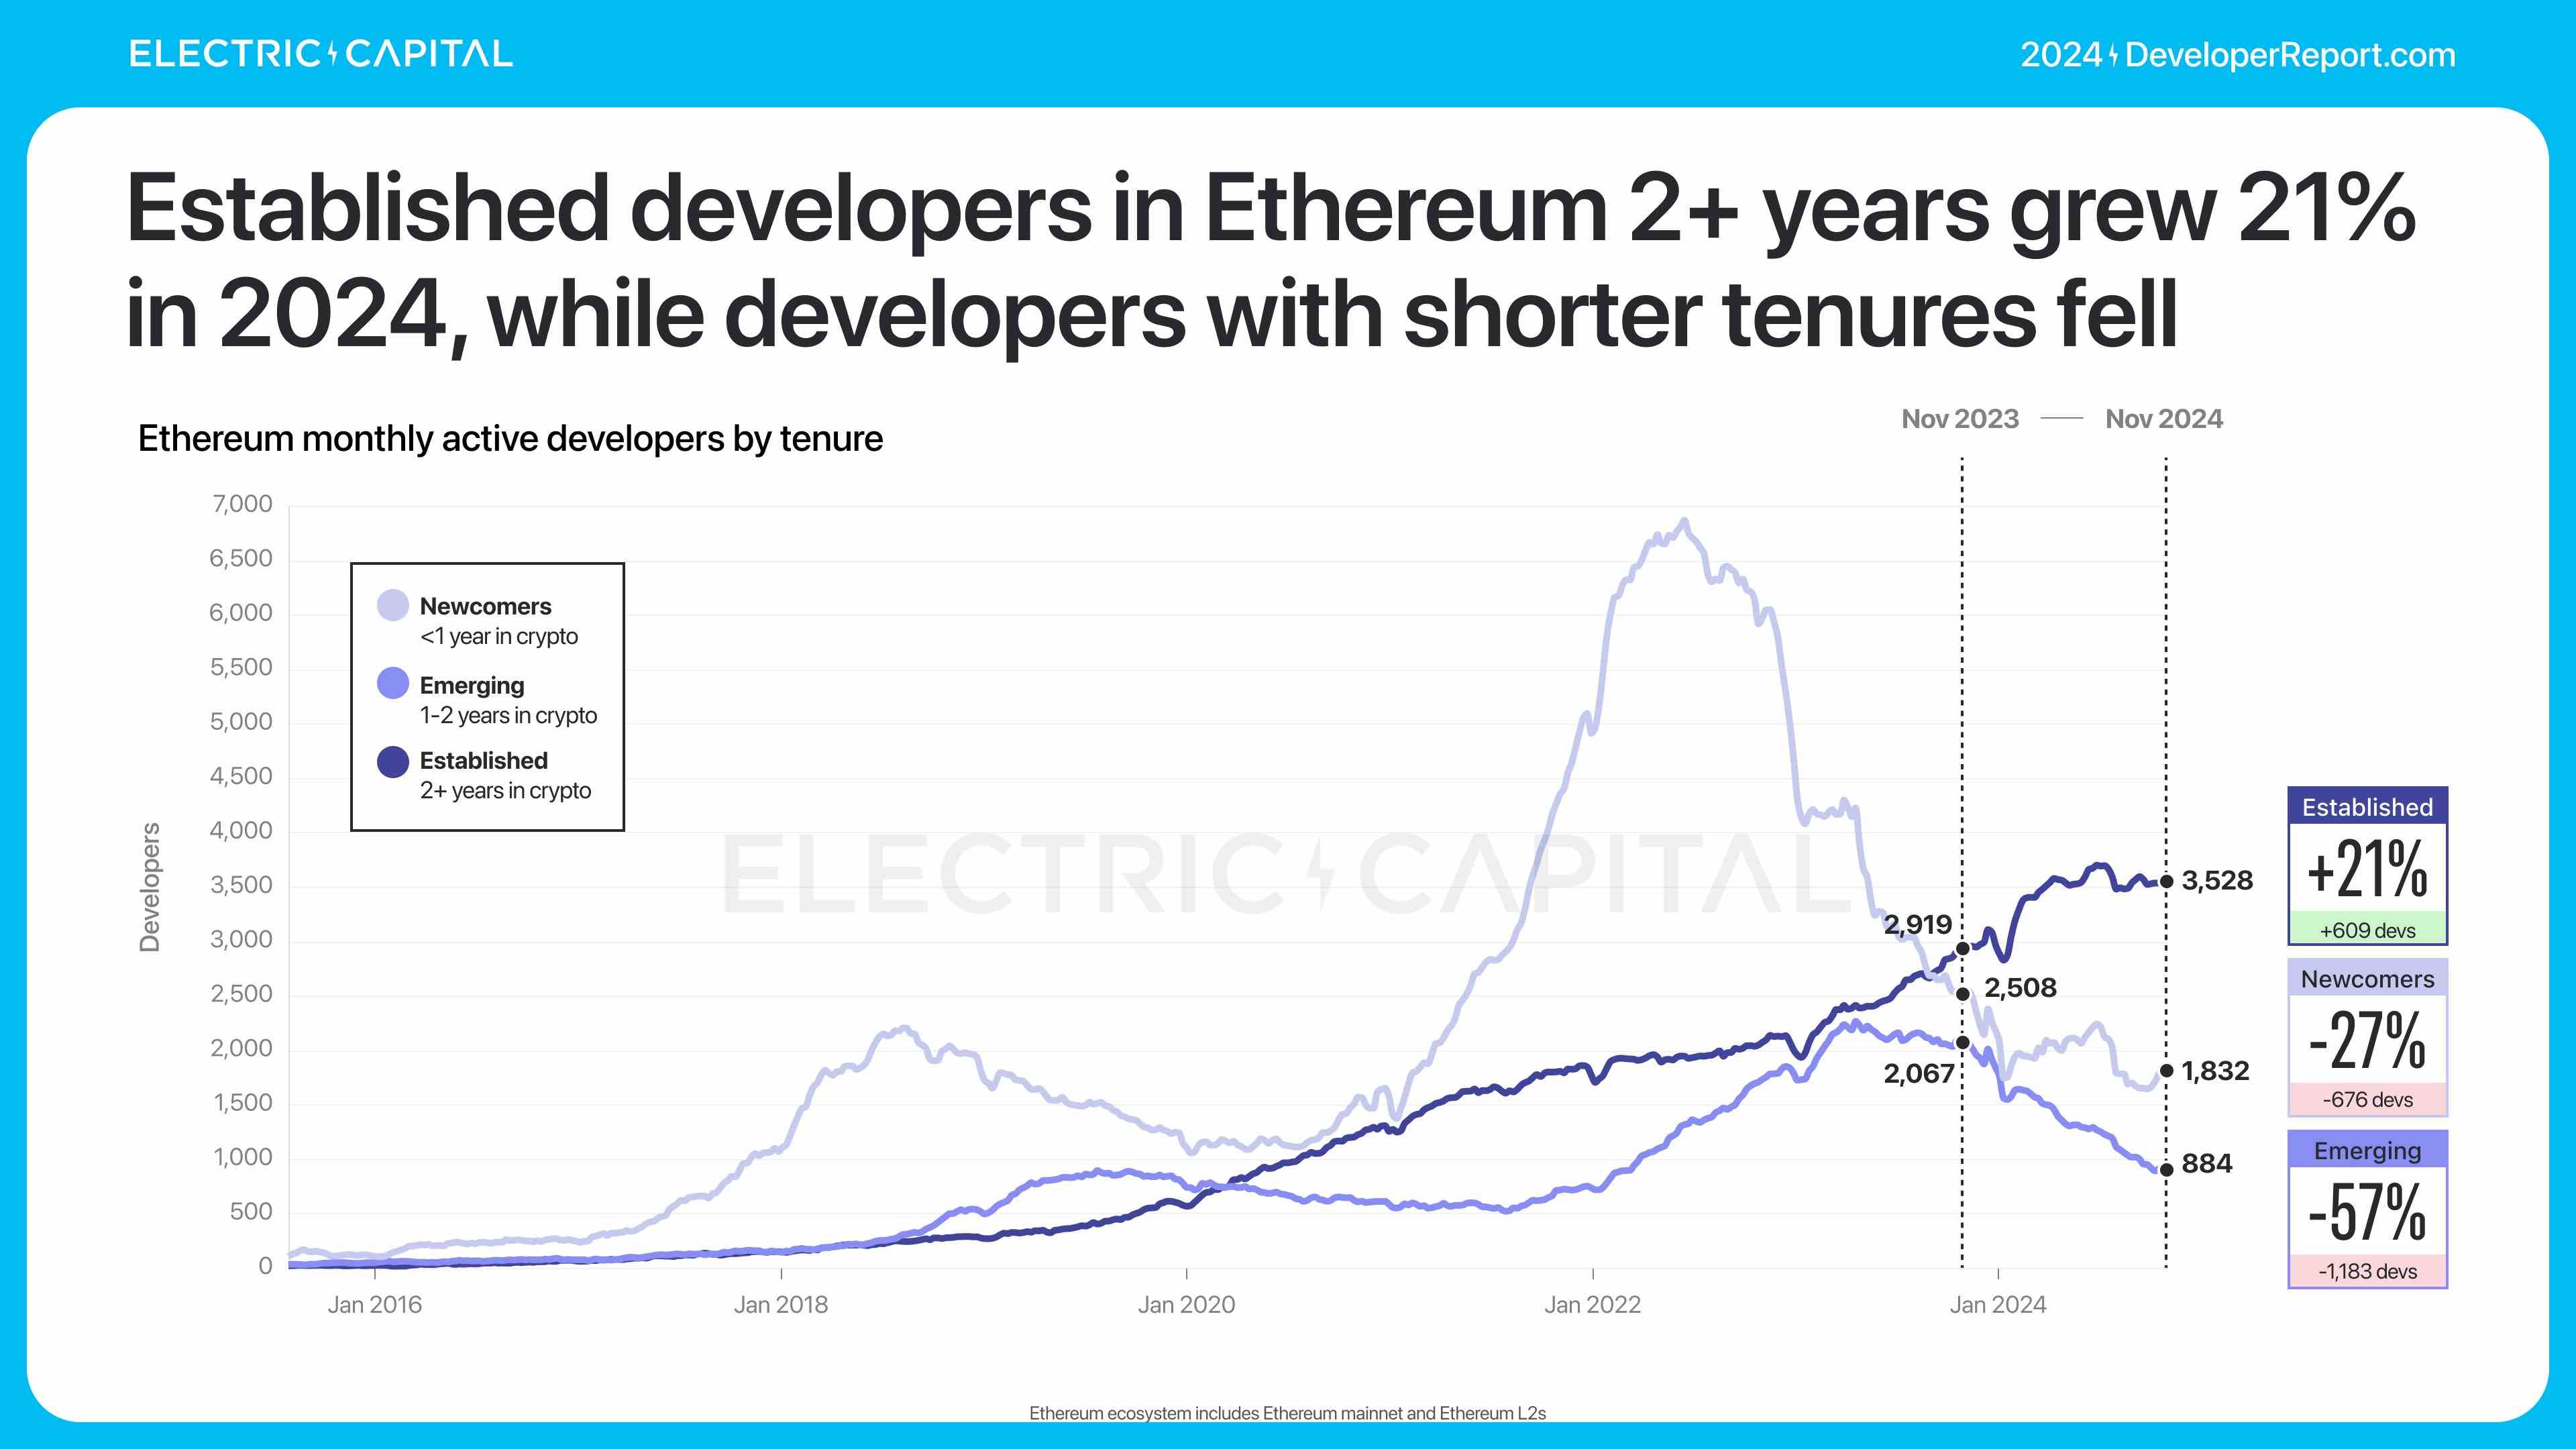
Most losses come from developers who joined after 2021. Among developers already working on Ethereum, those with over two years of experience grew by 21%.
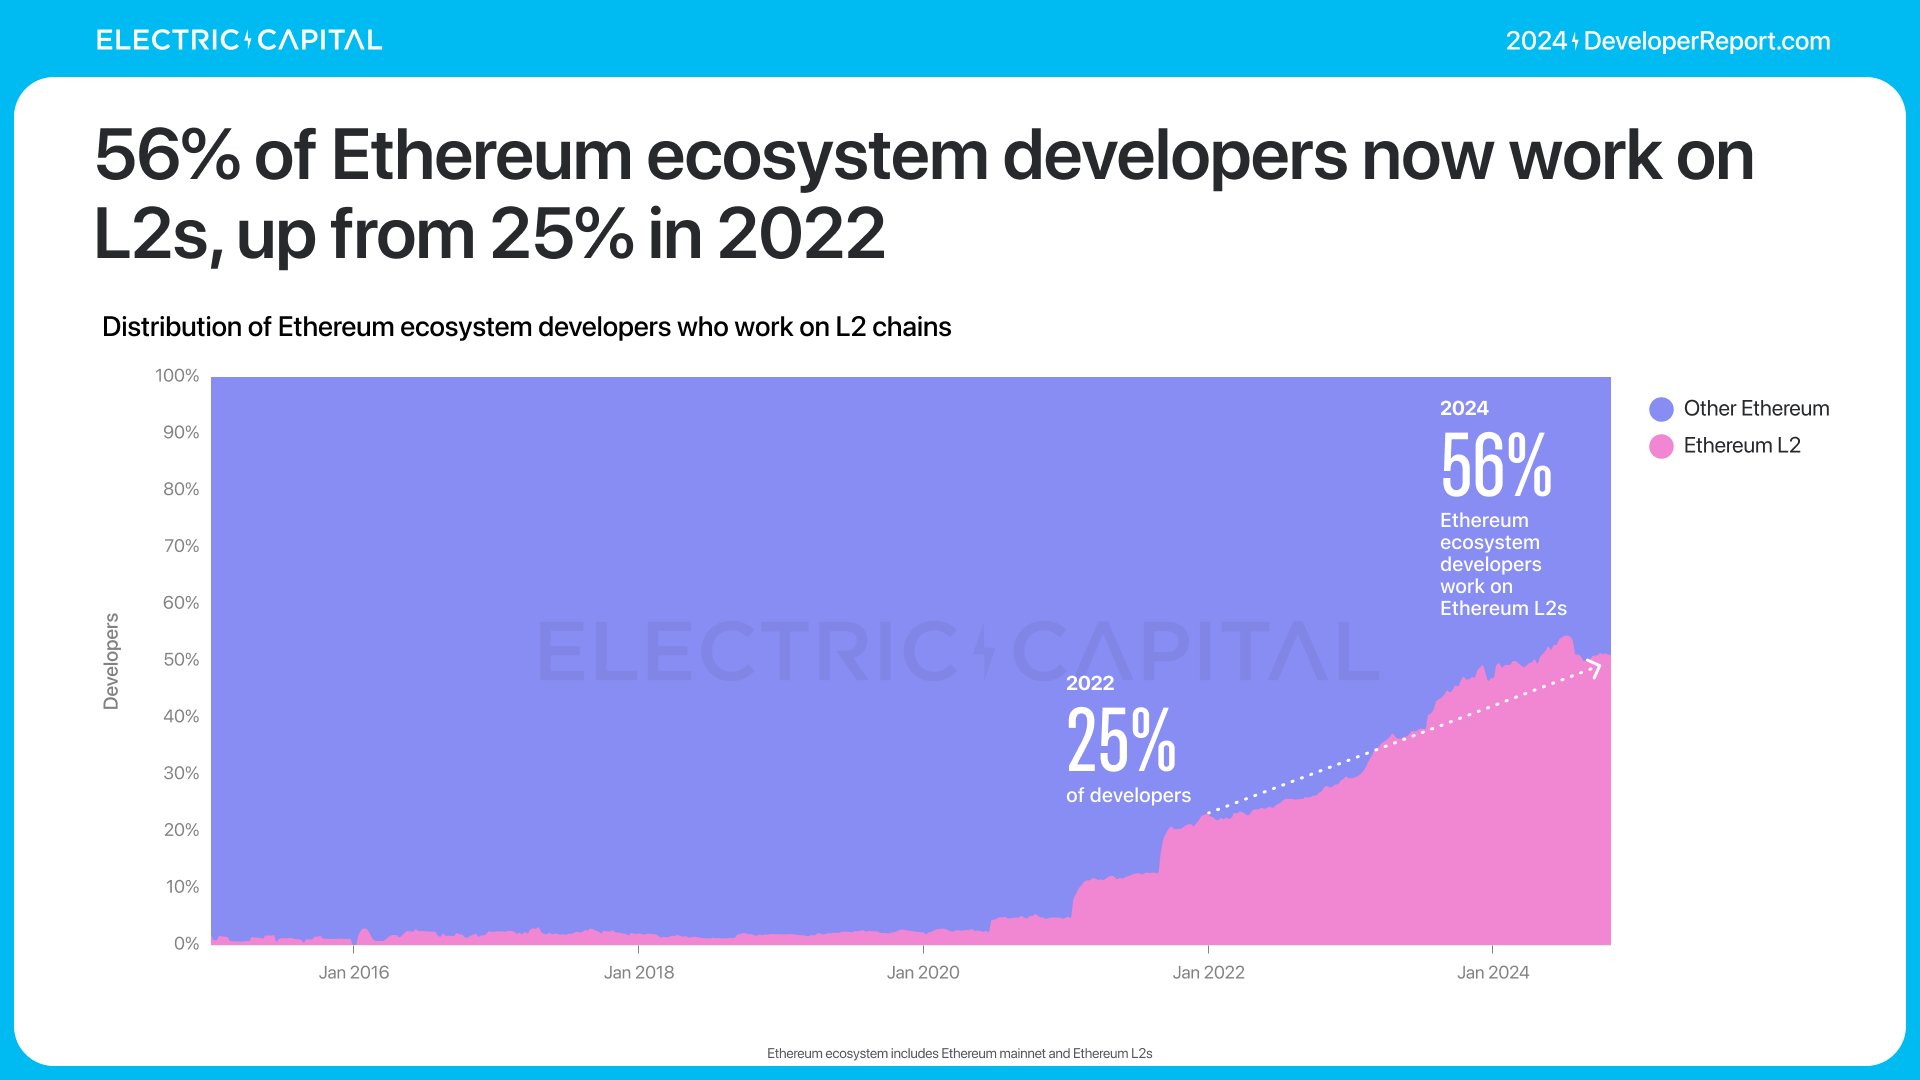
Now, over half of Ethereum developers work on Ethereum L2s, compared to 25% in 2022.
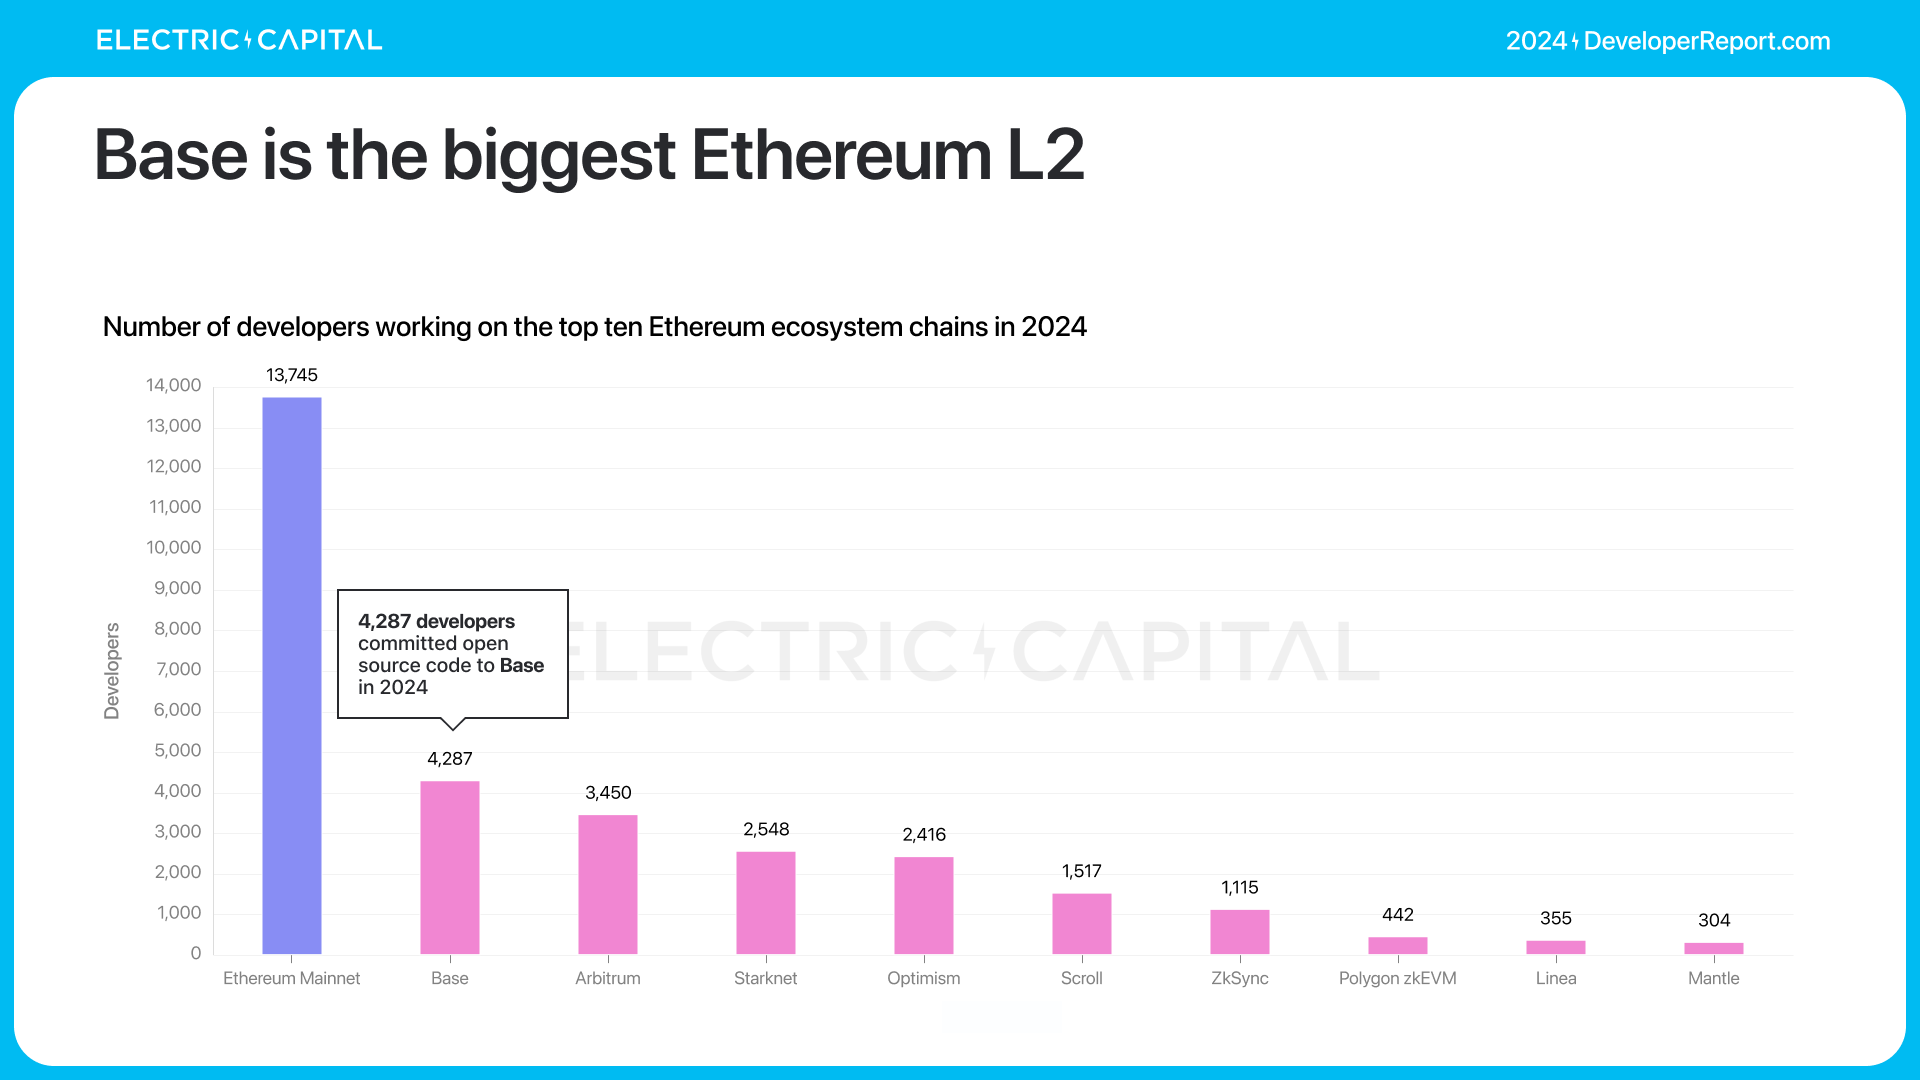
Ethereum L2s have seen significant developer growth over the past four years. The total number of monthly active developers on Ethereum L2s is 3,592, growing at an average of 67% annually since Arbitrum launched in 2021.
Base is the largest Ethereum L2.

Arbitrum, Starknet, and Optimism each had over 2,000 developers in 2024.
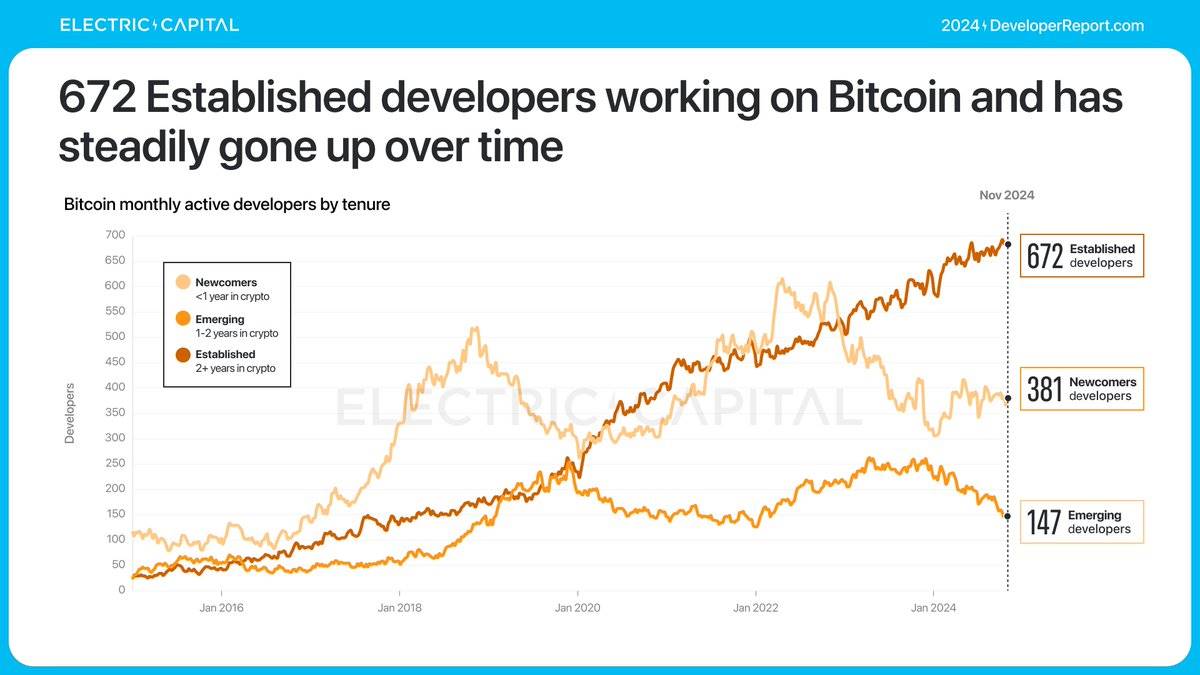
In 2024, Bitcoin had 1,200 monthly active developers, remaining stable. The number of experienced Bitcoin developers (working on Bitcoin for over two years) continues to grow steadily. Currently, monthly active experienced Bitcoin developers reached a record high of 672.
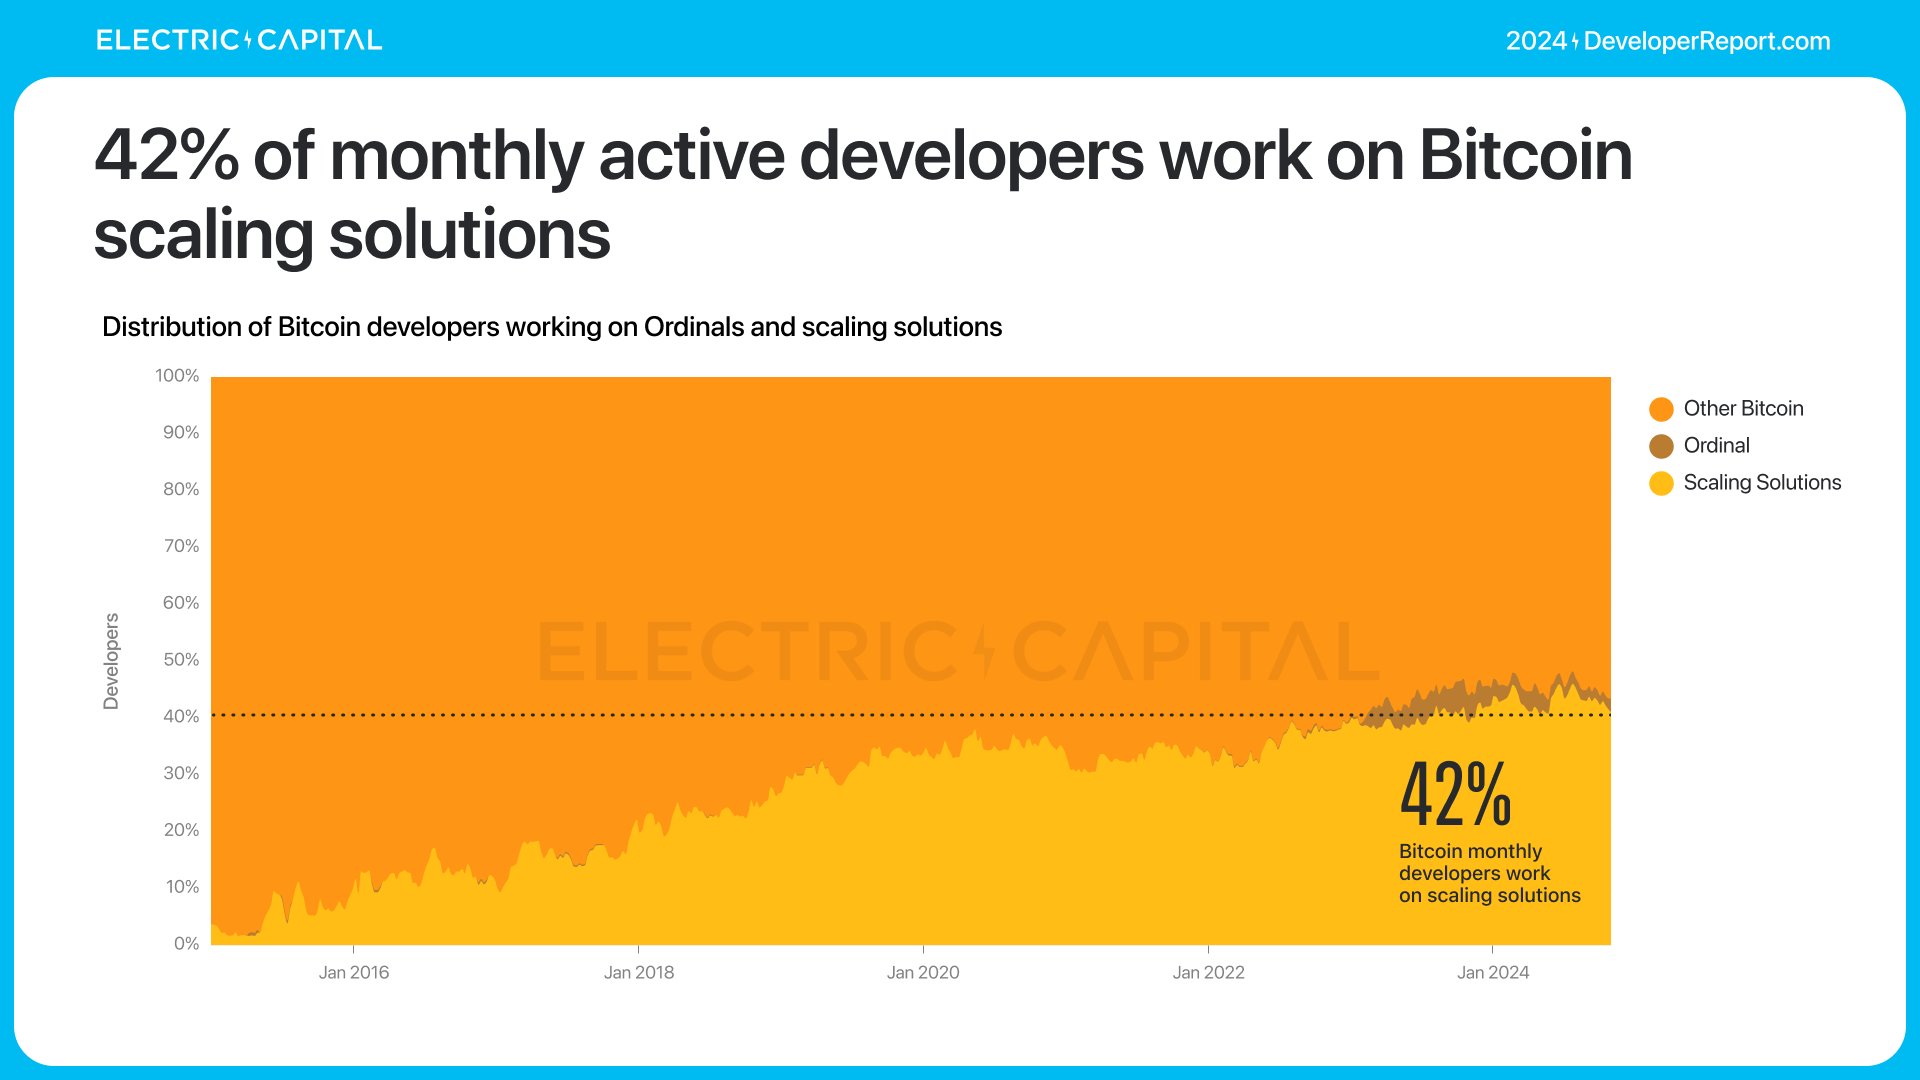
42% of Bitcoin developers—nearly half—are working on Bitcoin scaling solutions.
Zero-knowledge (ZK) proofs are a research-driven, developer-centric field. How is it evolving?
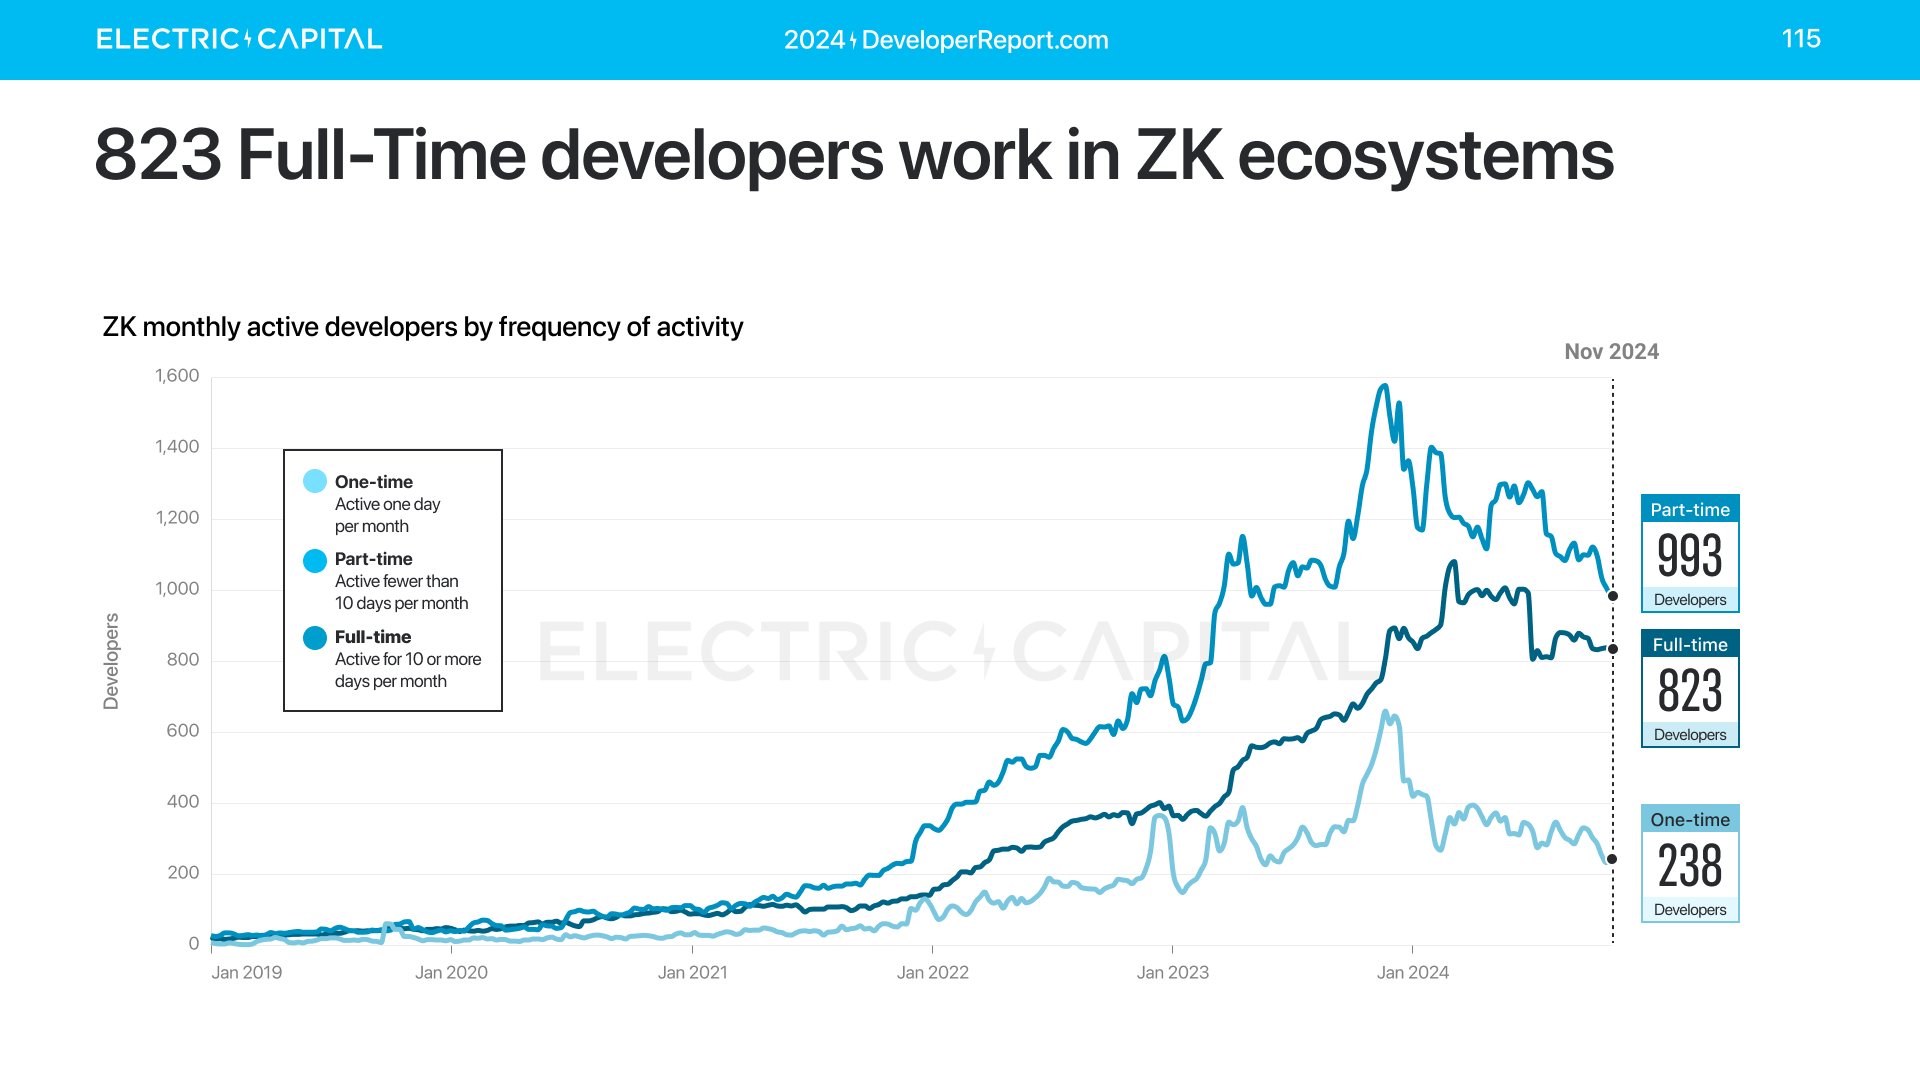
Over 2,000 monthly active developers work in ZK ecosystems, including 823 full-time developers who contribute code for more than 10 days per month.

ZK on-chain deployments have grown from 40 in 2020 to 639 in 2024.
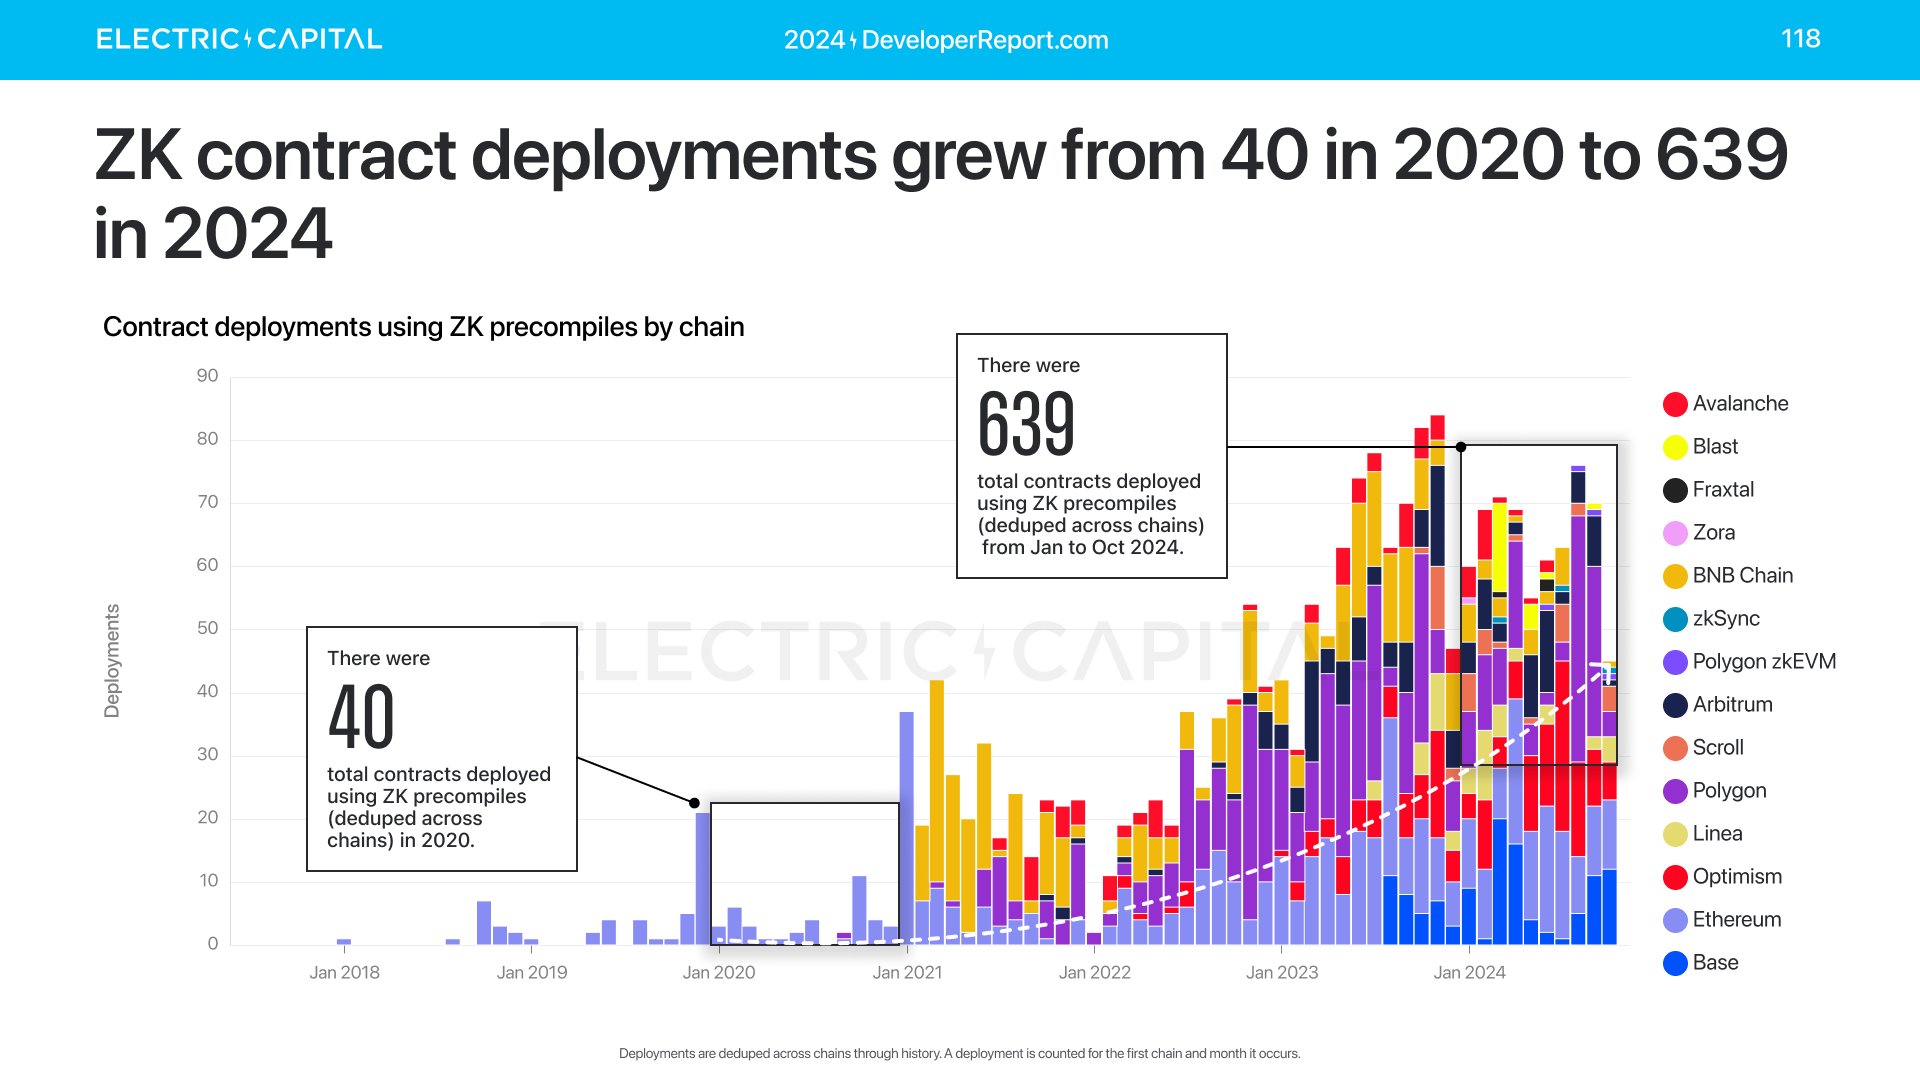
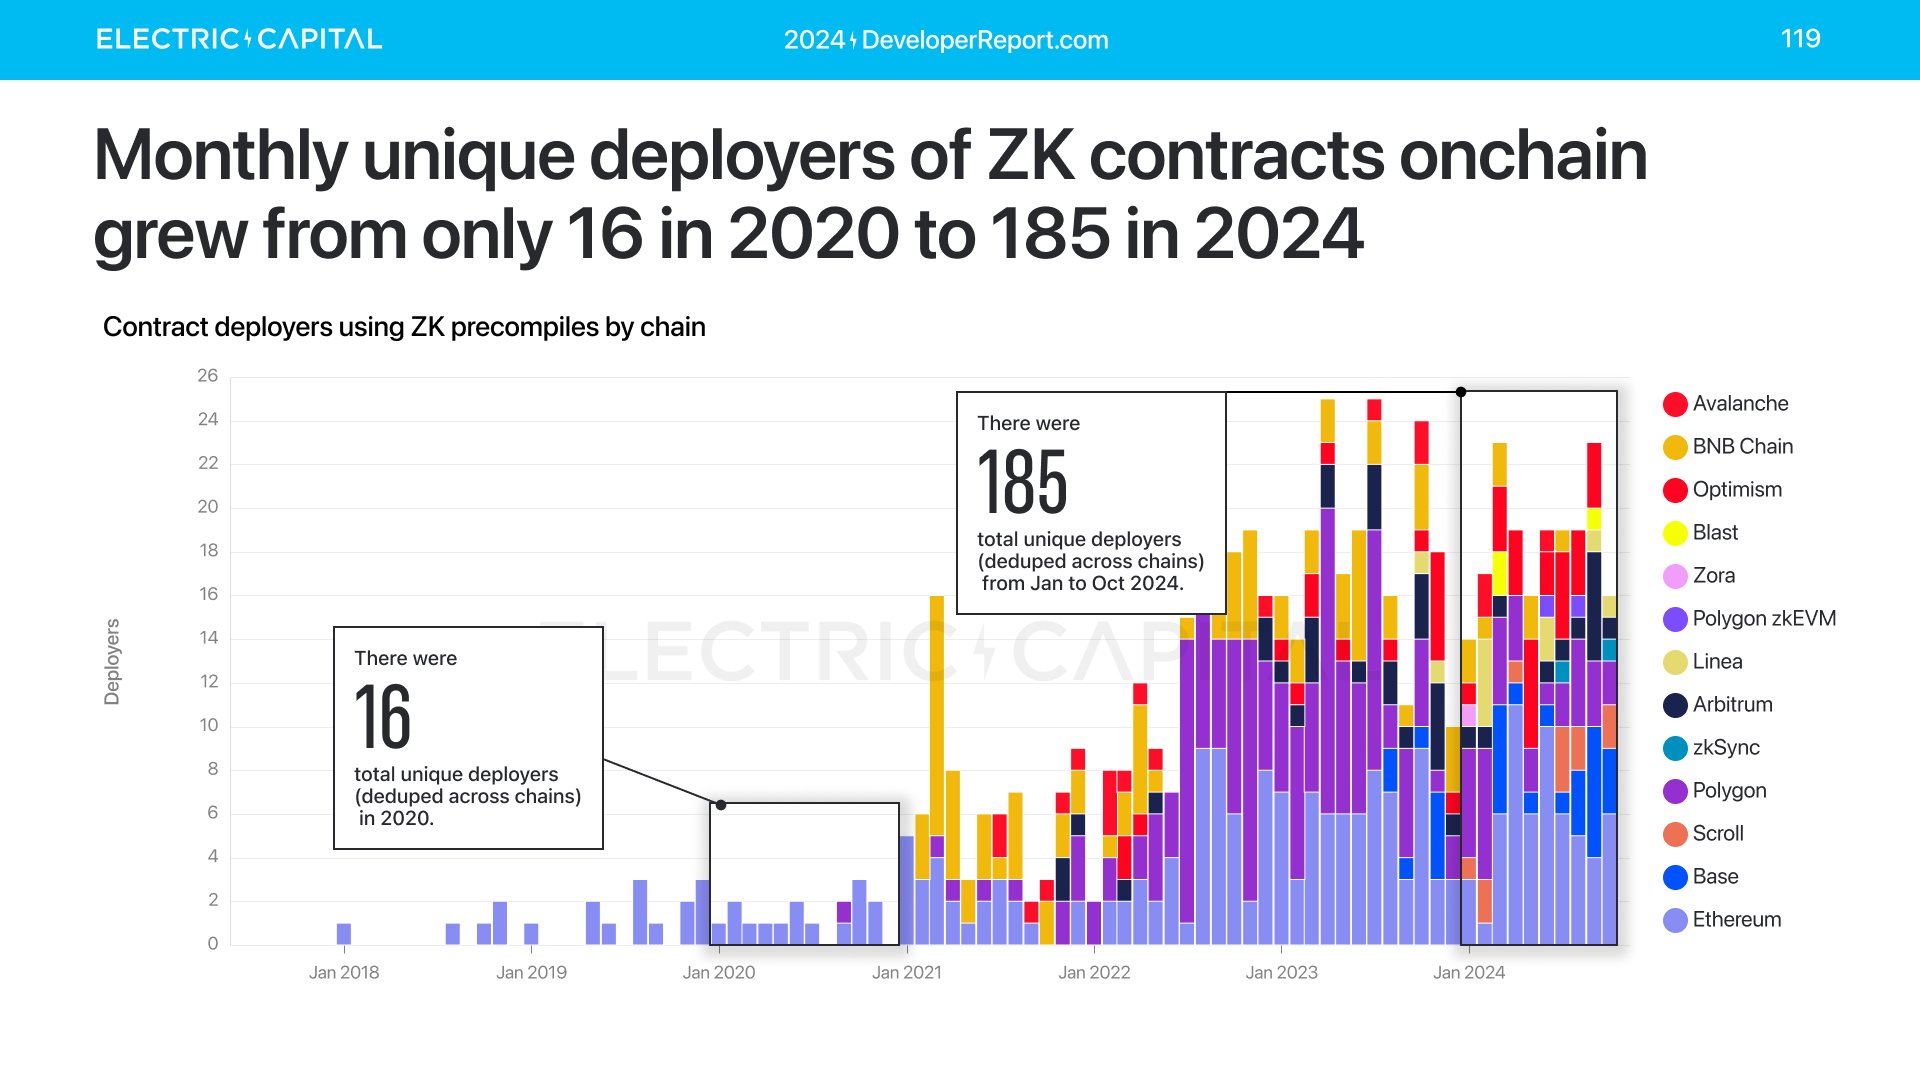
While numbers remain modest, they show clear growth. The number of deployers has also increased.
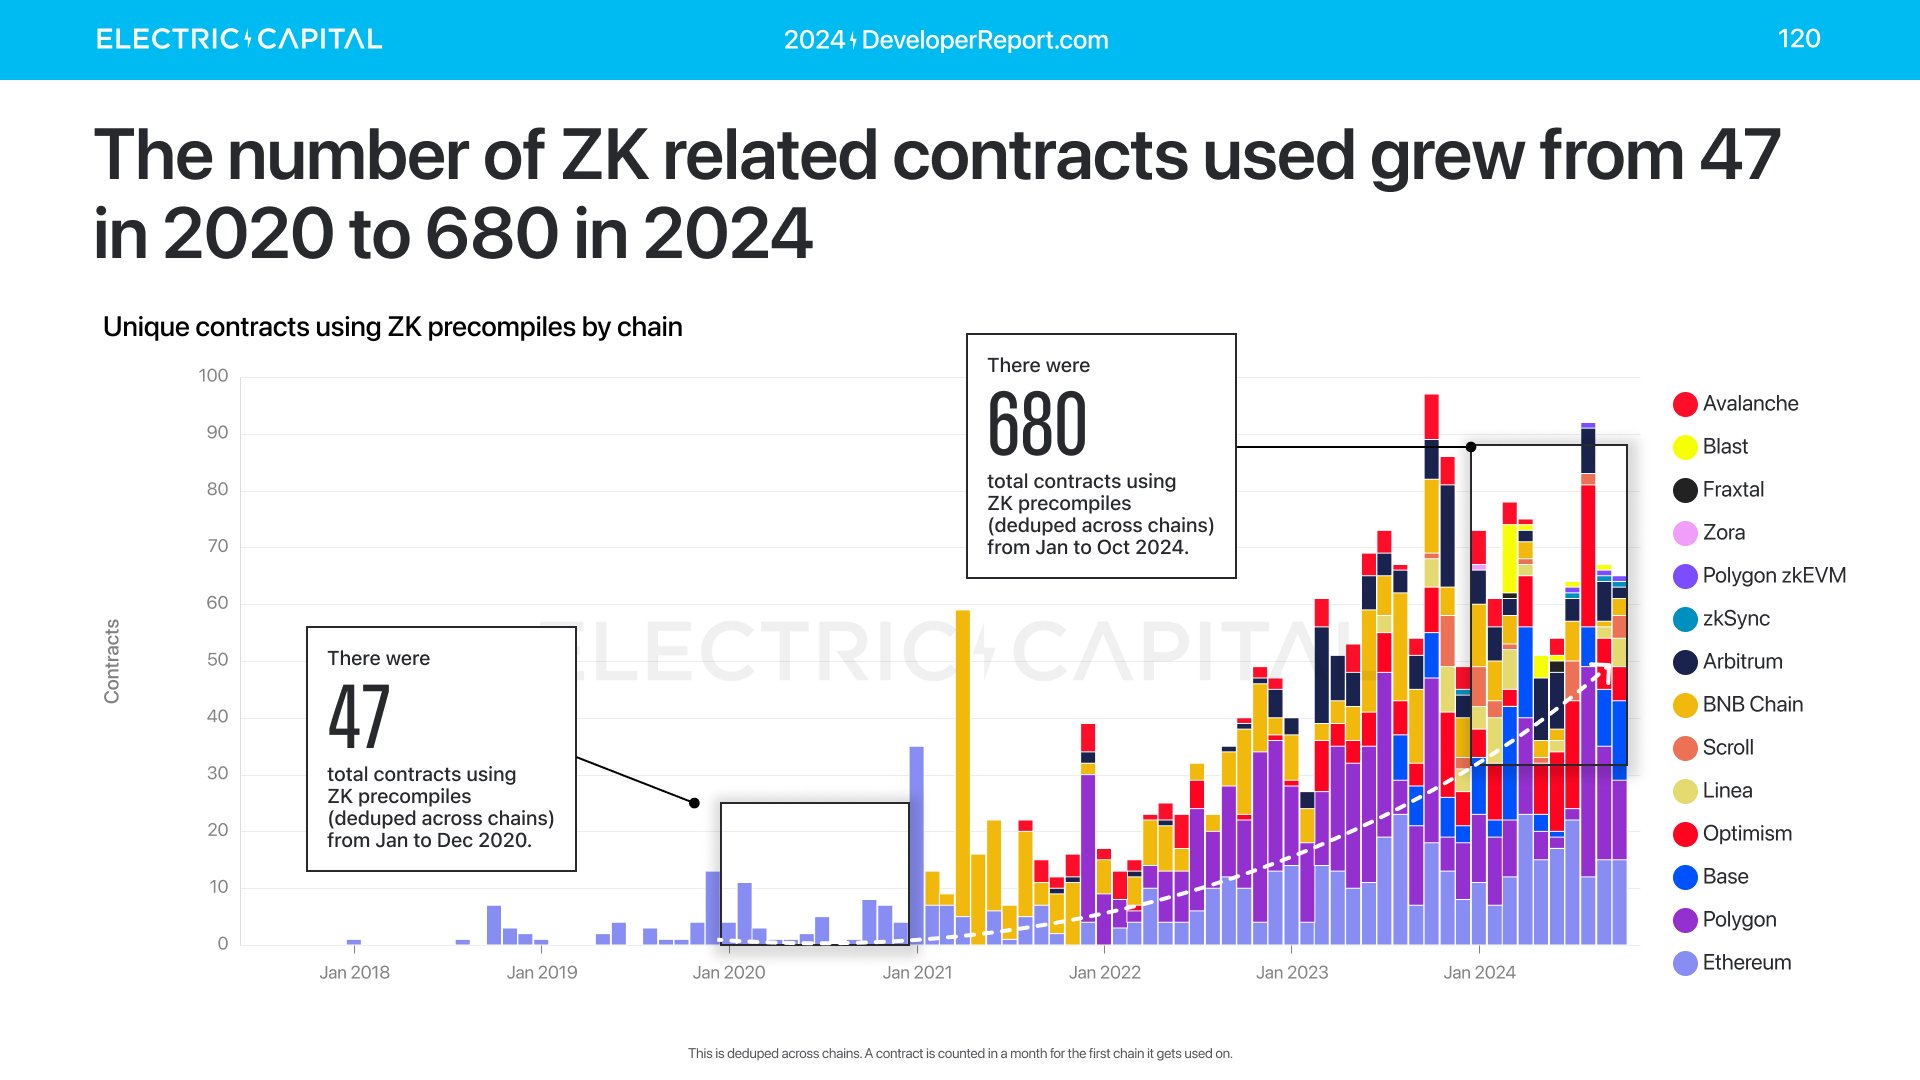
ZK is also gaining usage—contracts using ZK precompiles grew from 47 in 2020 to 680 this year.
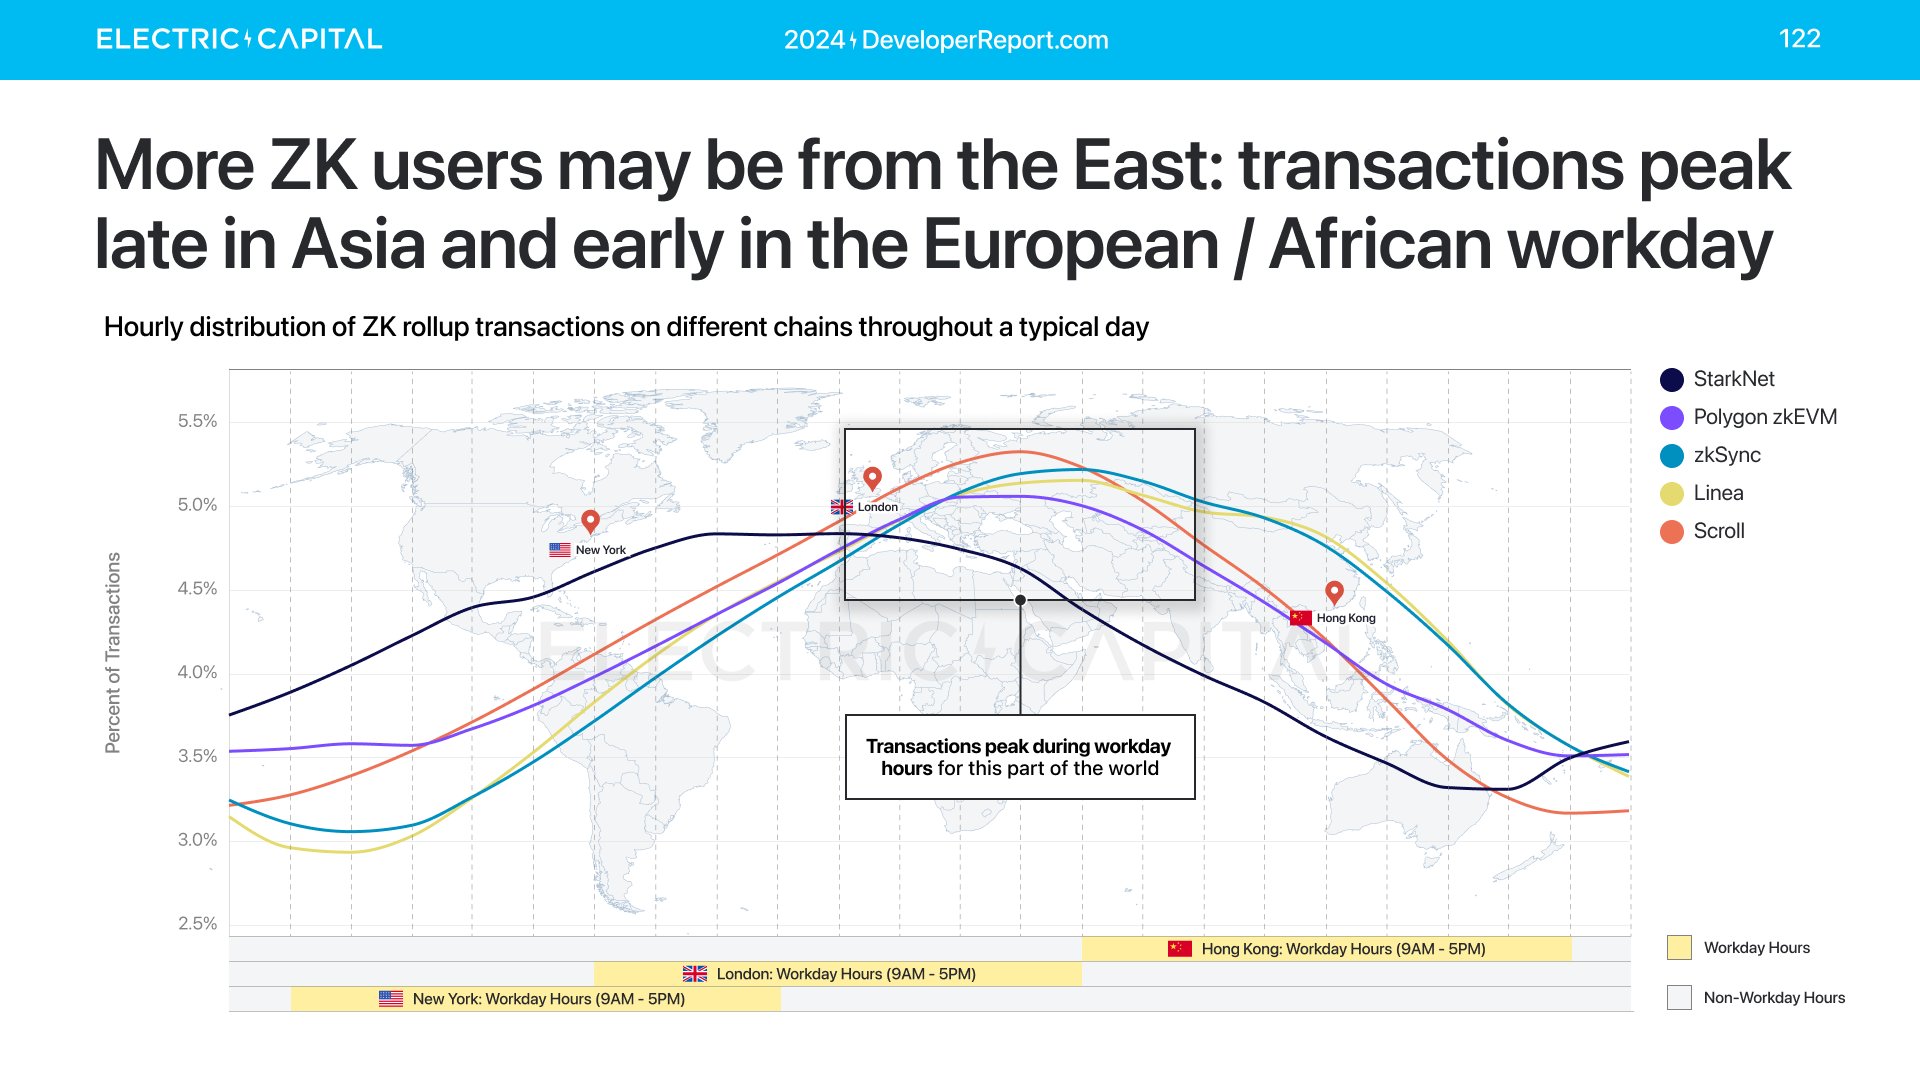
When are ZK developers and users active?
ZK Rollup contract deployers are active during working hours in the Eastern Hemisphere, as are ZK users.
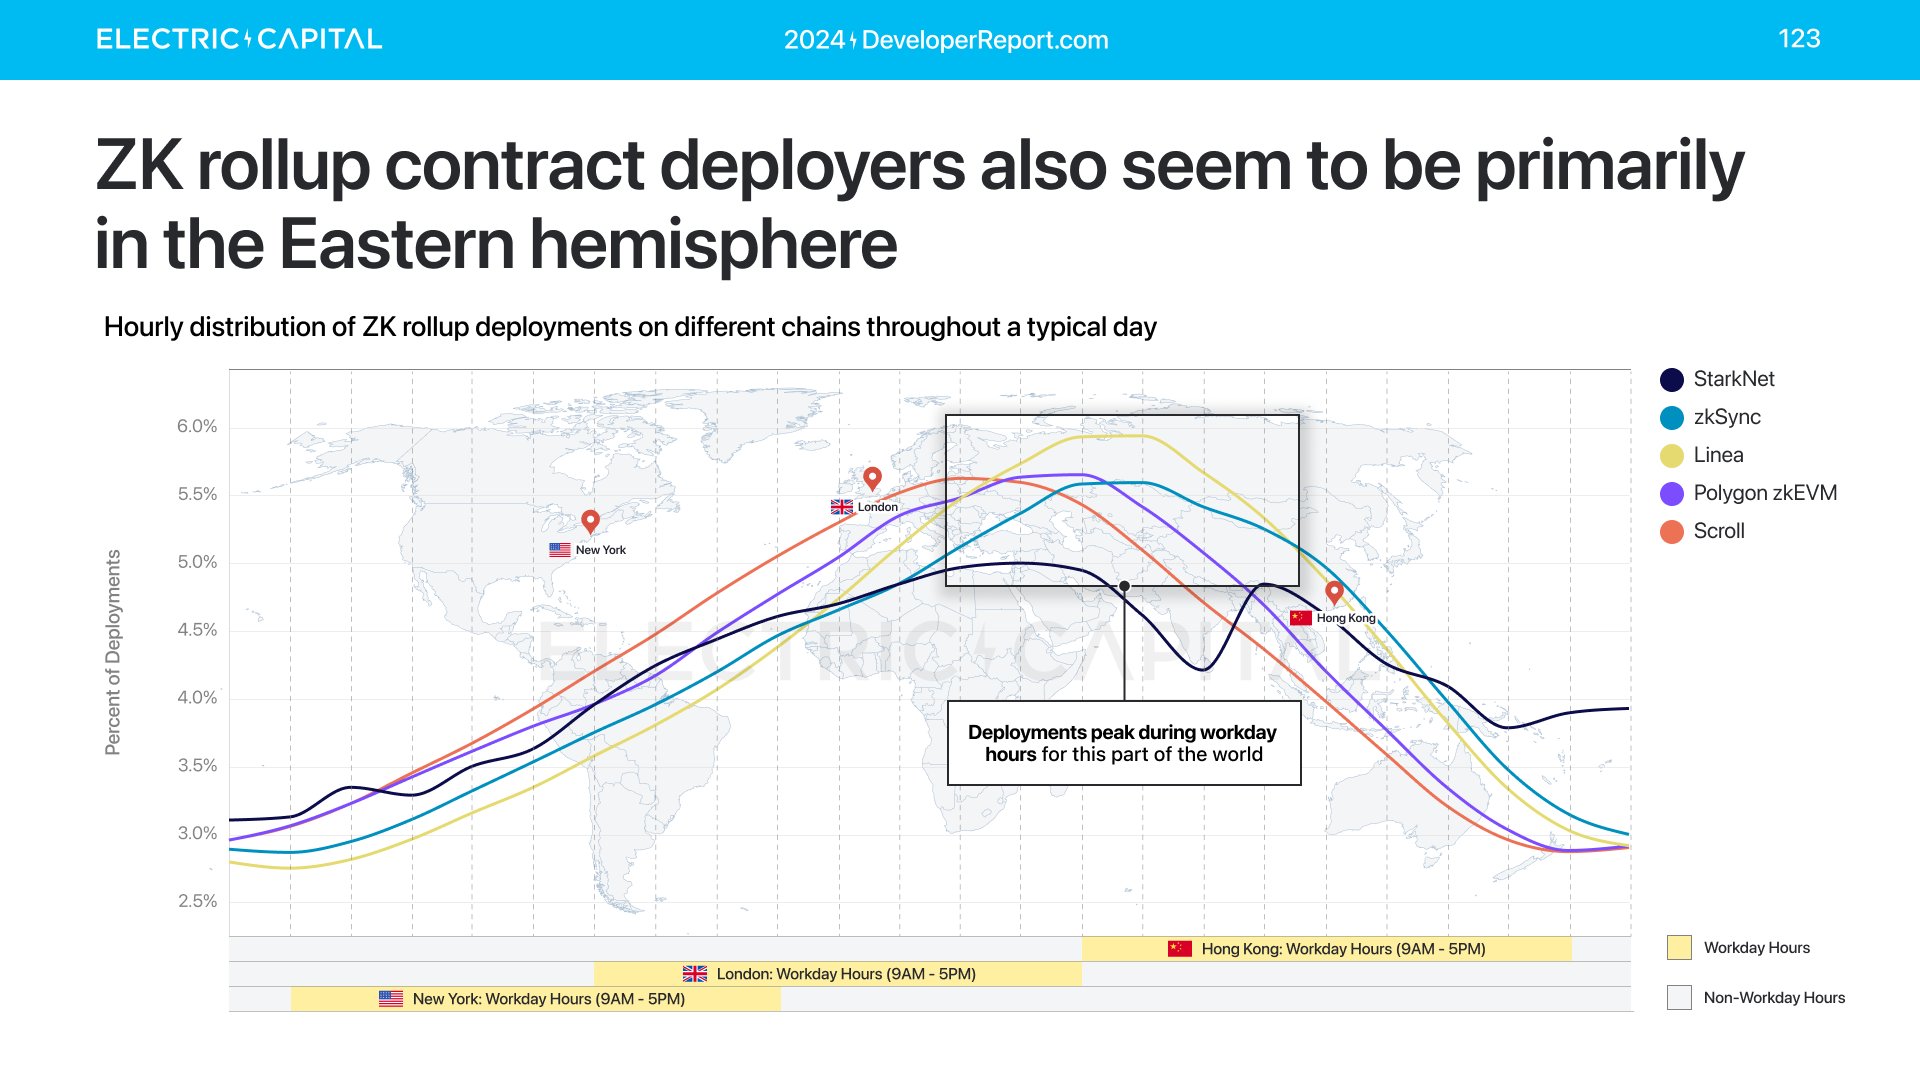
ZK users and deployers appear concentrated in the Eastern Hemisphere, particularly Eastern Europe, Africa, and Asia.
NFTs and DeFi are established use cases in crypto—most top smart contracts relate to NFTs or DeFi. How are these use cases evolving? Let’s start with NFTs.
Across all major active NFT chains (Bitcoin, Ethereum, Polygon, Solana, Zora, Base), NFT deployments grew over 3x year-over-year.
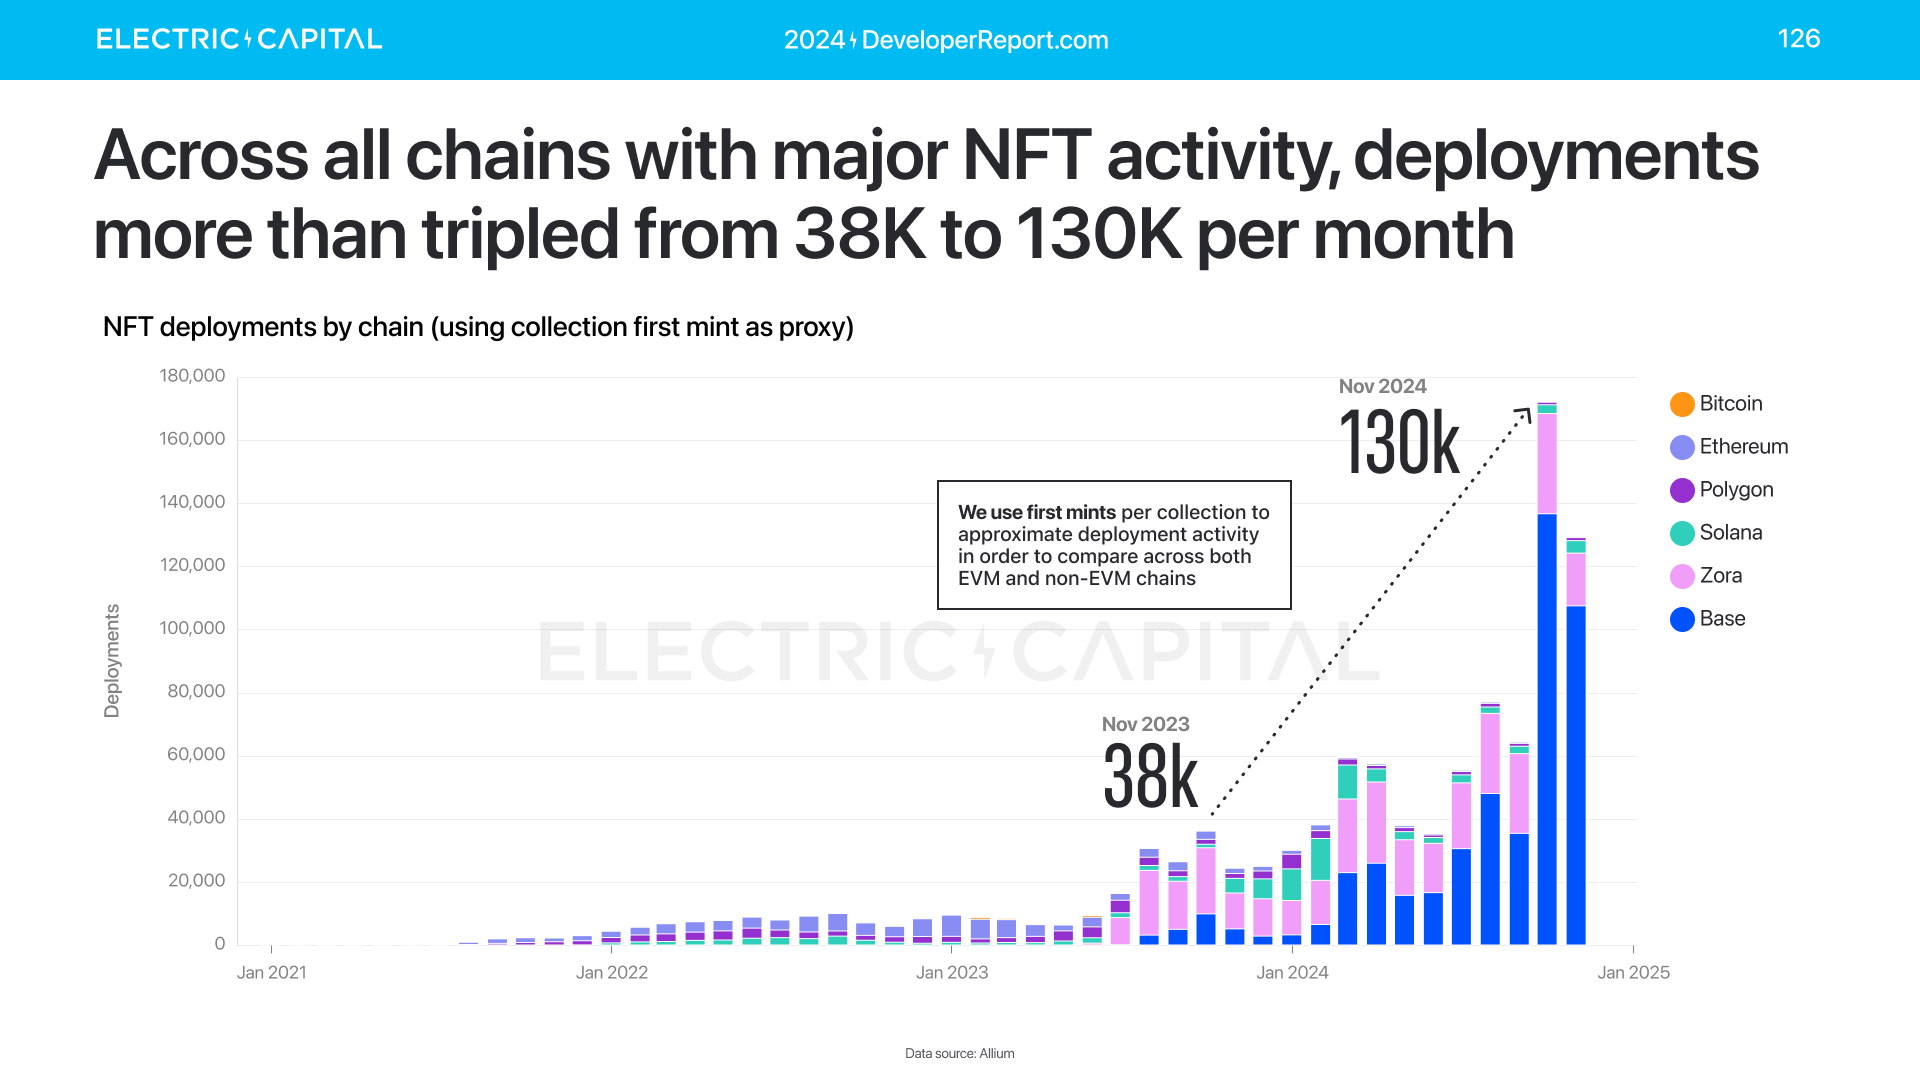
NFT deployments reached an all-time high. 87% of new deployments occurred on Base and Zora.

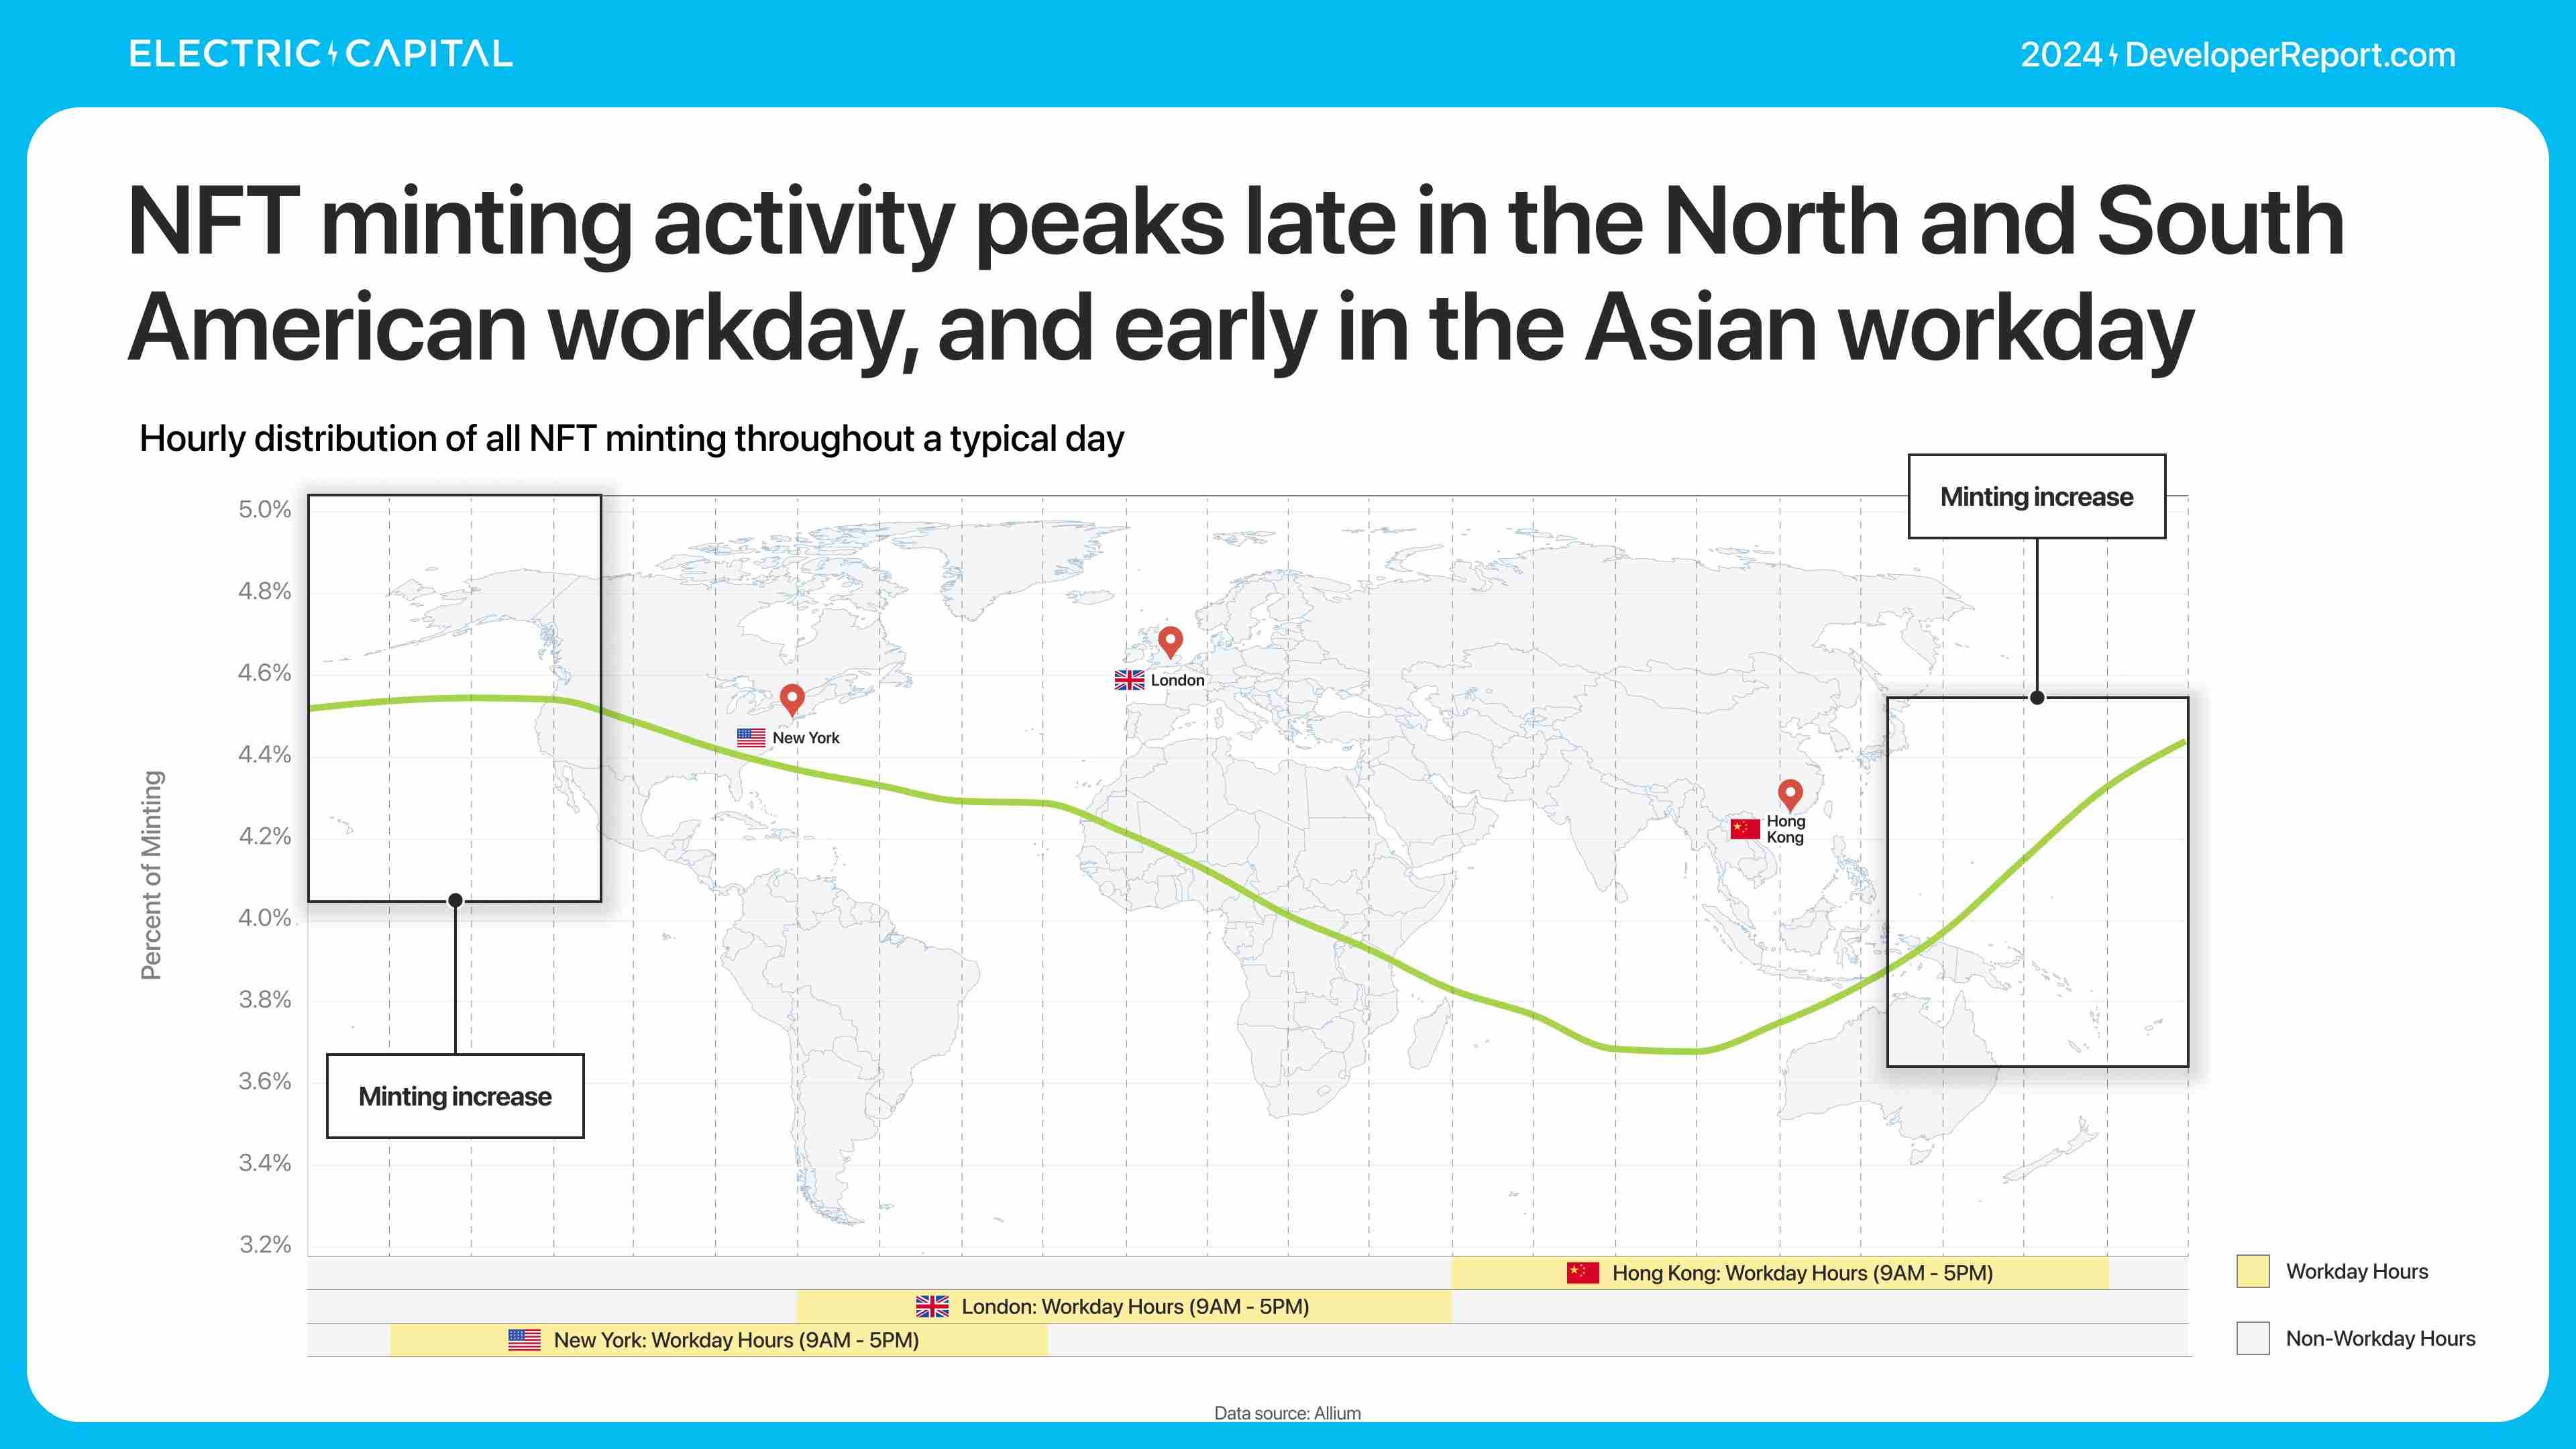
NFT activity has significantly shifted toward minting.
In 2024, NFT minting hit an all-time high, with 97% occurring on Base.

Solana captured 57% of minting wallets and 64% of minting transactions.
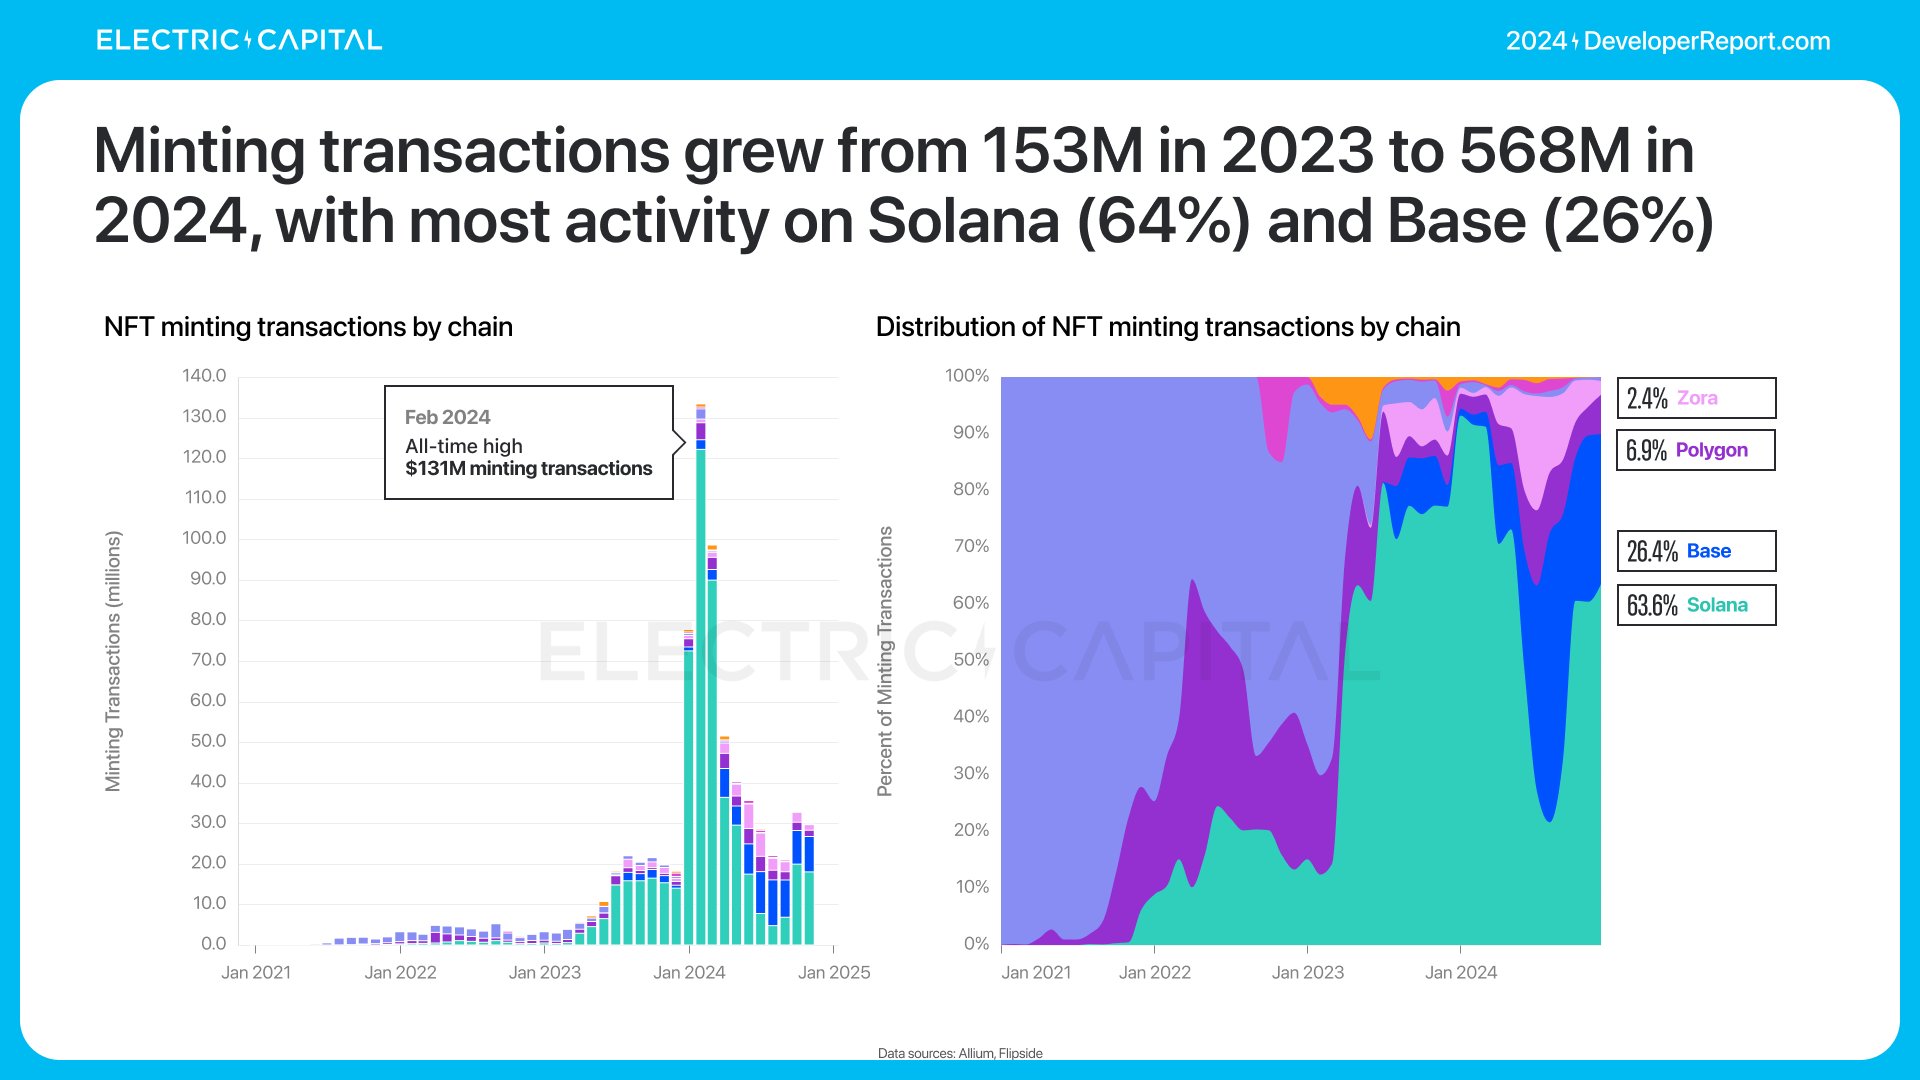
The increase in minting activity is because NFTs in 2024 have expanded beyond art into broader use cases.

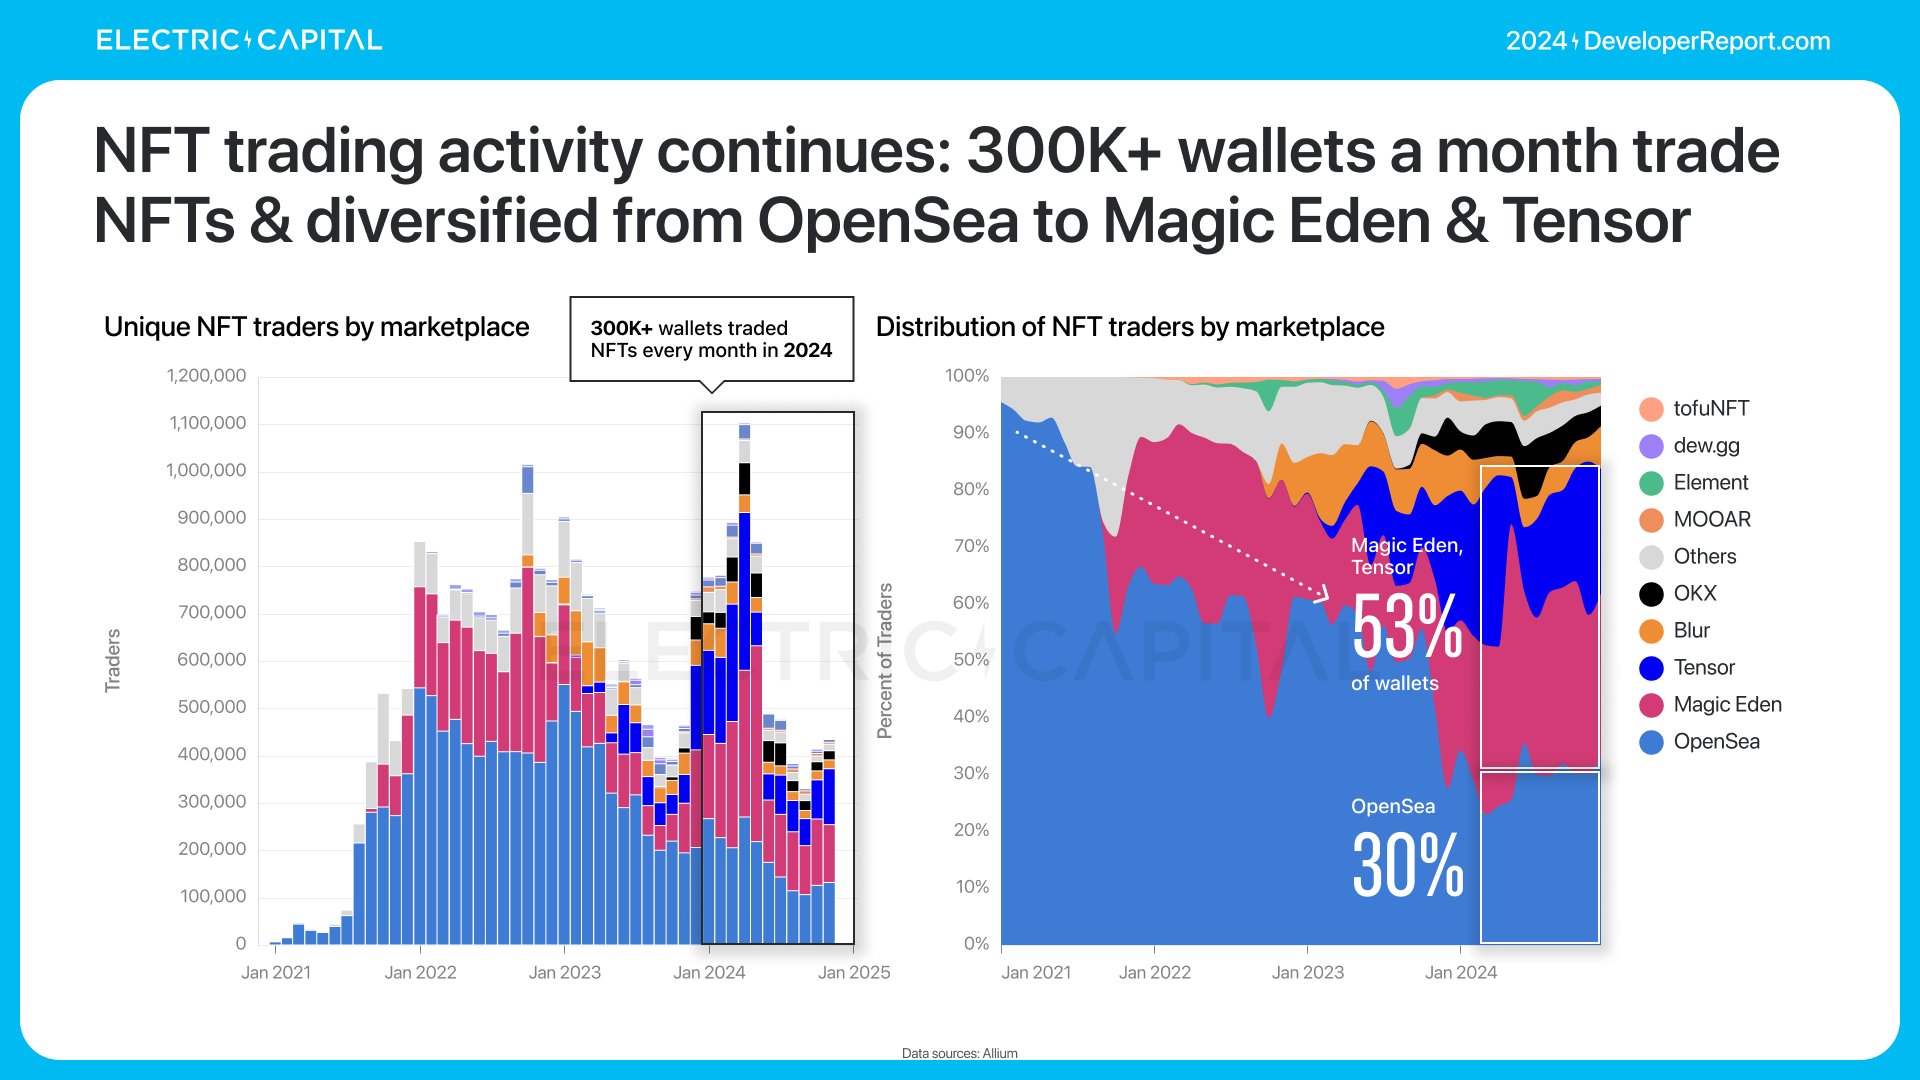
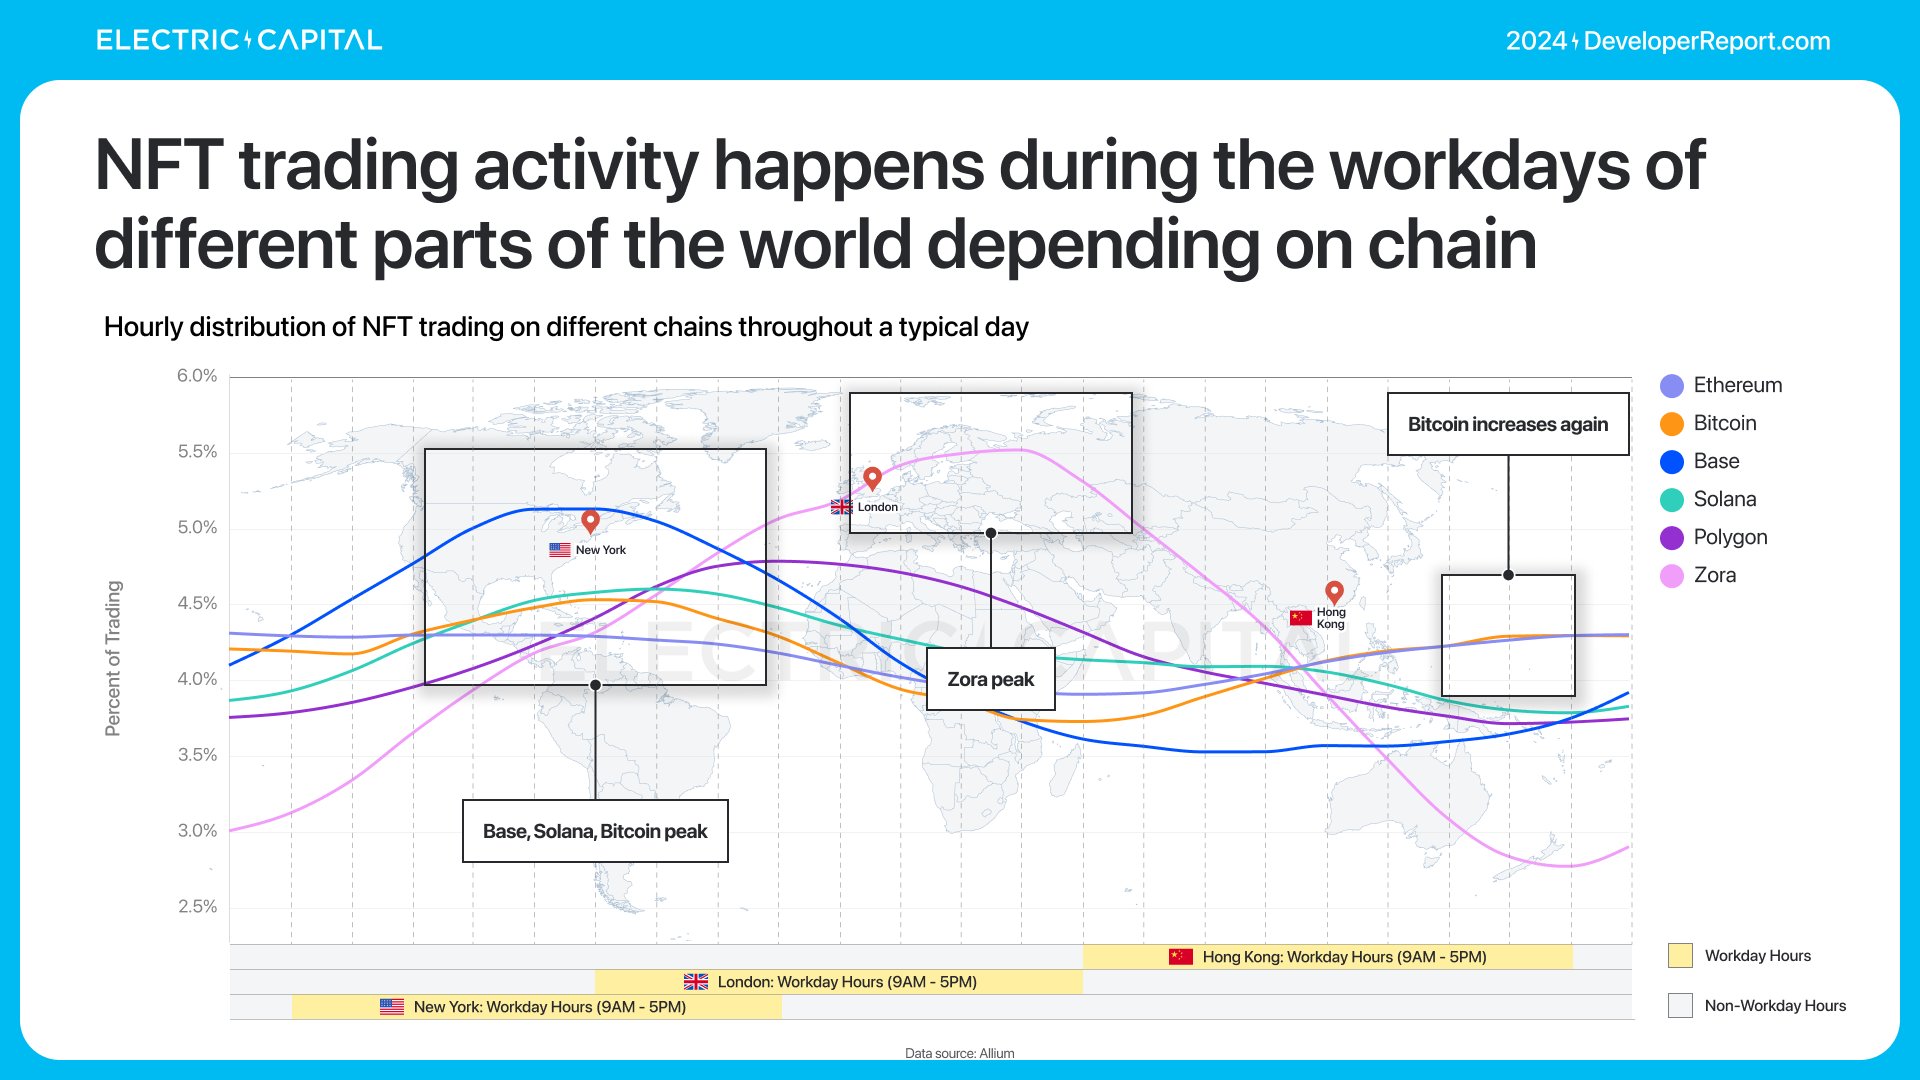
NFT trading remains an important foundational application and has expanded from OpenSea to platforms like Magic Eden and Tensor.
NFT minting and trading volumes peak in different regions—indicating distinct user bases.


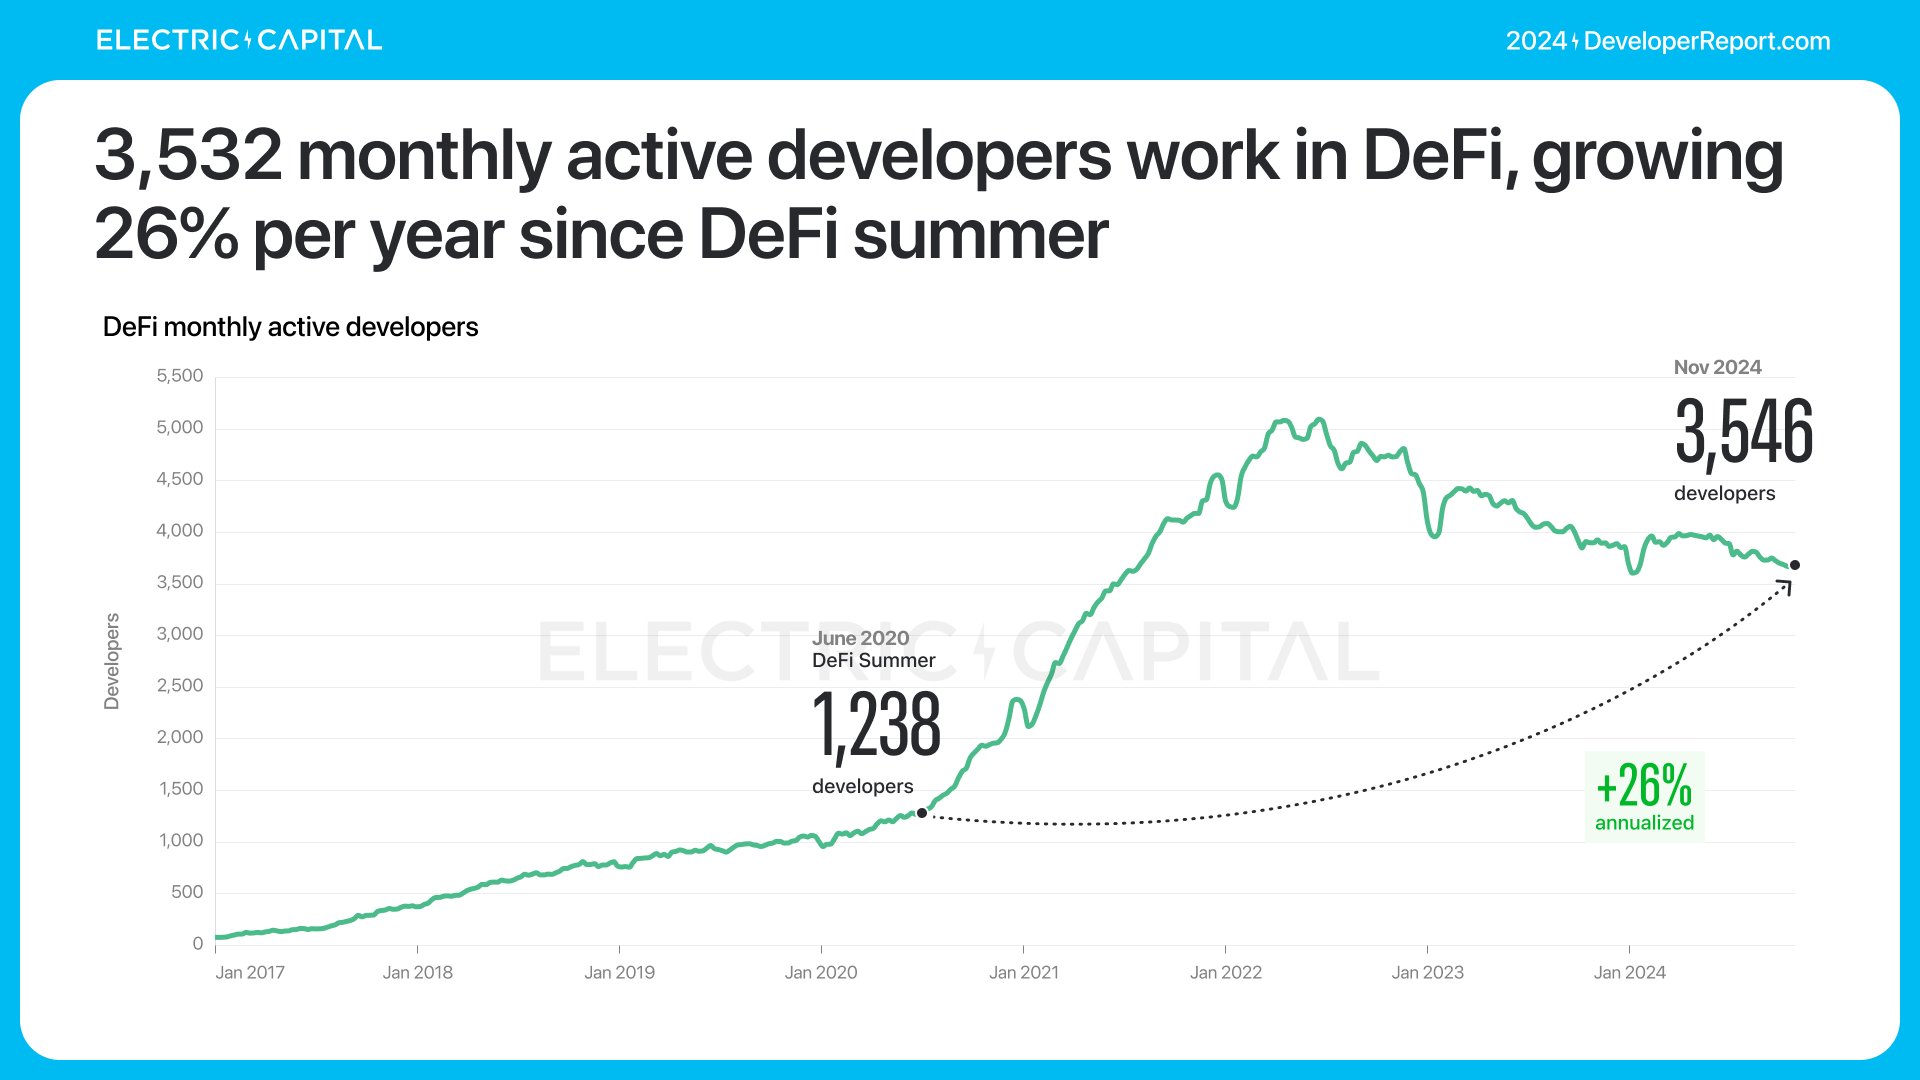
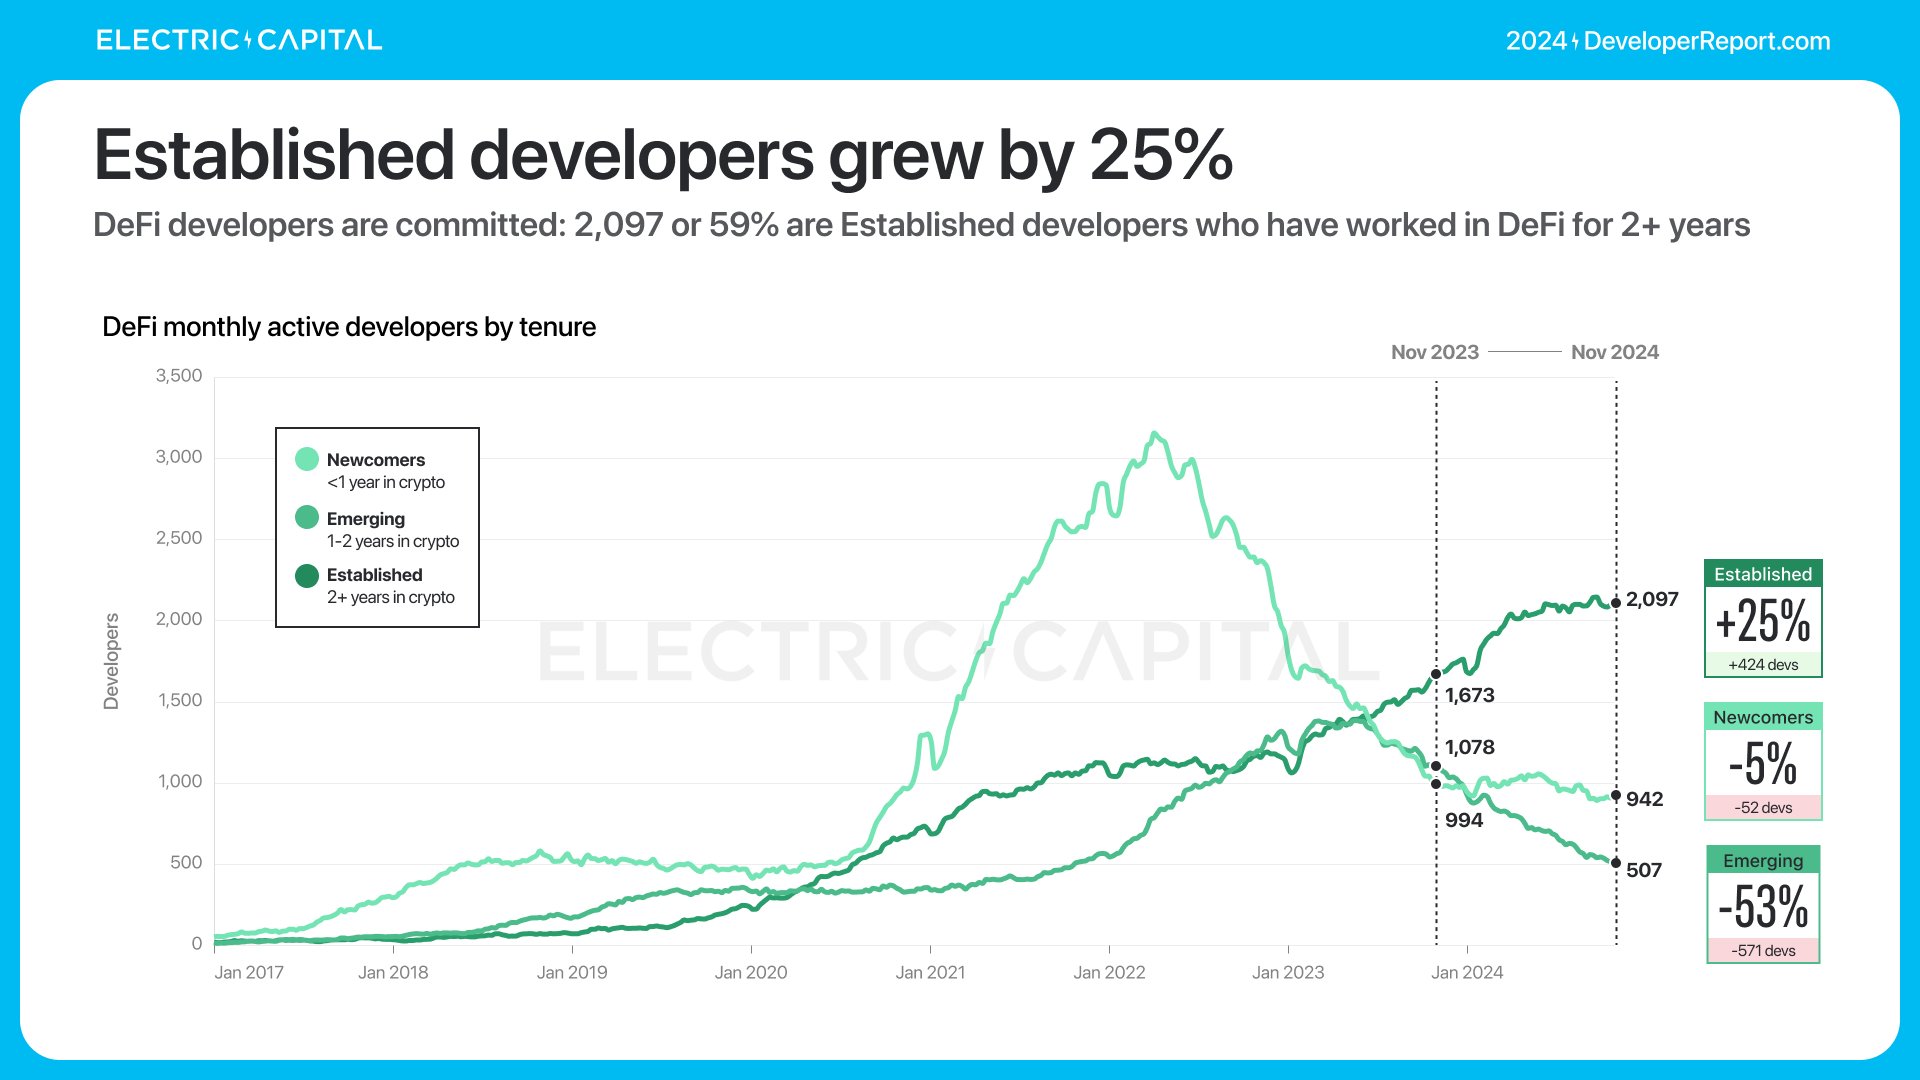
3,532 monthly active developers work on DeFi. DeFi developers are experienced—2,097 (59%) have worked on DeFi for over two years.
53% of DeFi developers work on Ethereum and its L2s.

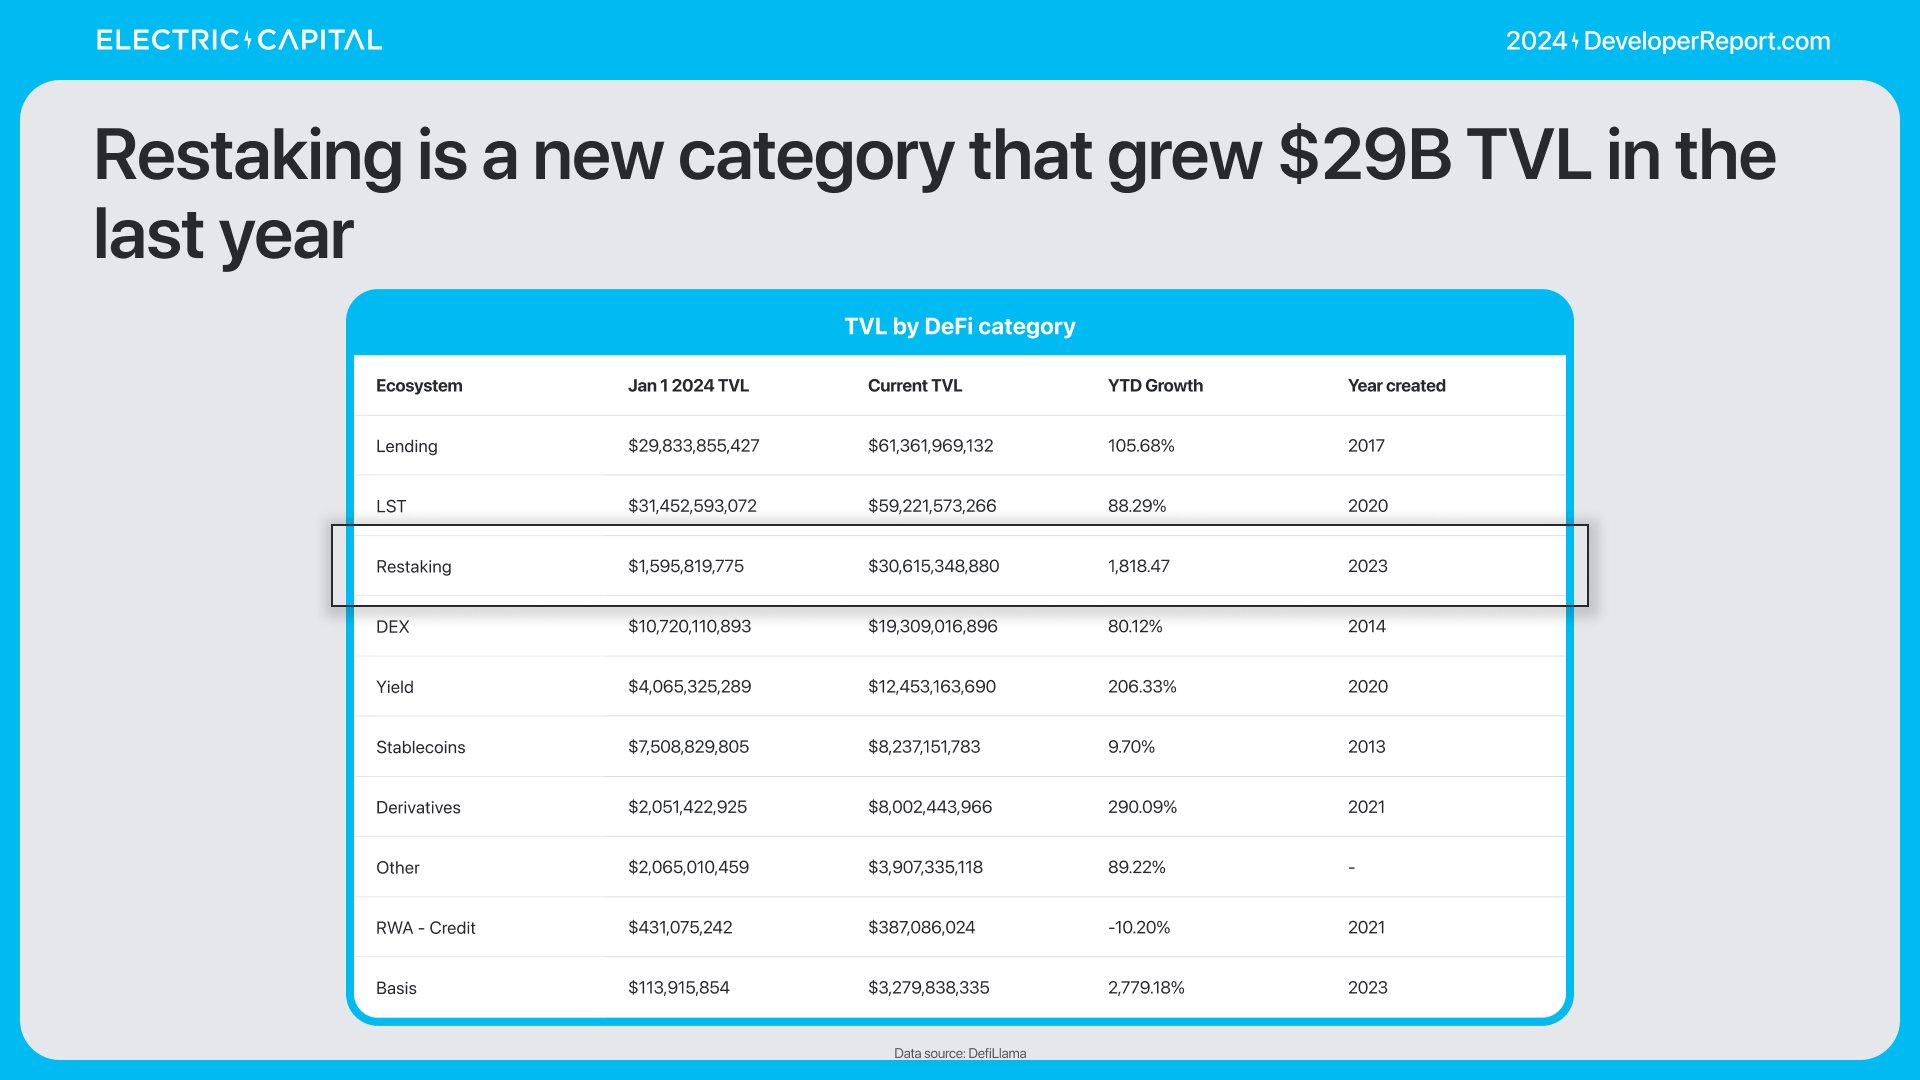
In 2024, DeFi’s total value locked (TVL) grew by 89%.
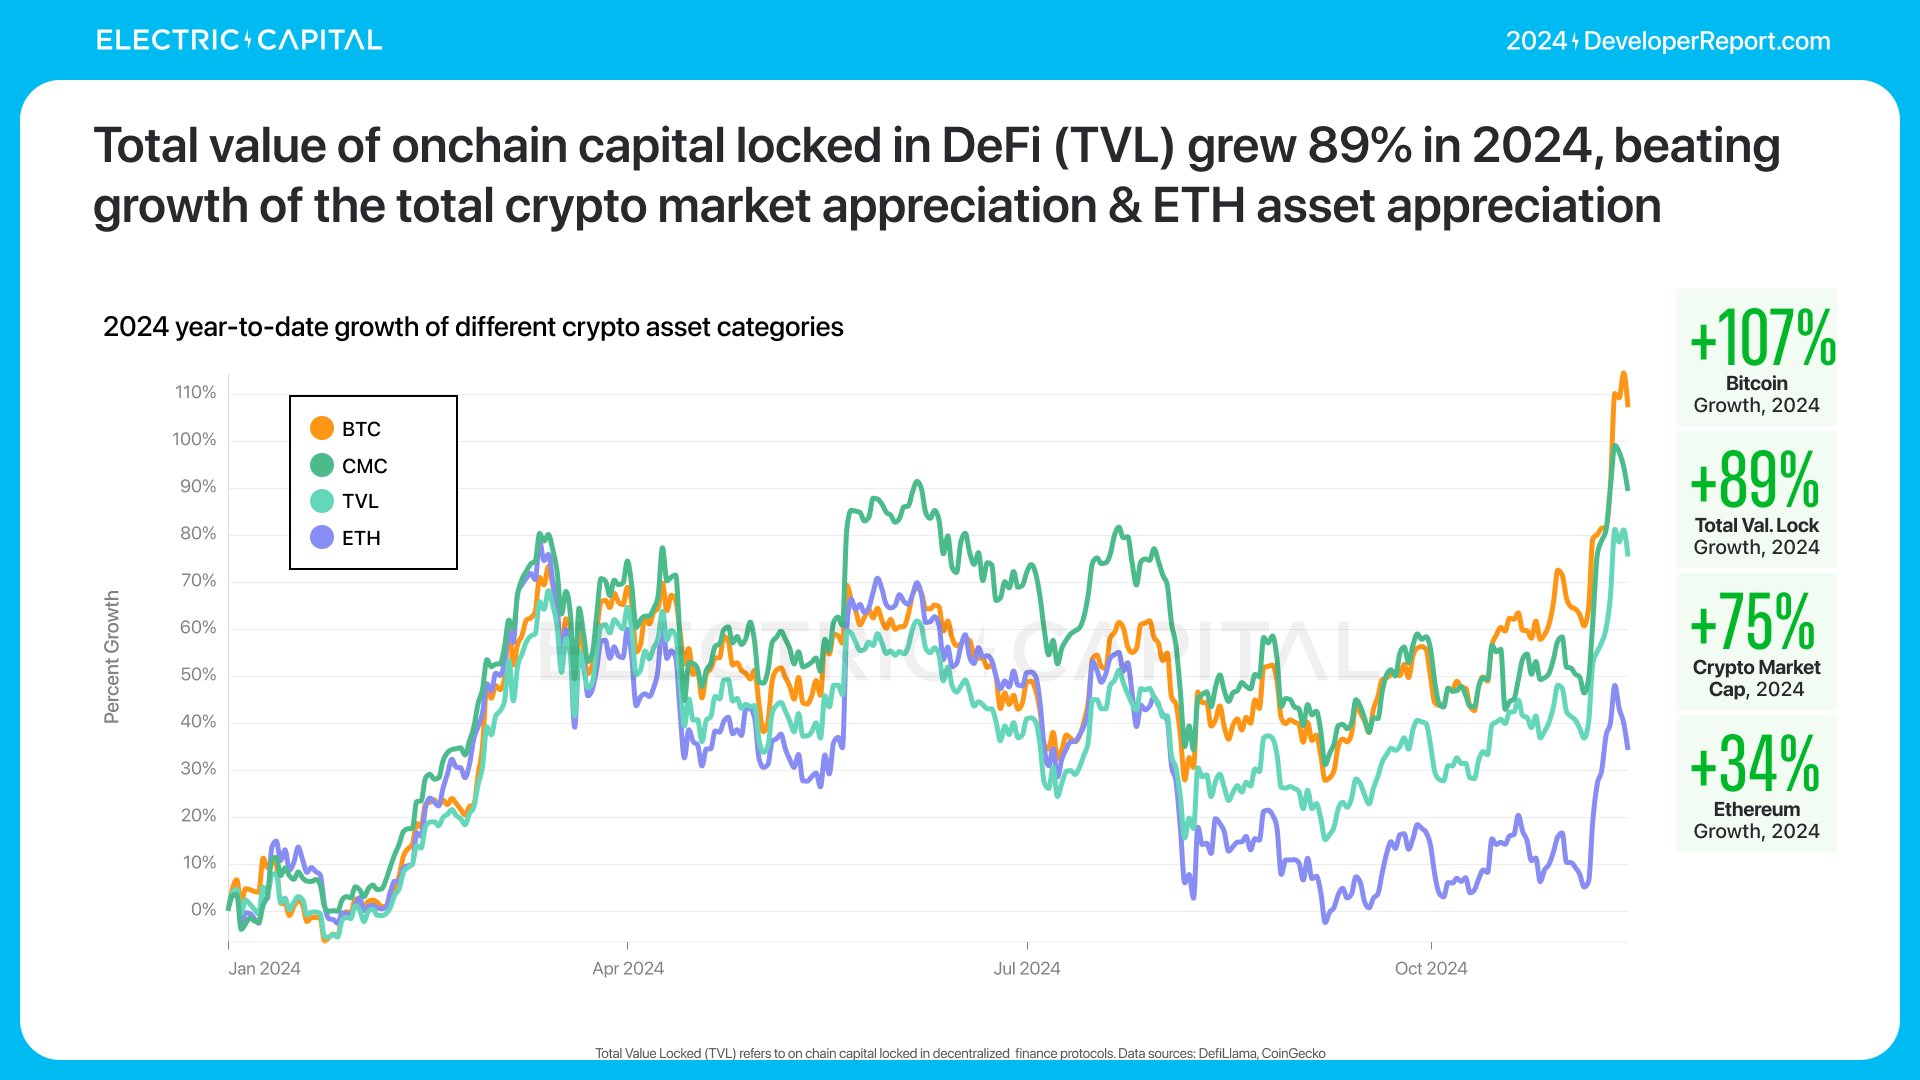
Ethereum dominates TVL, seven times larger than the second-largest chain.
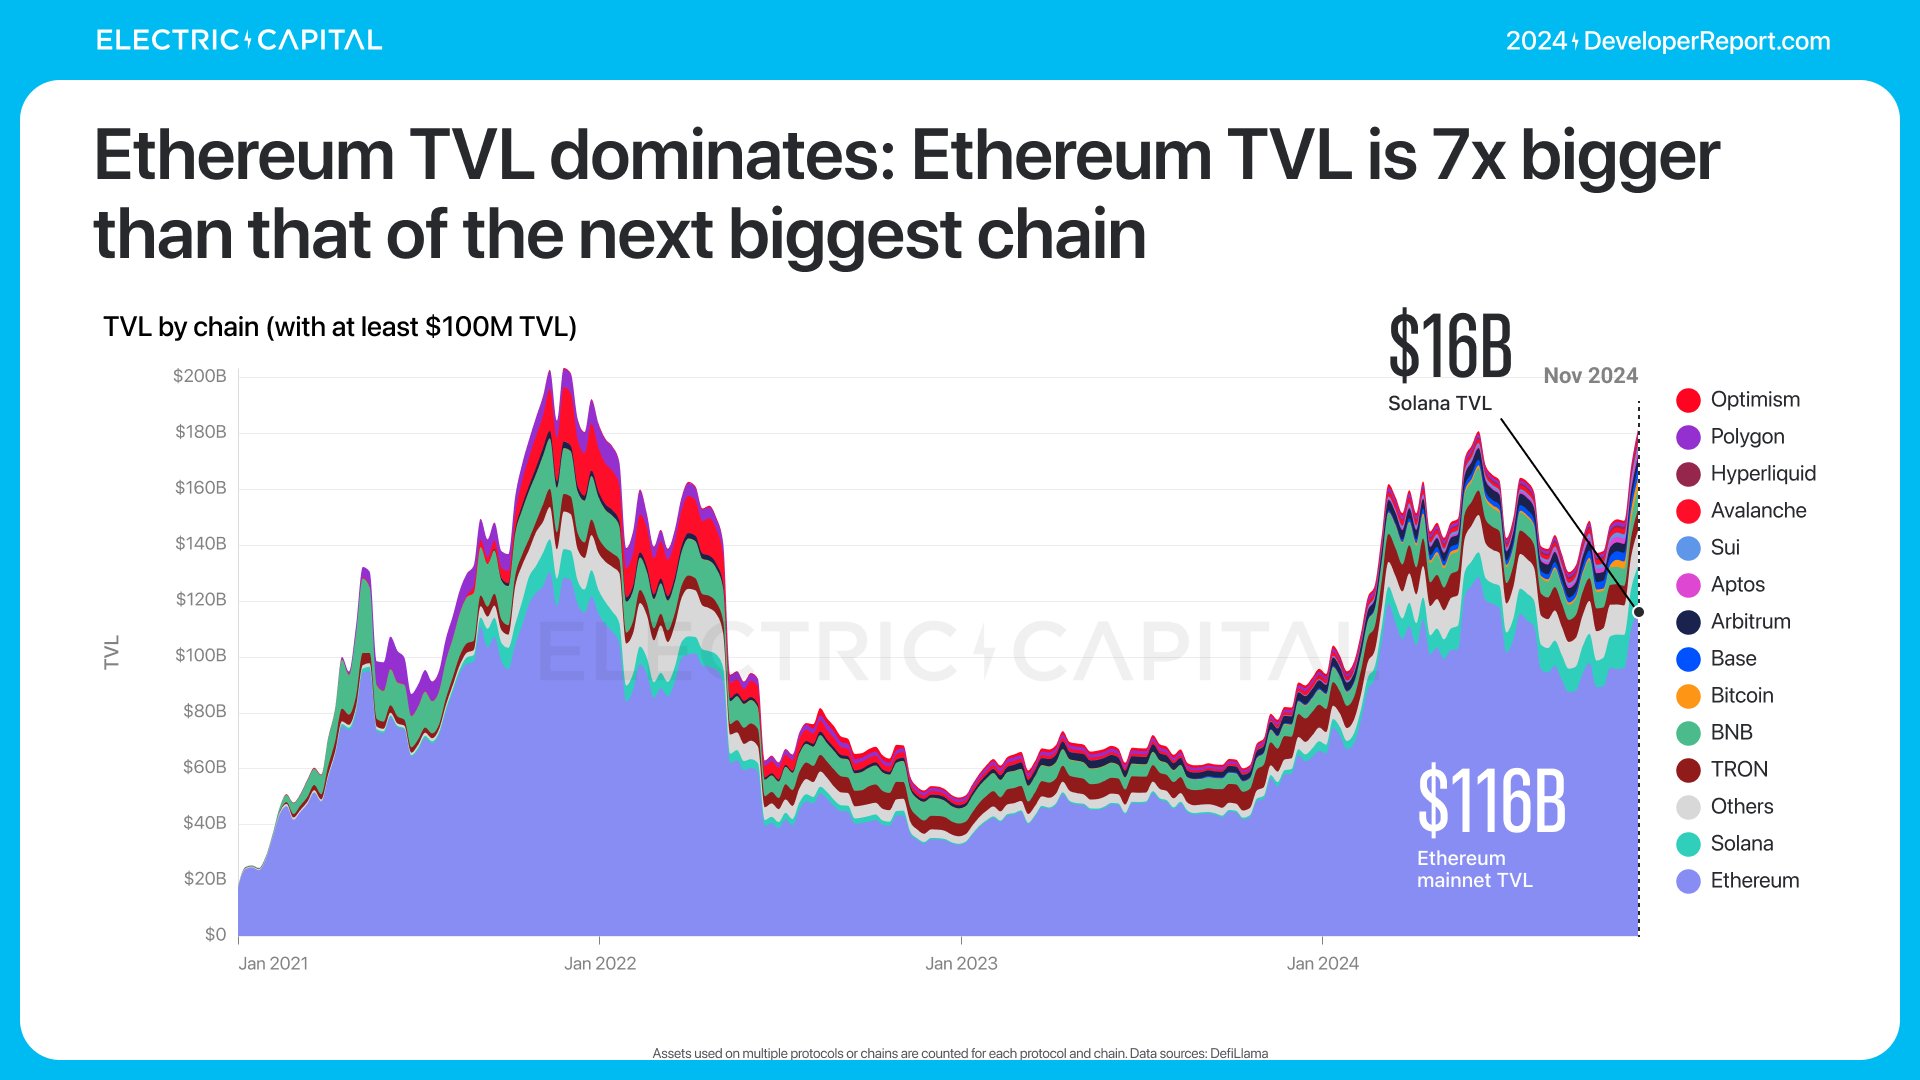
Most TVL remains concentrated on Ethereum.

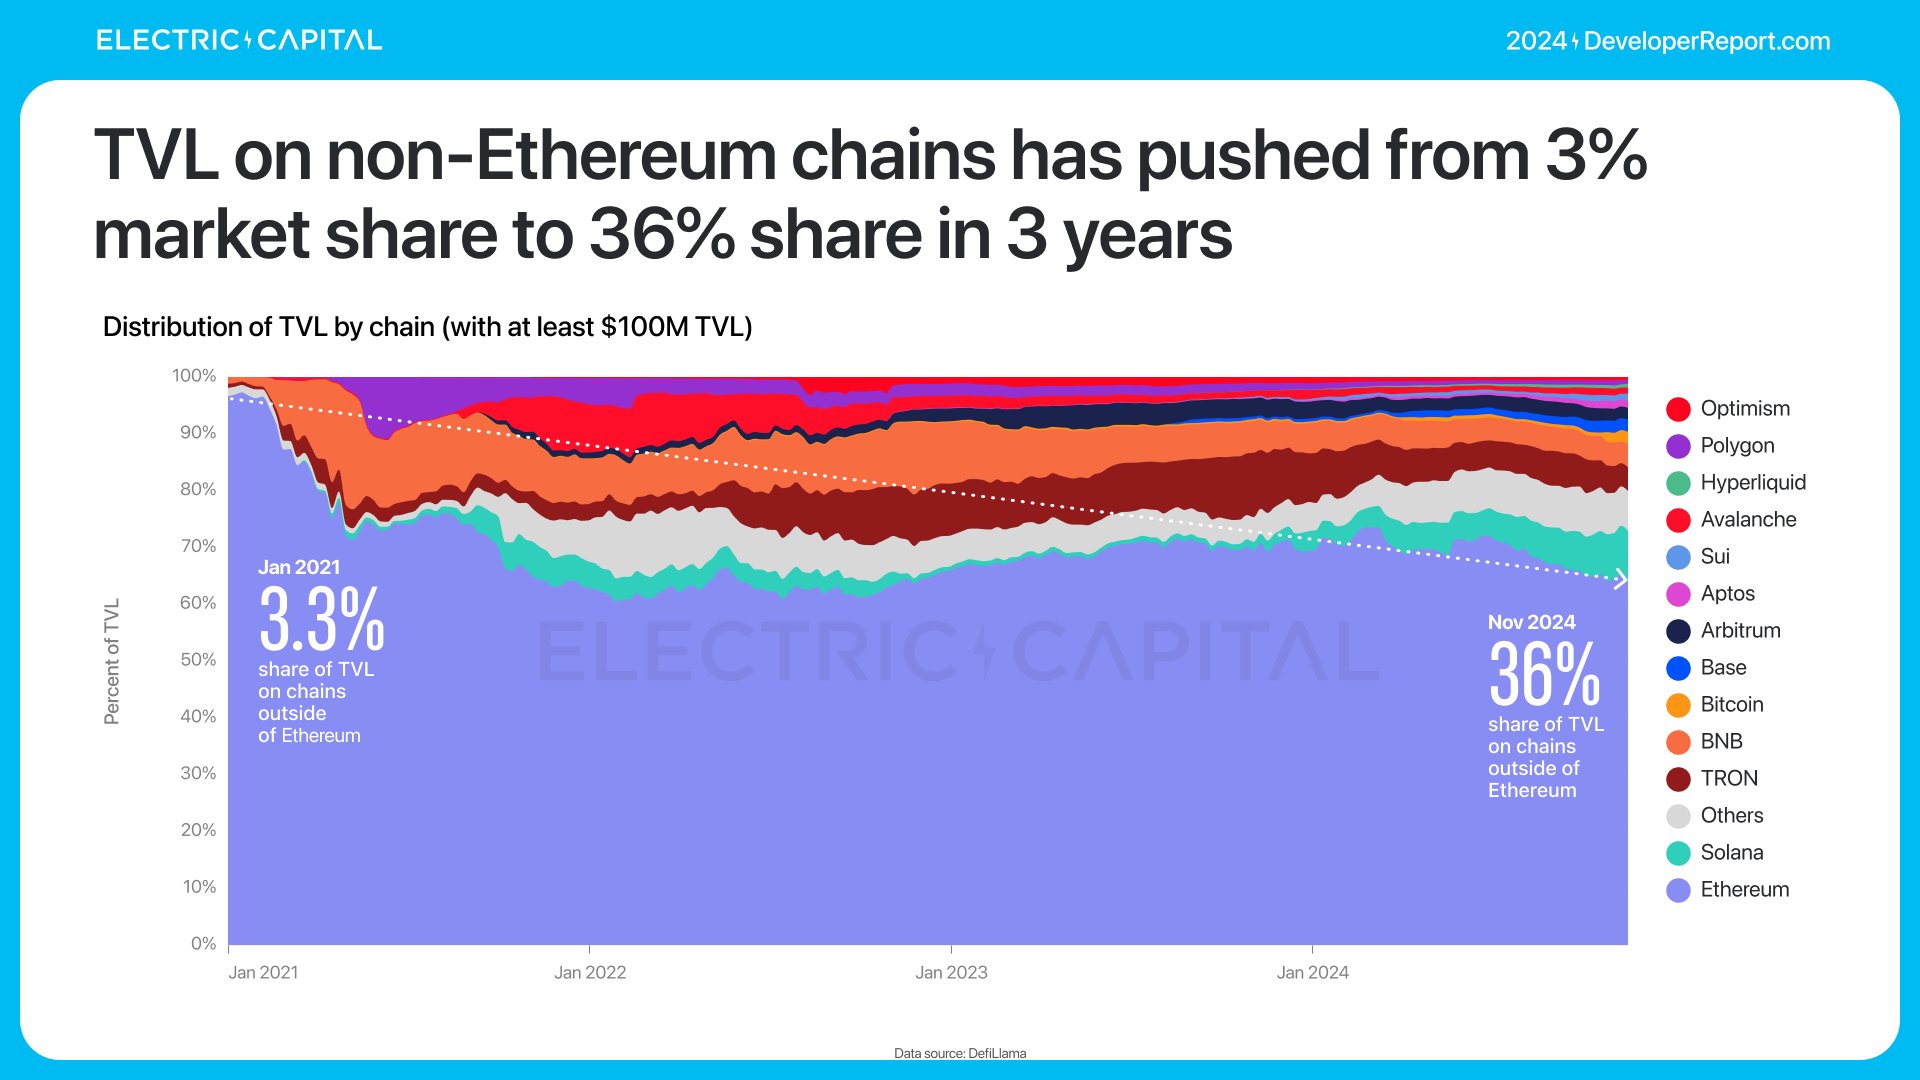
Non-Ethereum TVL grew from 3% to 36% over three years.
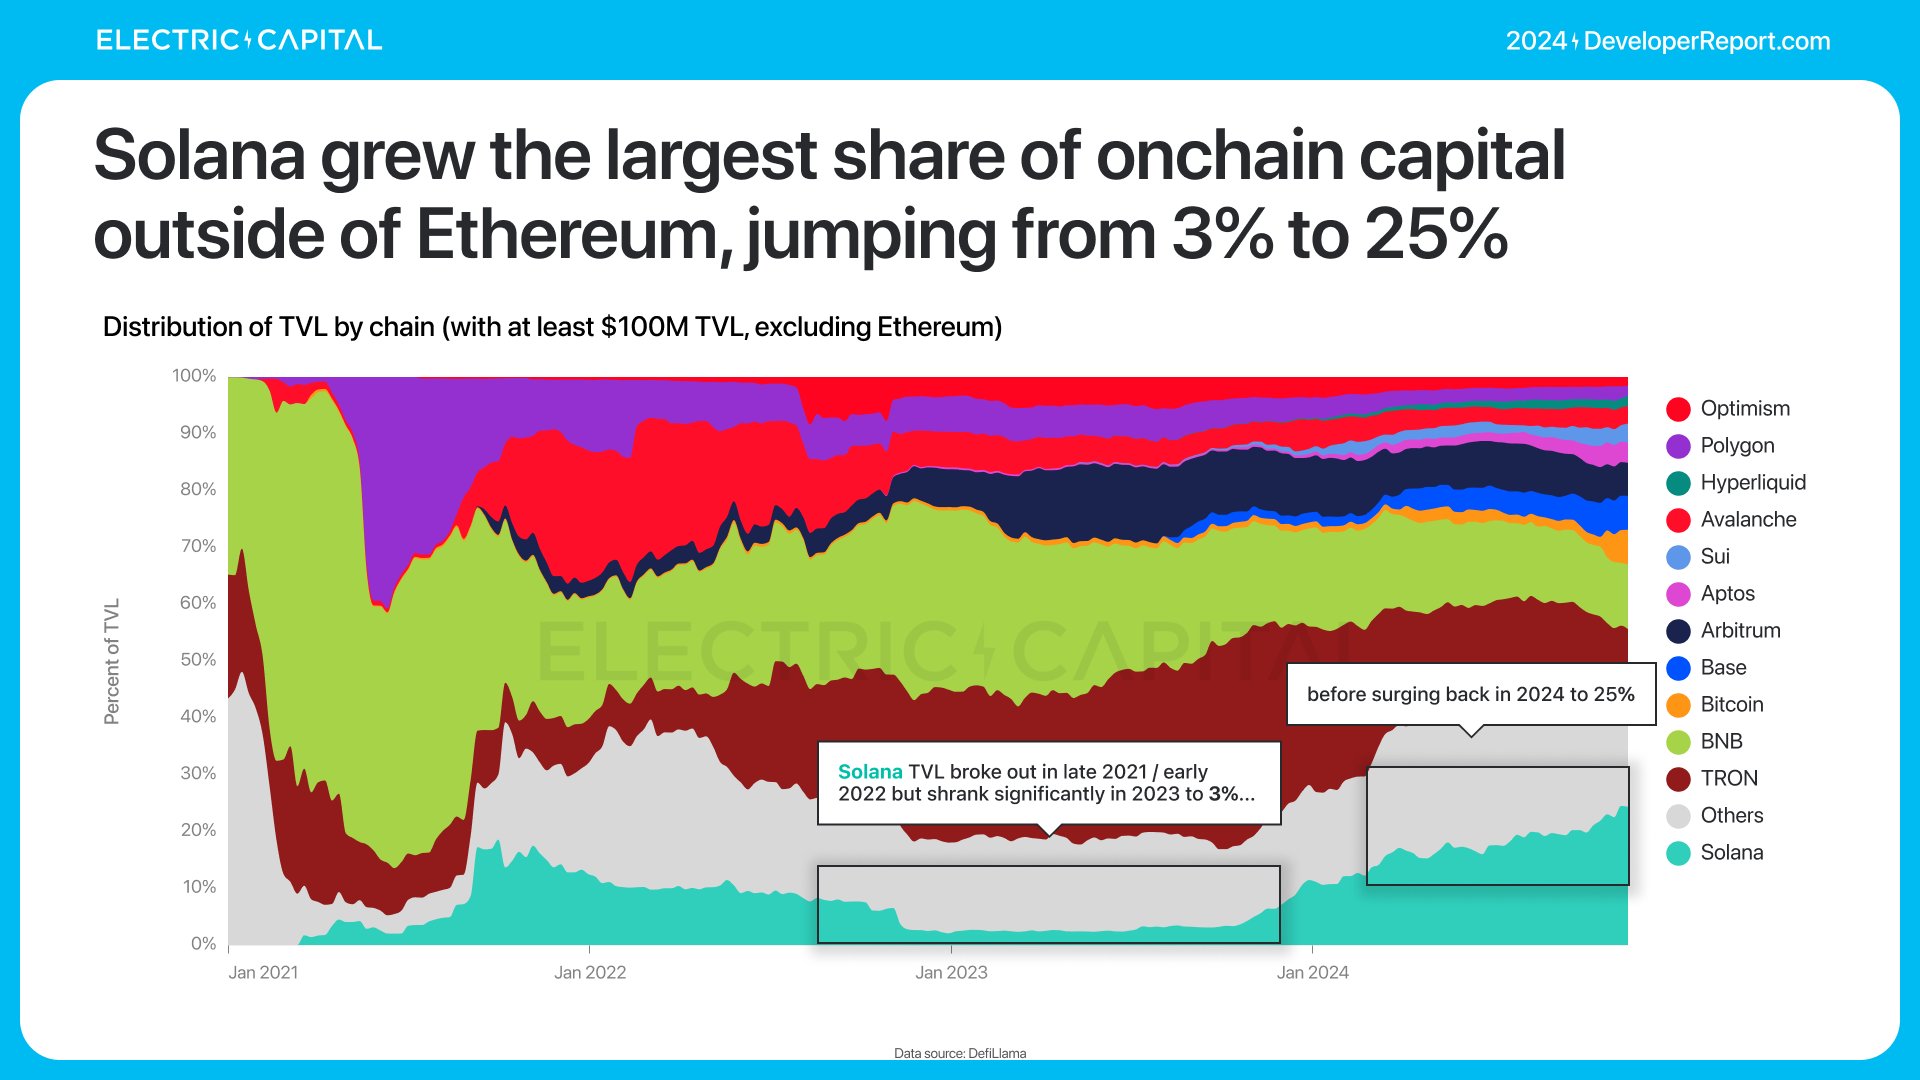
Solana saw the largest jump in TVL share.
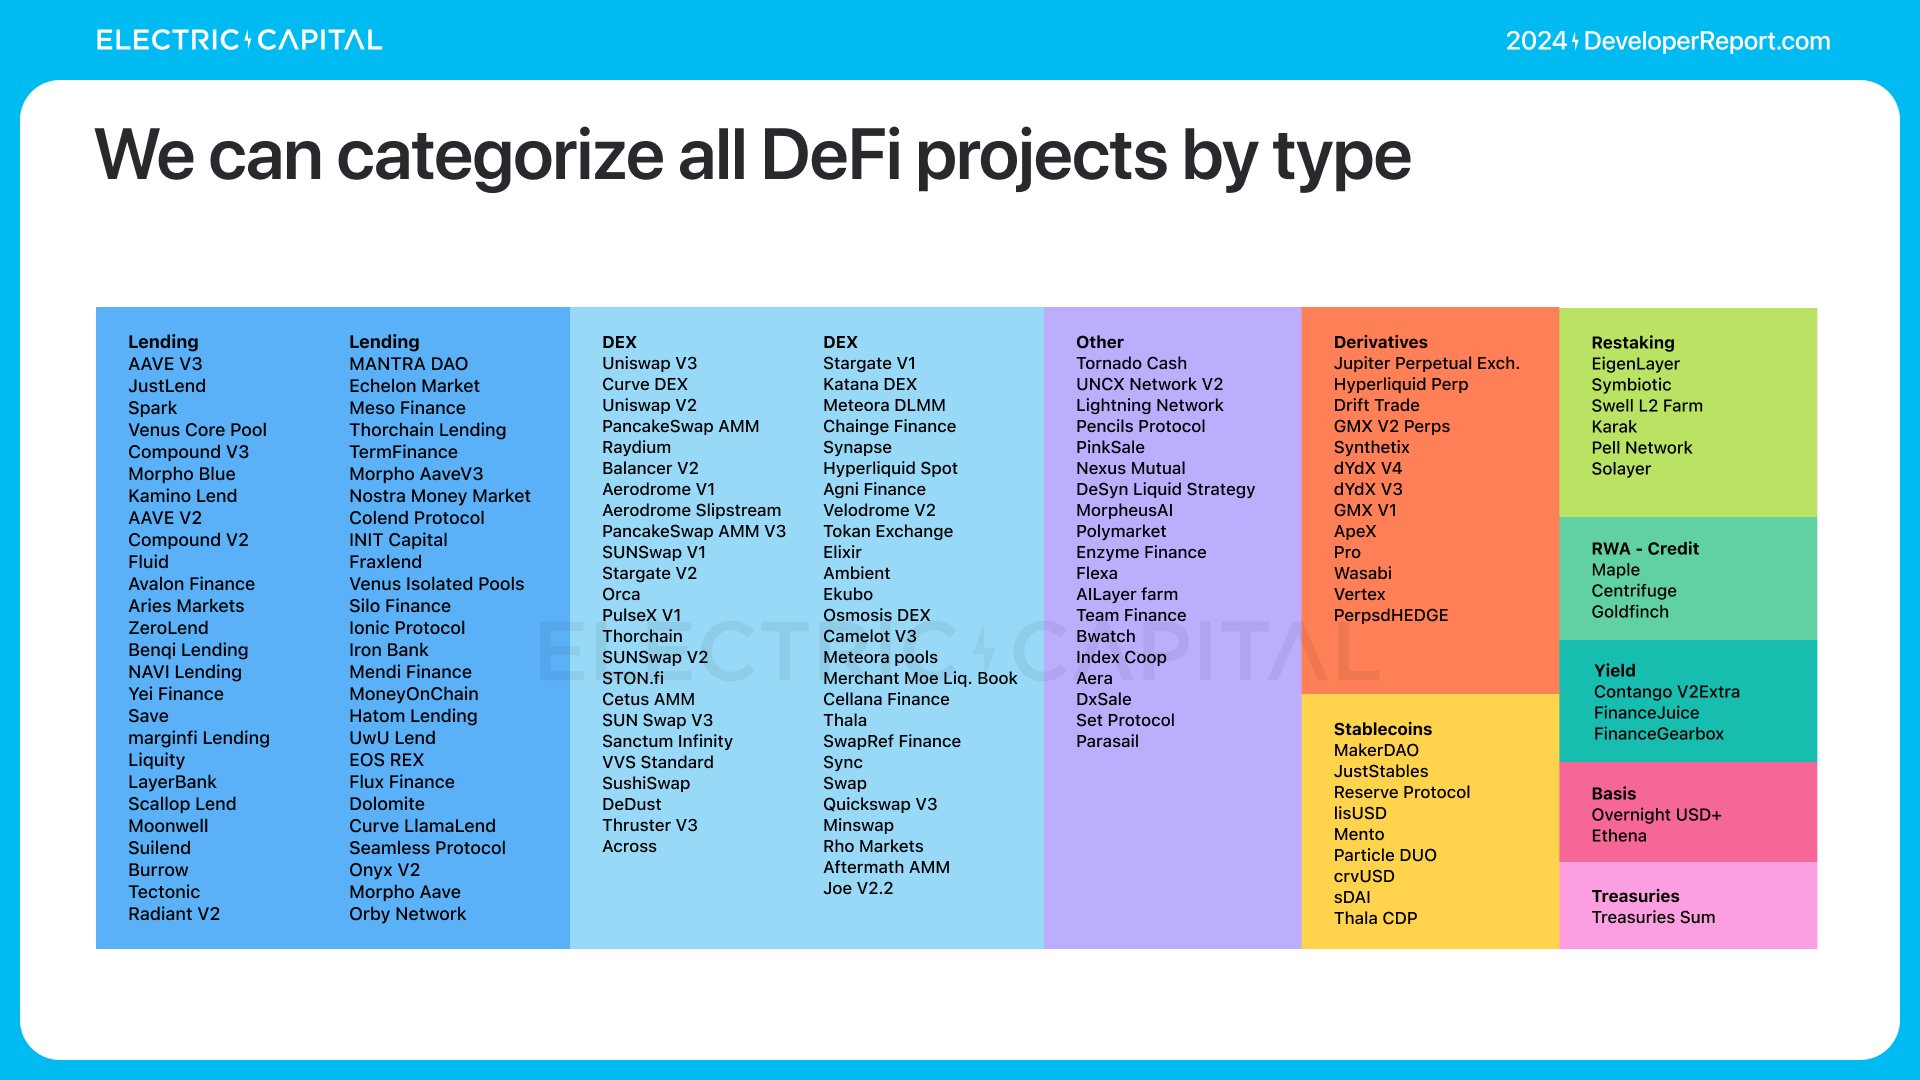
What’s driving all this TVL growth? We can categorize DeFi developers by type.
Over the past year, restaking grew $29 billion in TVL.
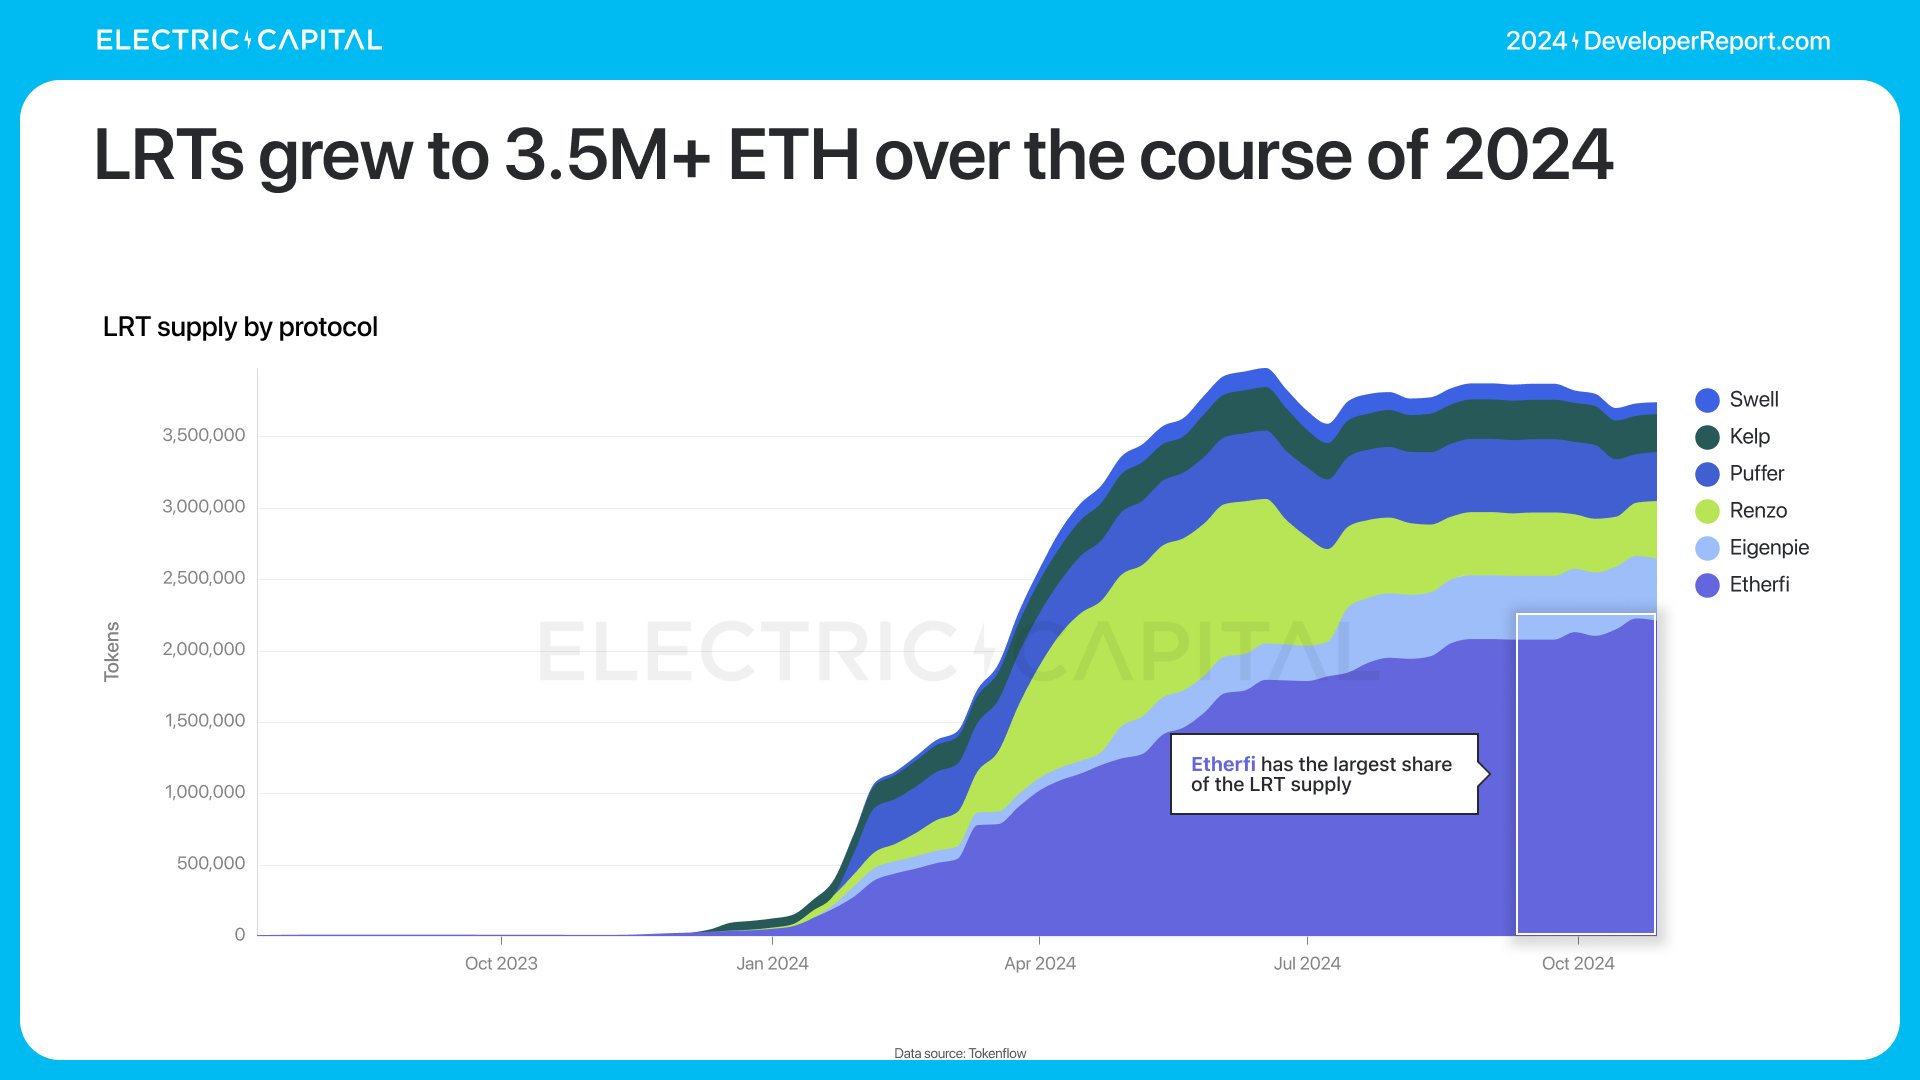
LRTs have grown to over 3.5 million ETH.
46% of LRTs are used in DeFi.
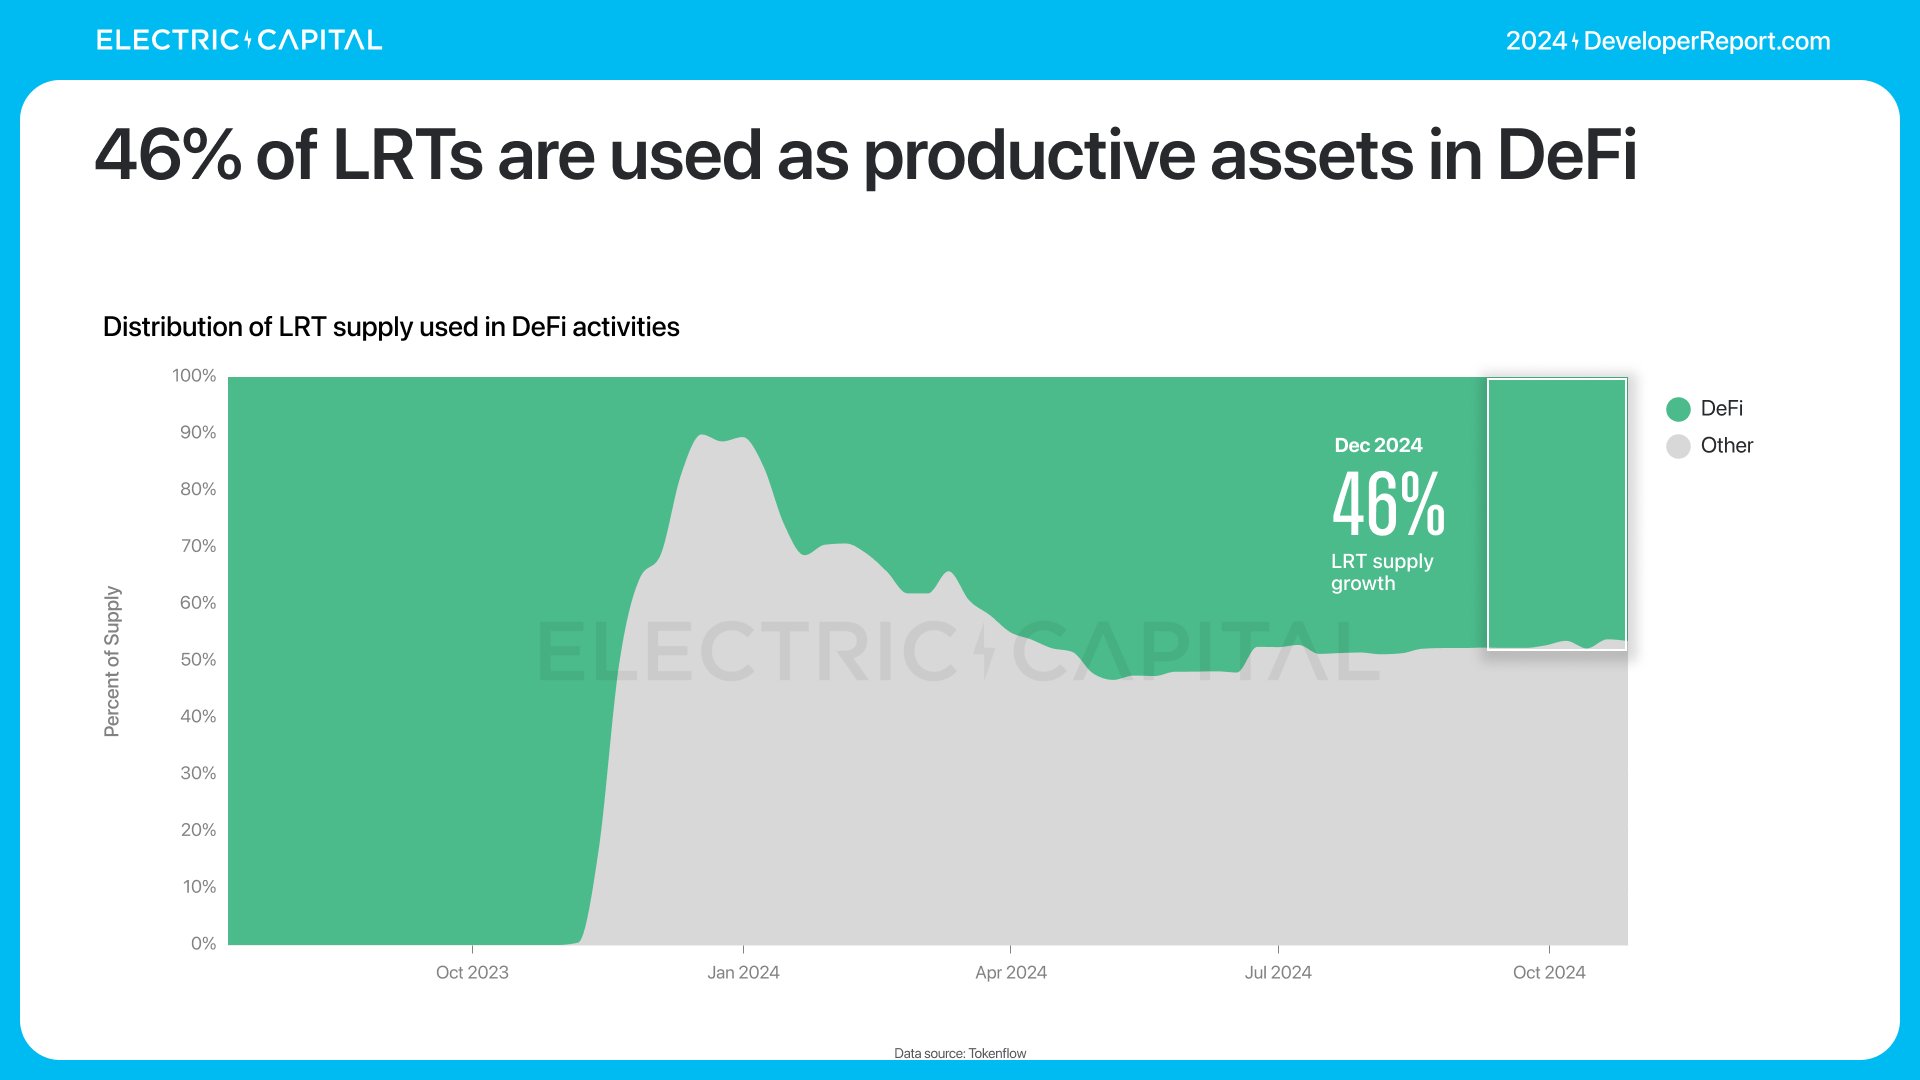
Most LRTs are deposited into money markets, yield strategies, interest rate derivatives, and bridging platforms.

EigenLayer enabled the creation of LRTs as a category. How is EigenLayer’s developer ecosystem developing?
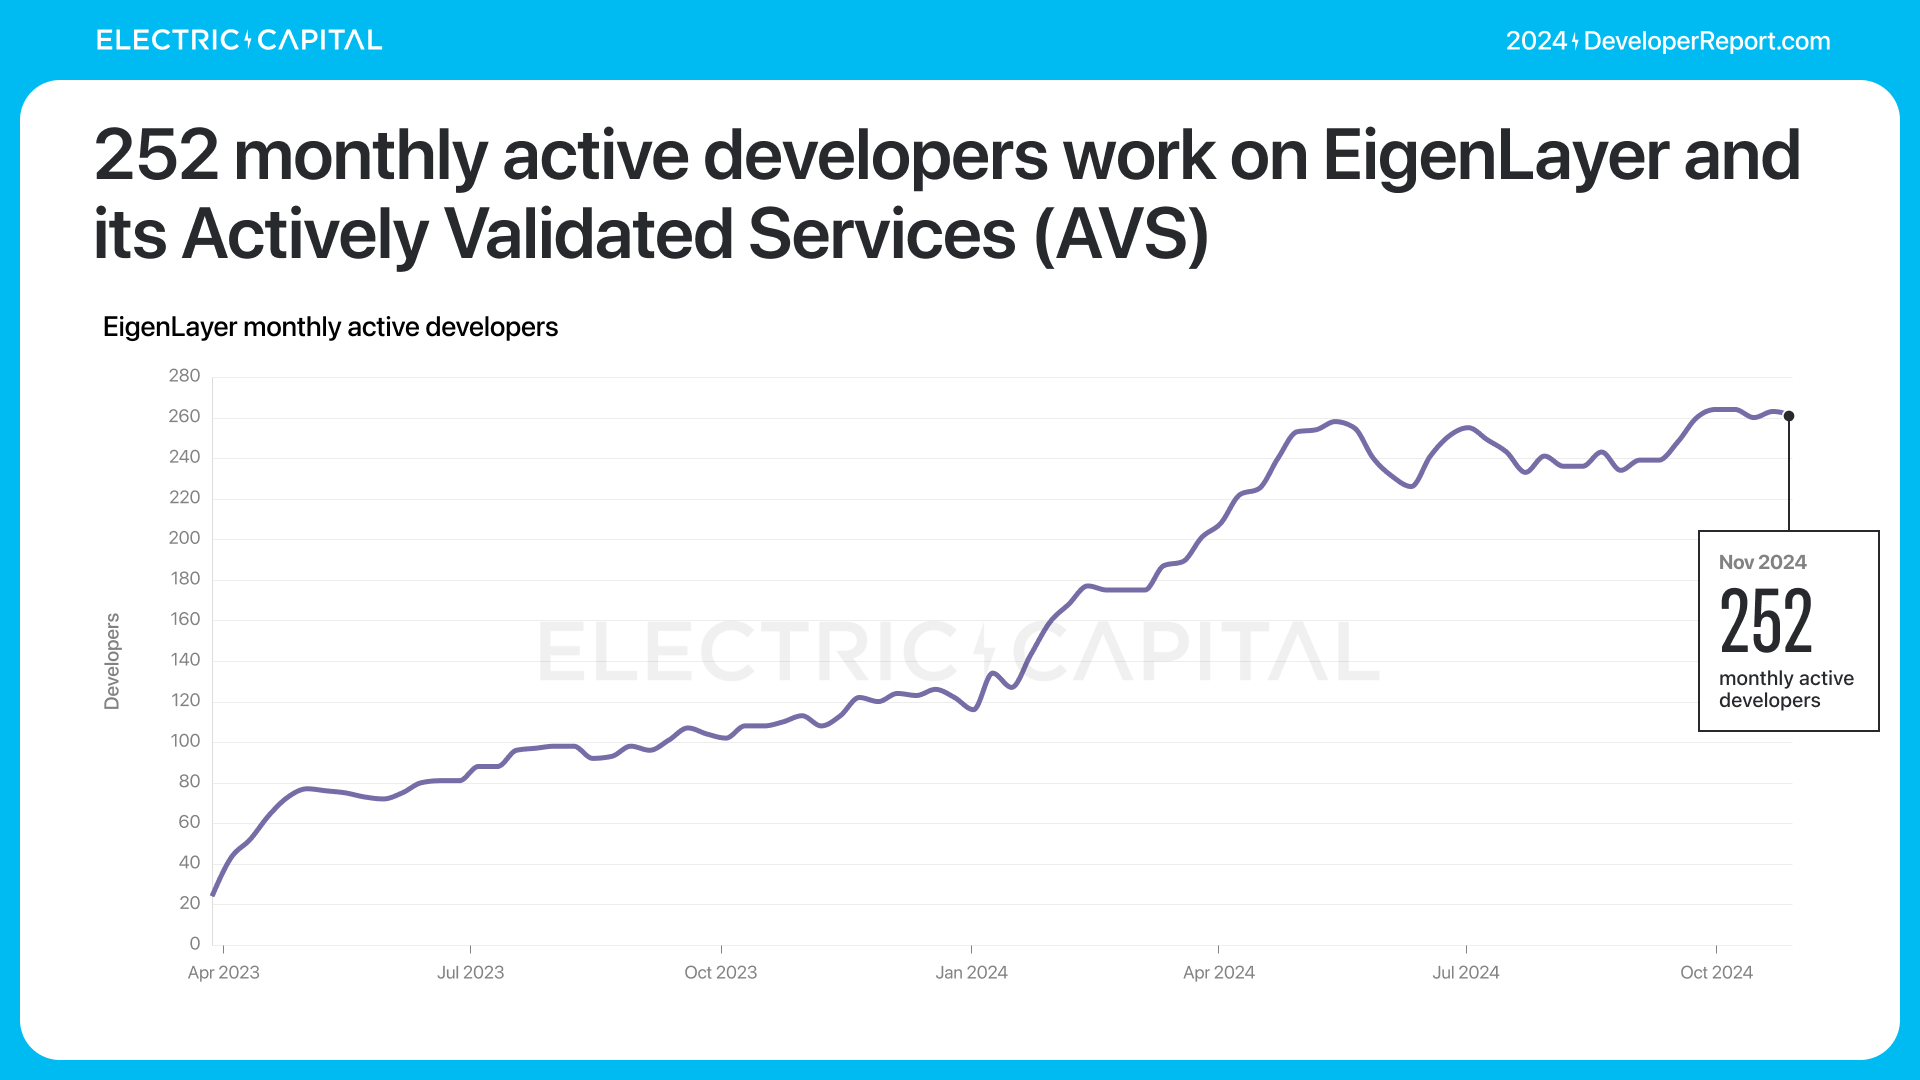
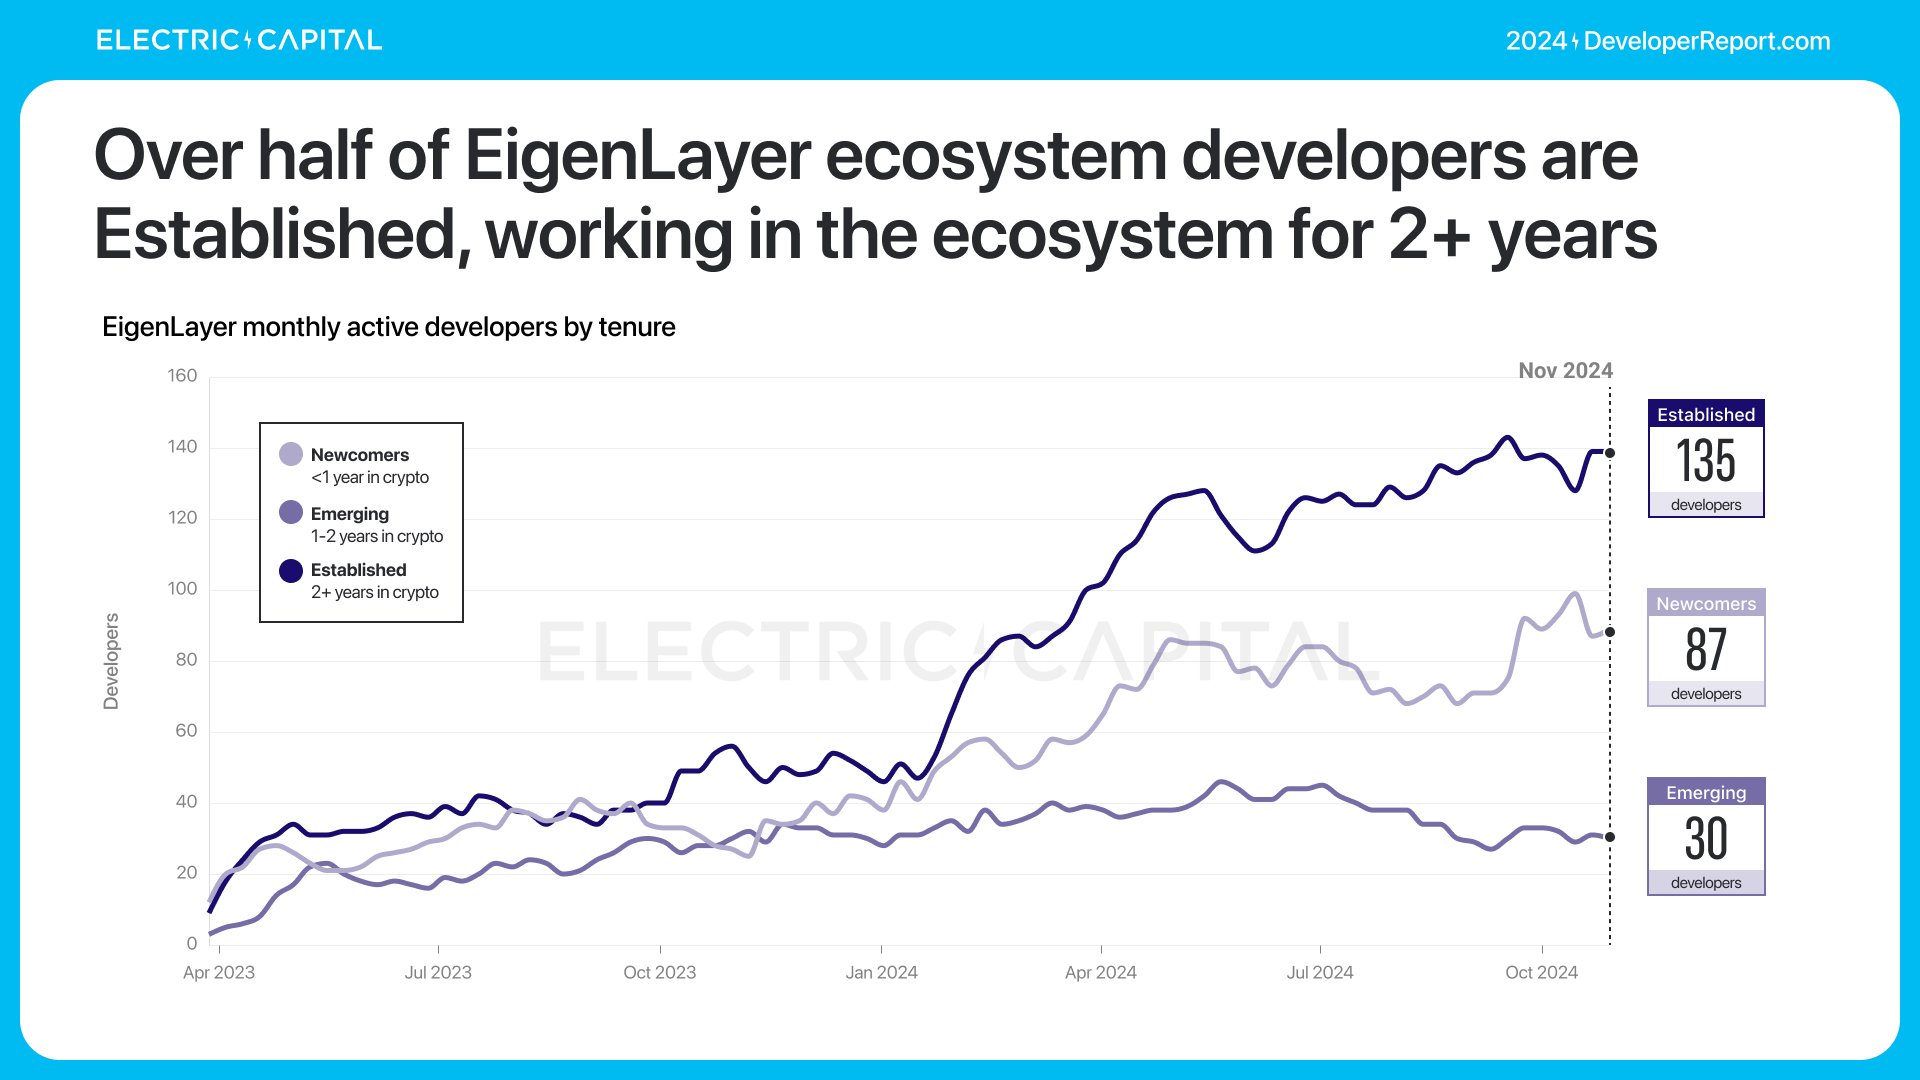
252 monthly active developers work in the EigenLayer ecosystem. EigenLayer developers are highly committed: 39% are full-time, and over half have worked in the ecosystem for more than two years.

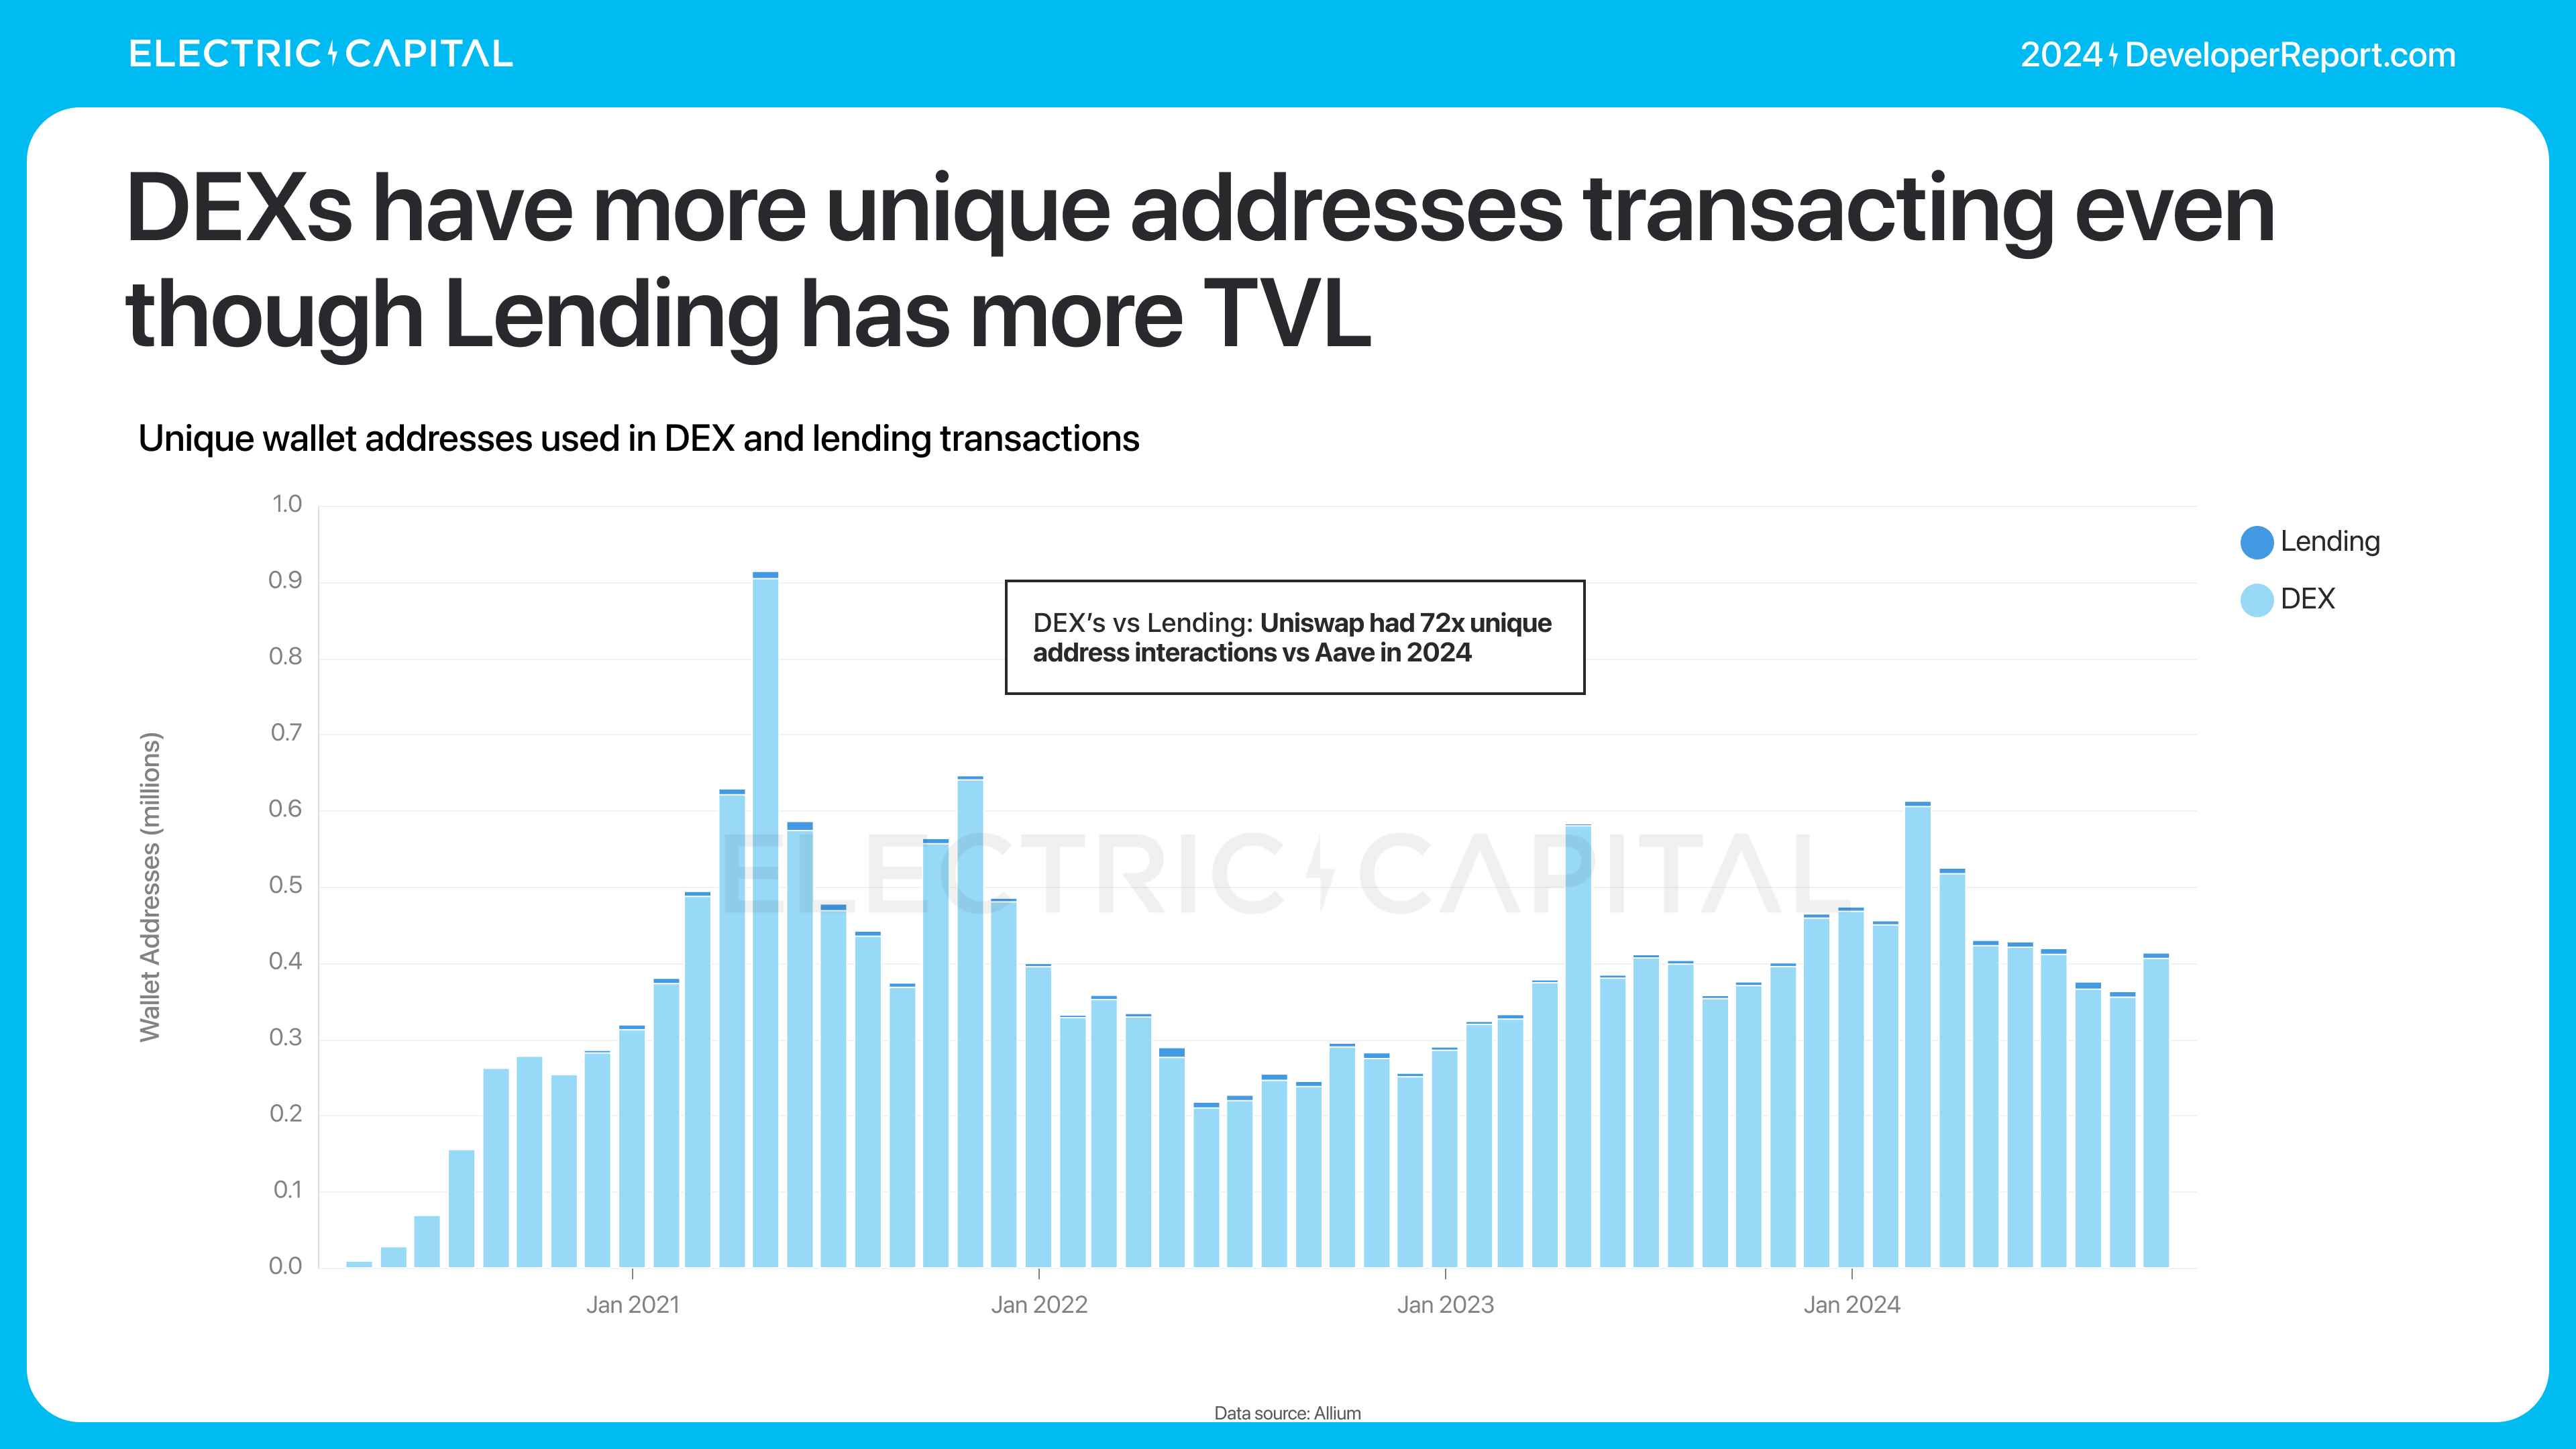
TVL is not the only metric for understanding DeFi usage. Although lending platforms have 3x the TVL of DEXs, DEXs see more unique address interactions. For example—DEX vs. lending: in 2024, Uniswap had 72x more unique address interactions than AAVE.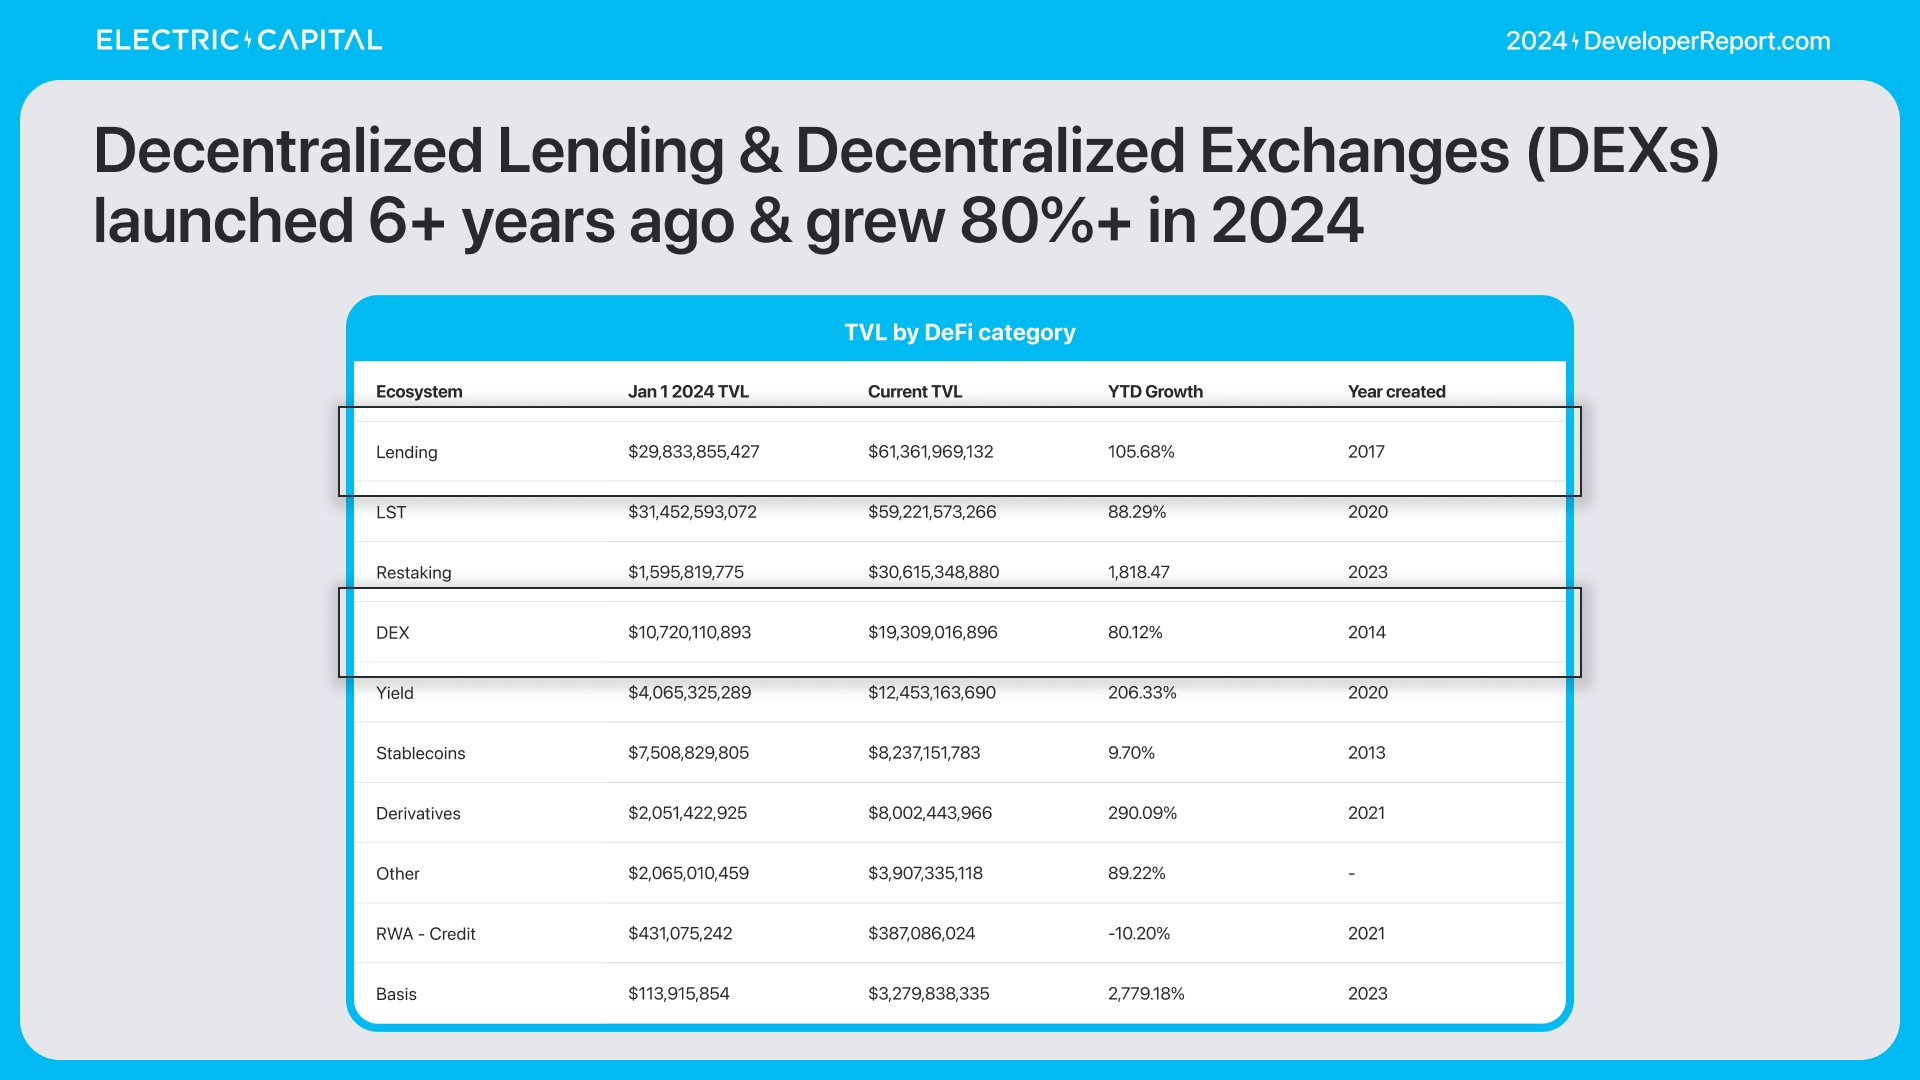
In 2024, DEX trading volume nearly doubled to $209 billion per month.
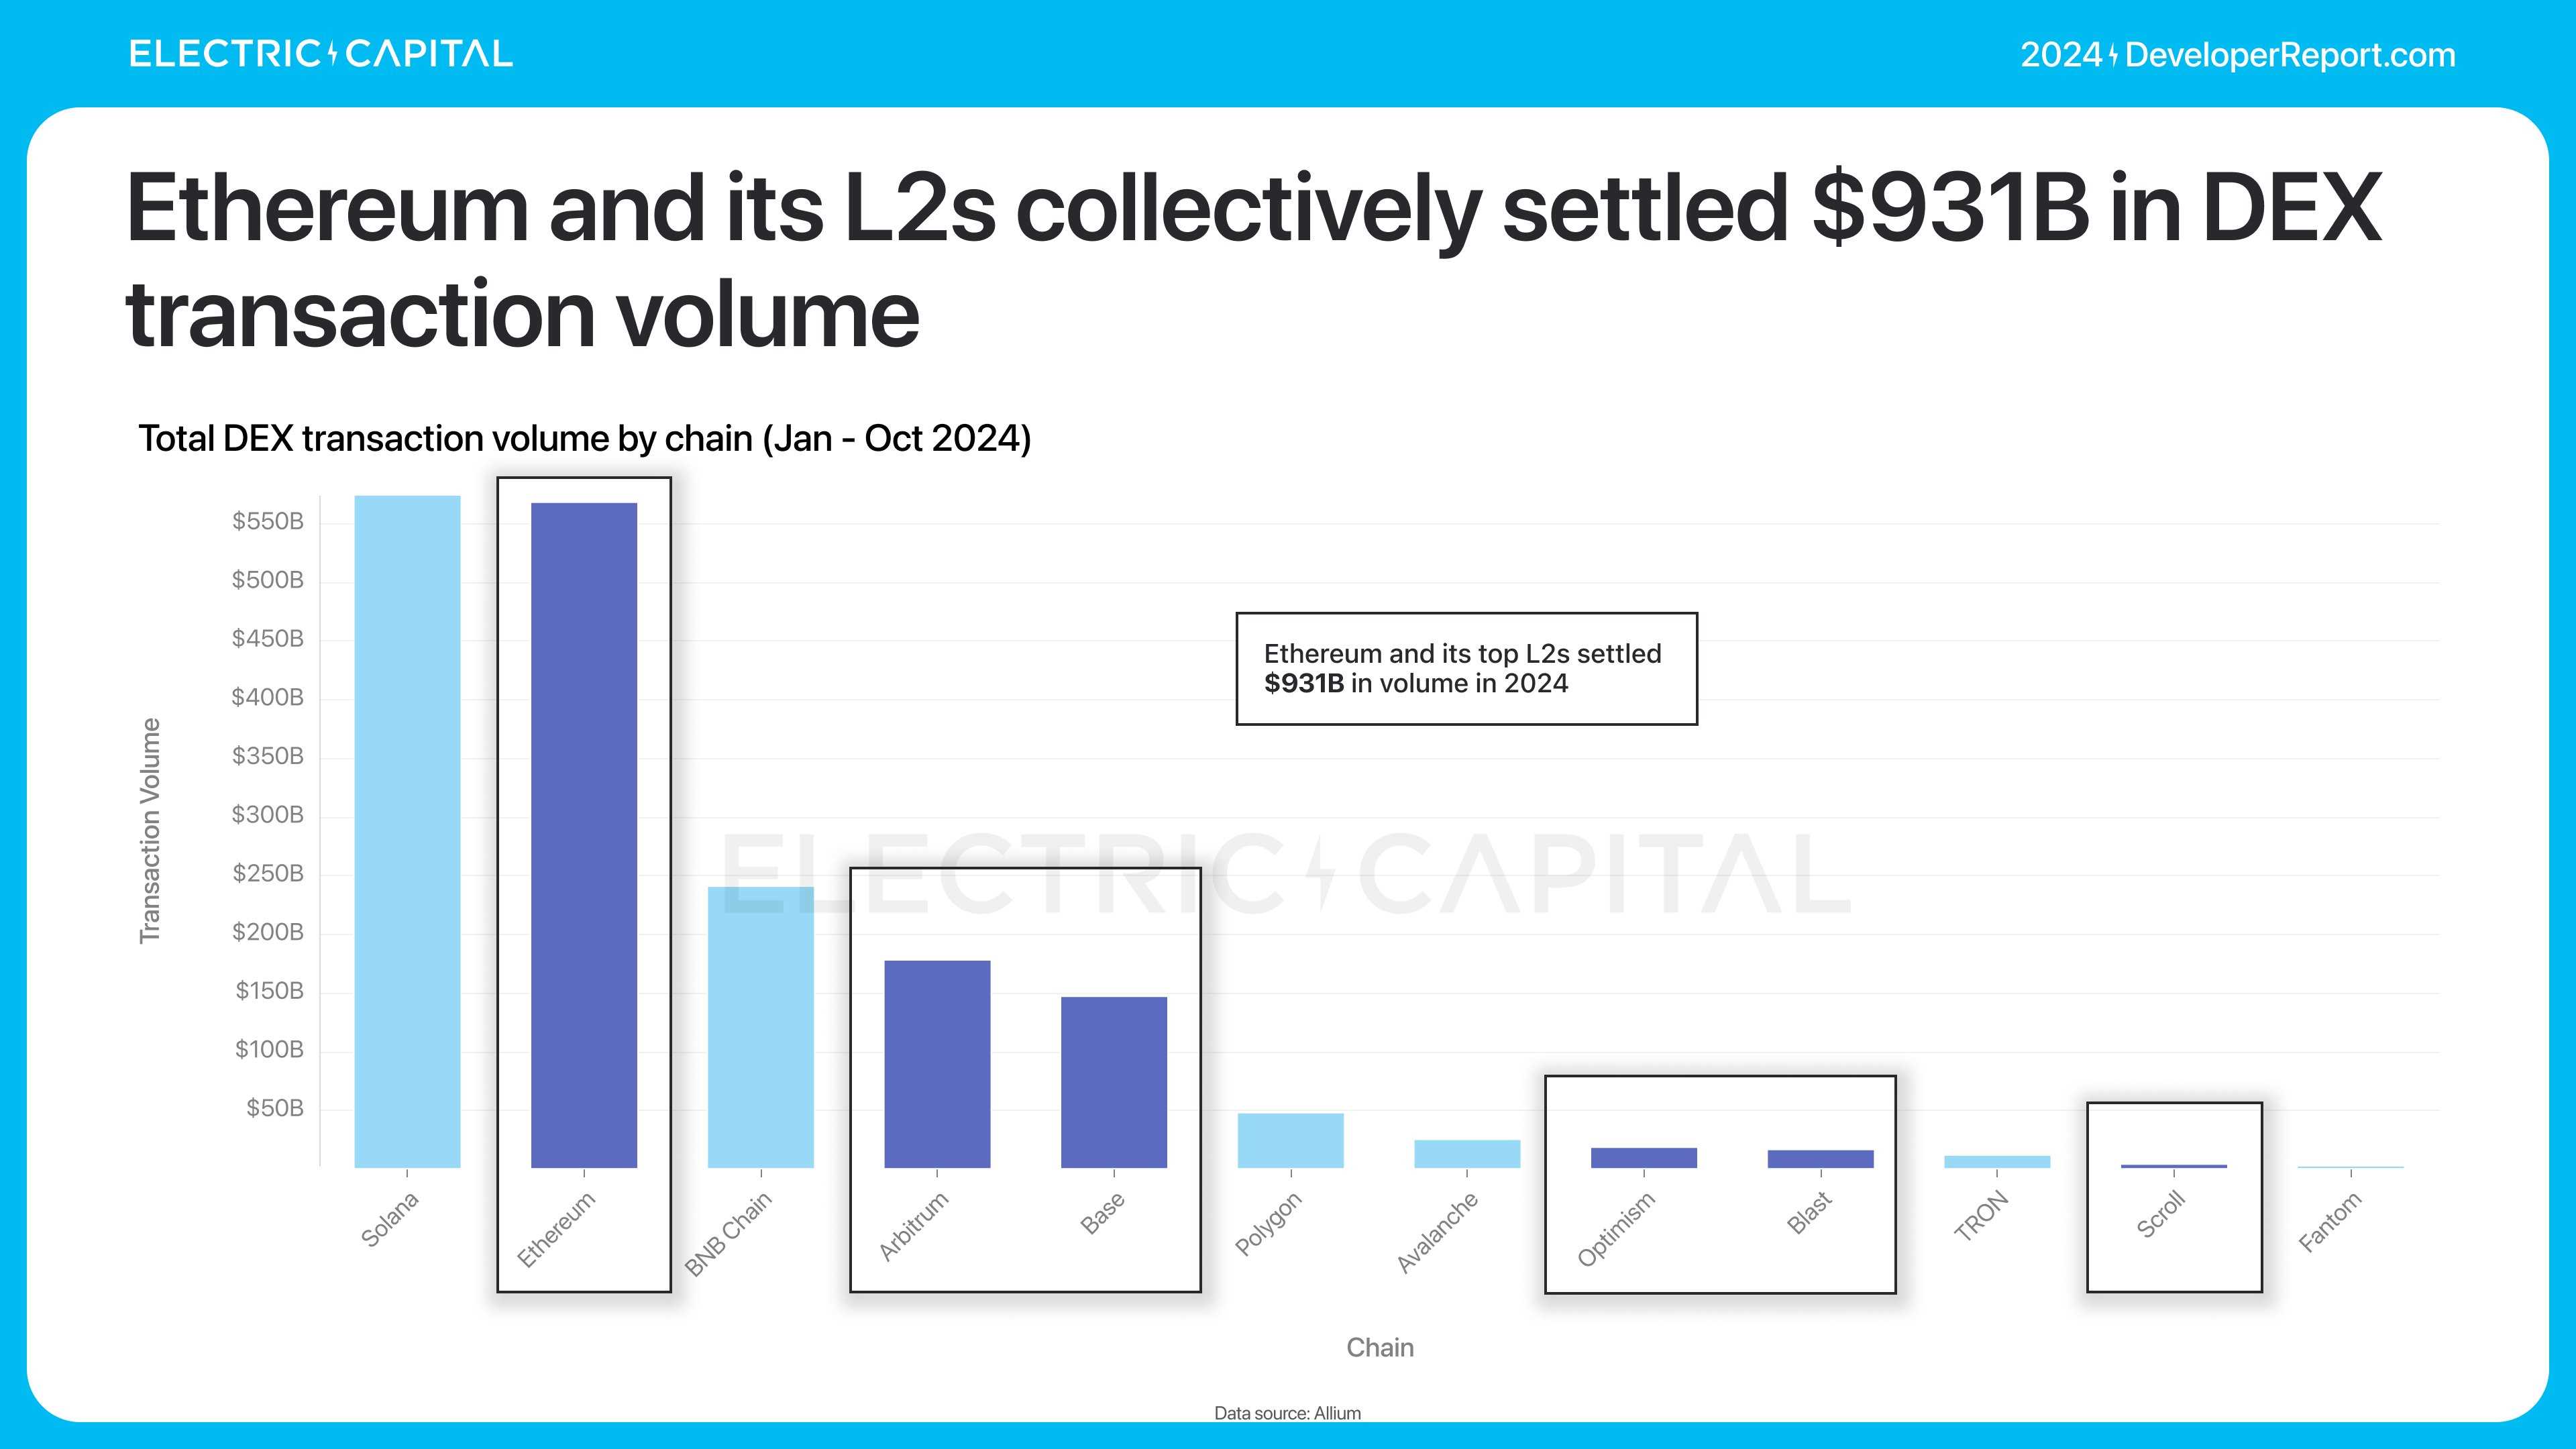
Solana and Ethereum settle the most volume—over twice as much as the second-largest chain.

Solana settled the most volume in 2024, reaching $574 billion. Ethereum mainnet and its L2s combined for $931 billion in DEX volume.
Solana dominates low-fee DEX use cases. In 2024, its volume grew over threefold, reaching 646 million transactions per month.
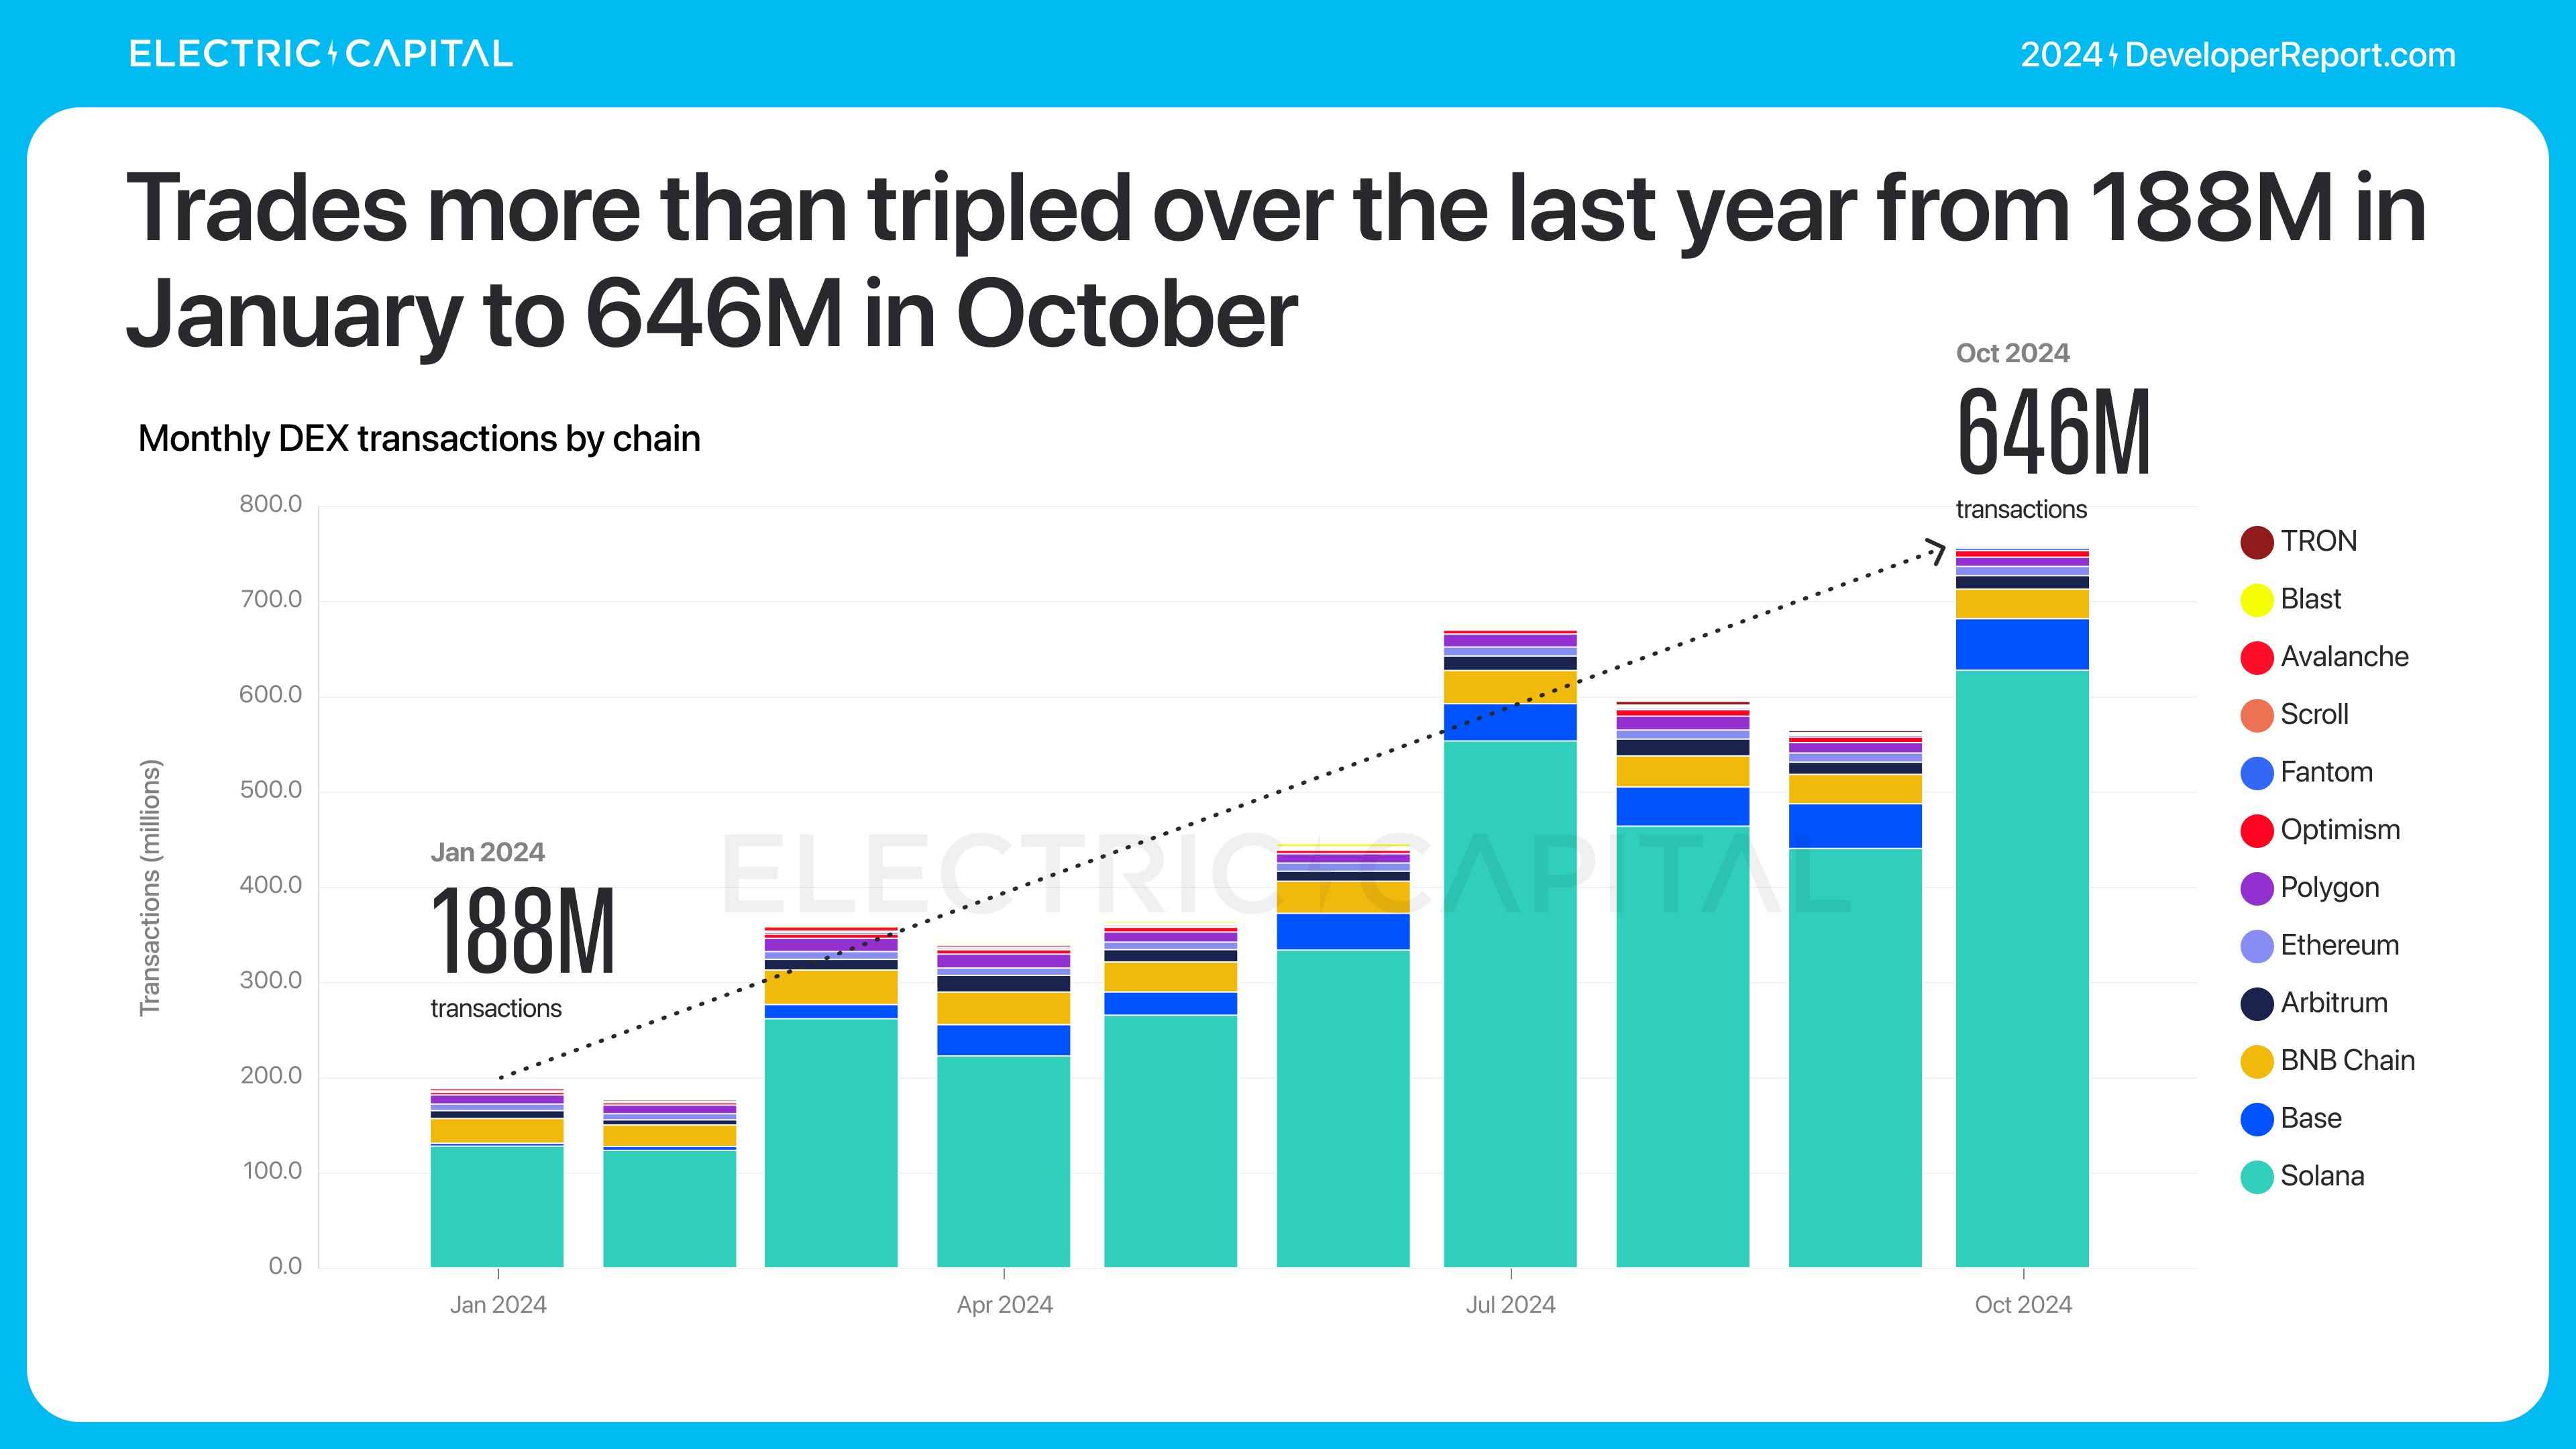
81% of DEX transactions come from Solana.

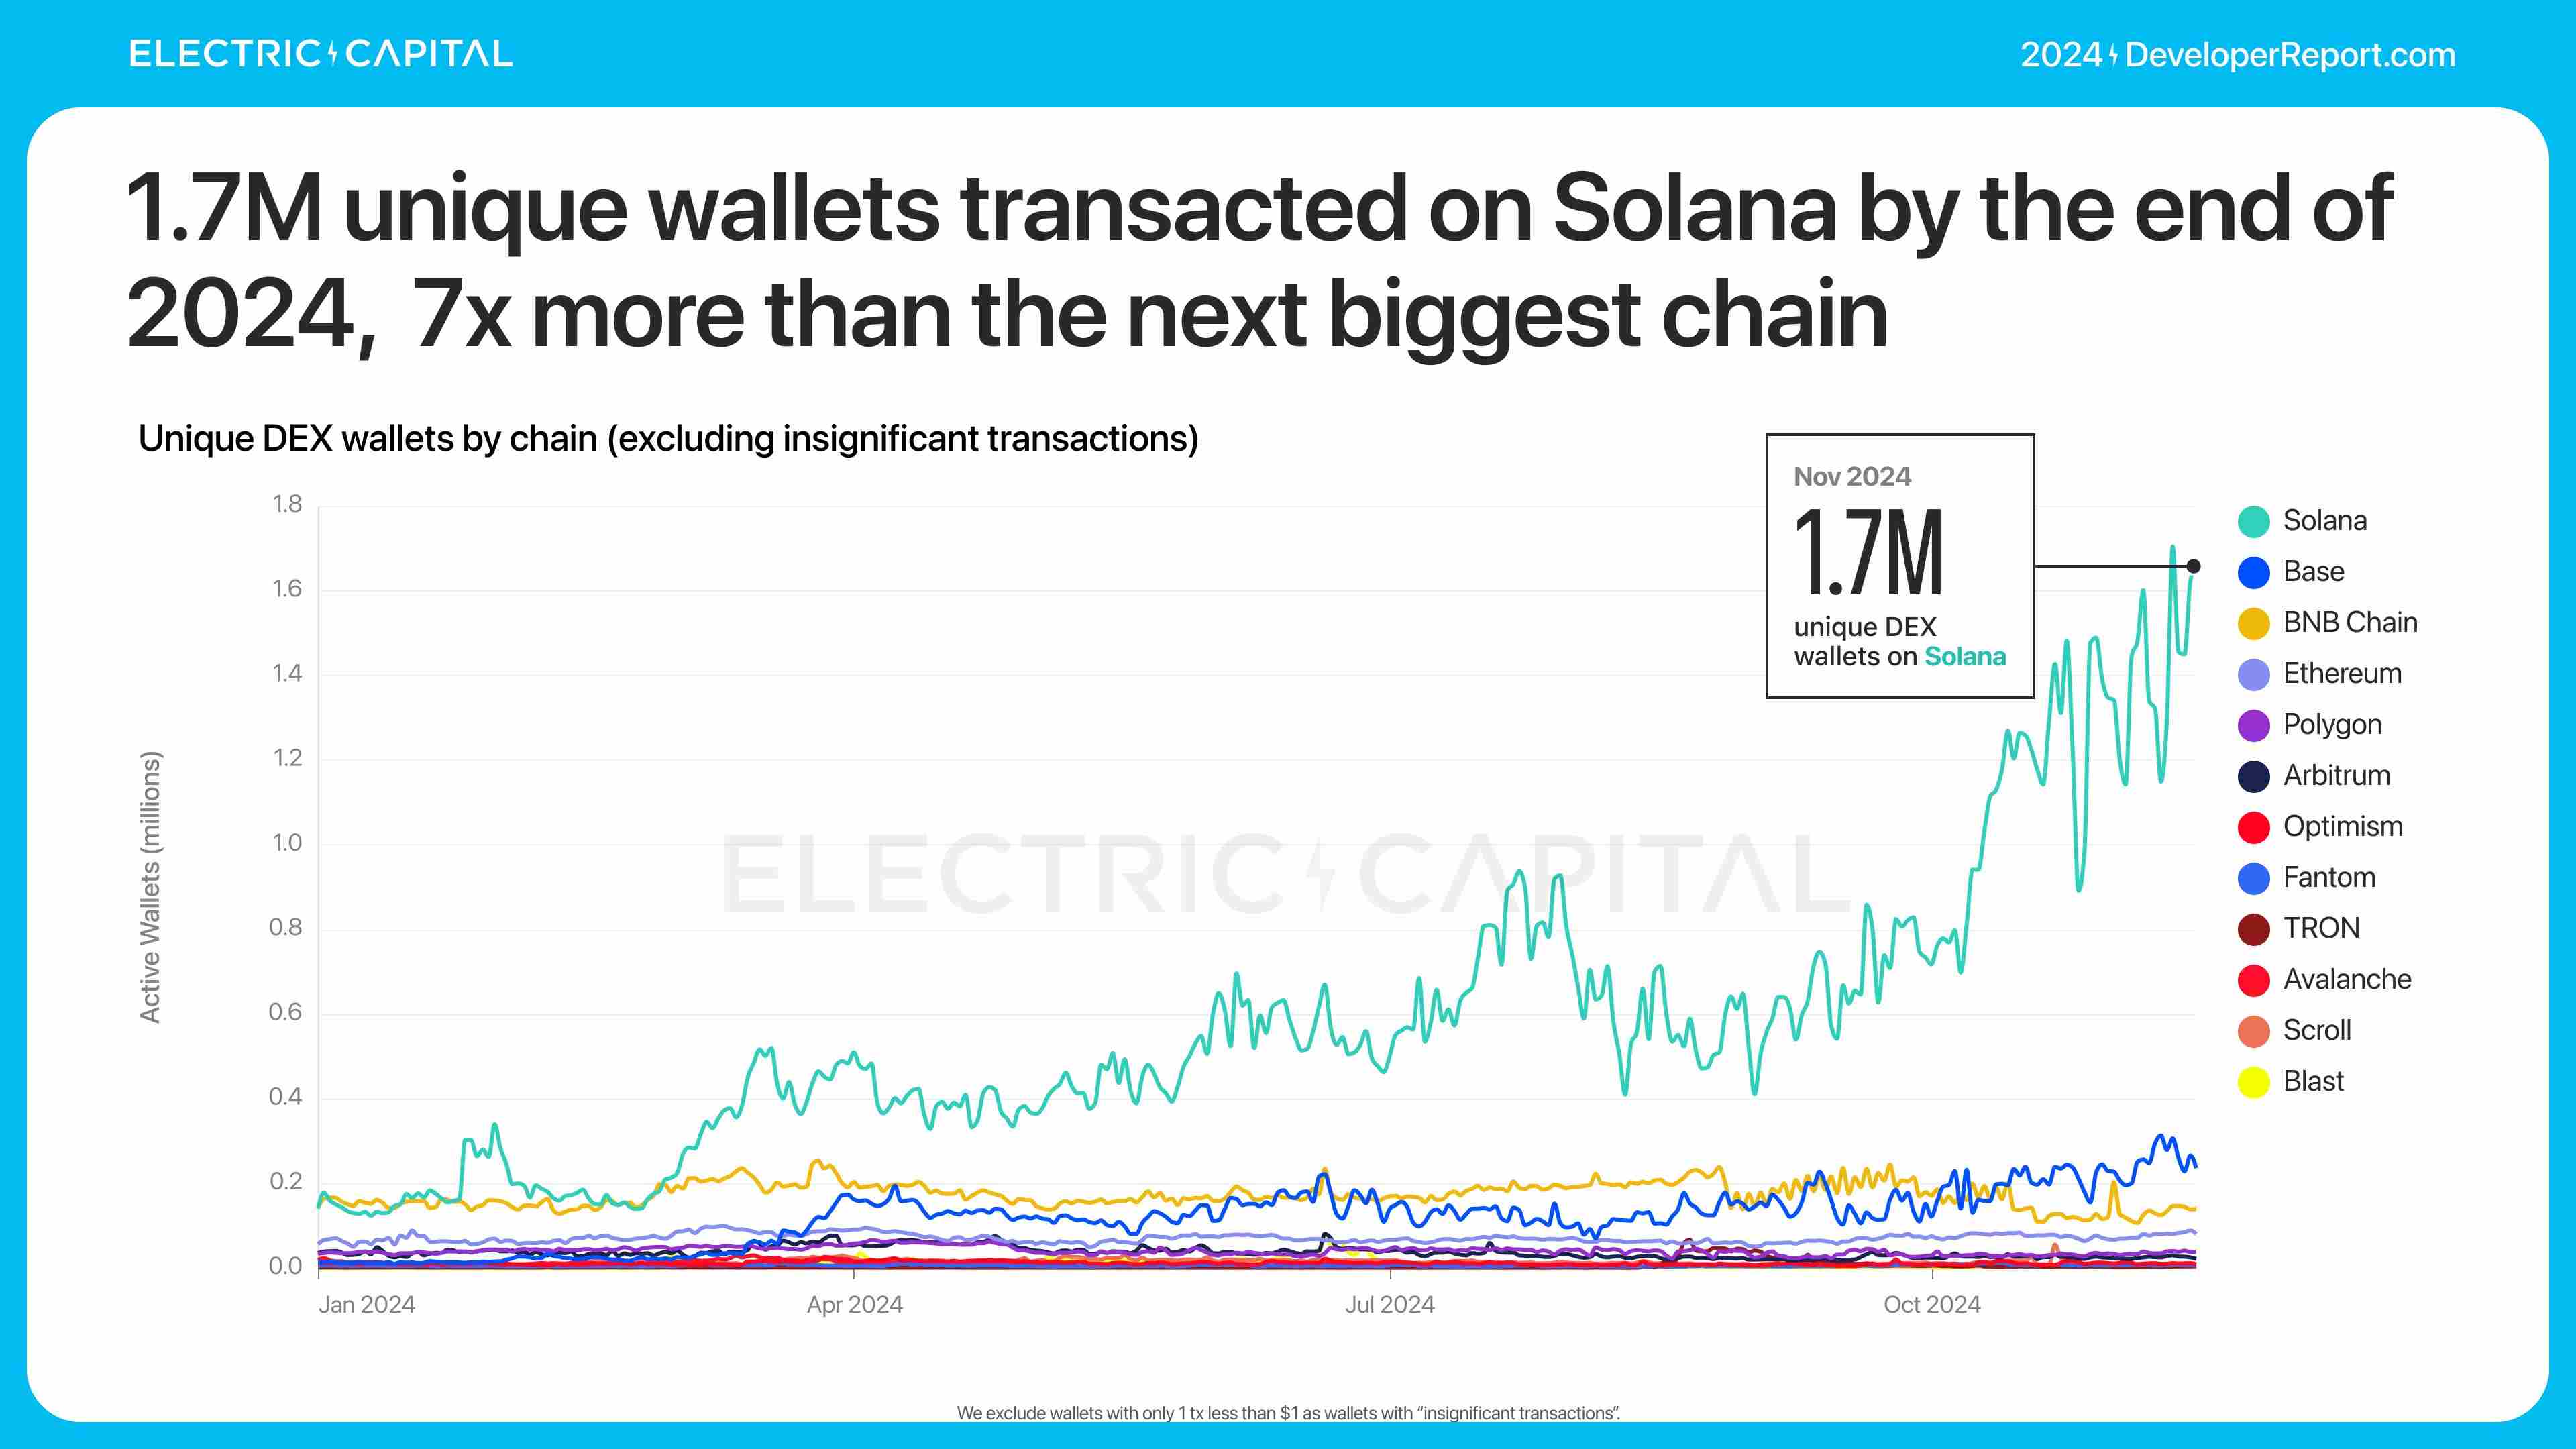
In terms of transaction wallet count—excluding wallets with only one transaction under $1—Solana has the most independent trading wallets, seven times more than the second-largest chain.
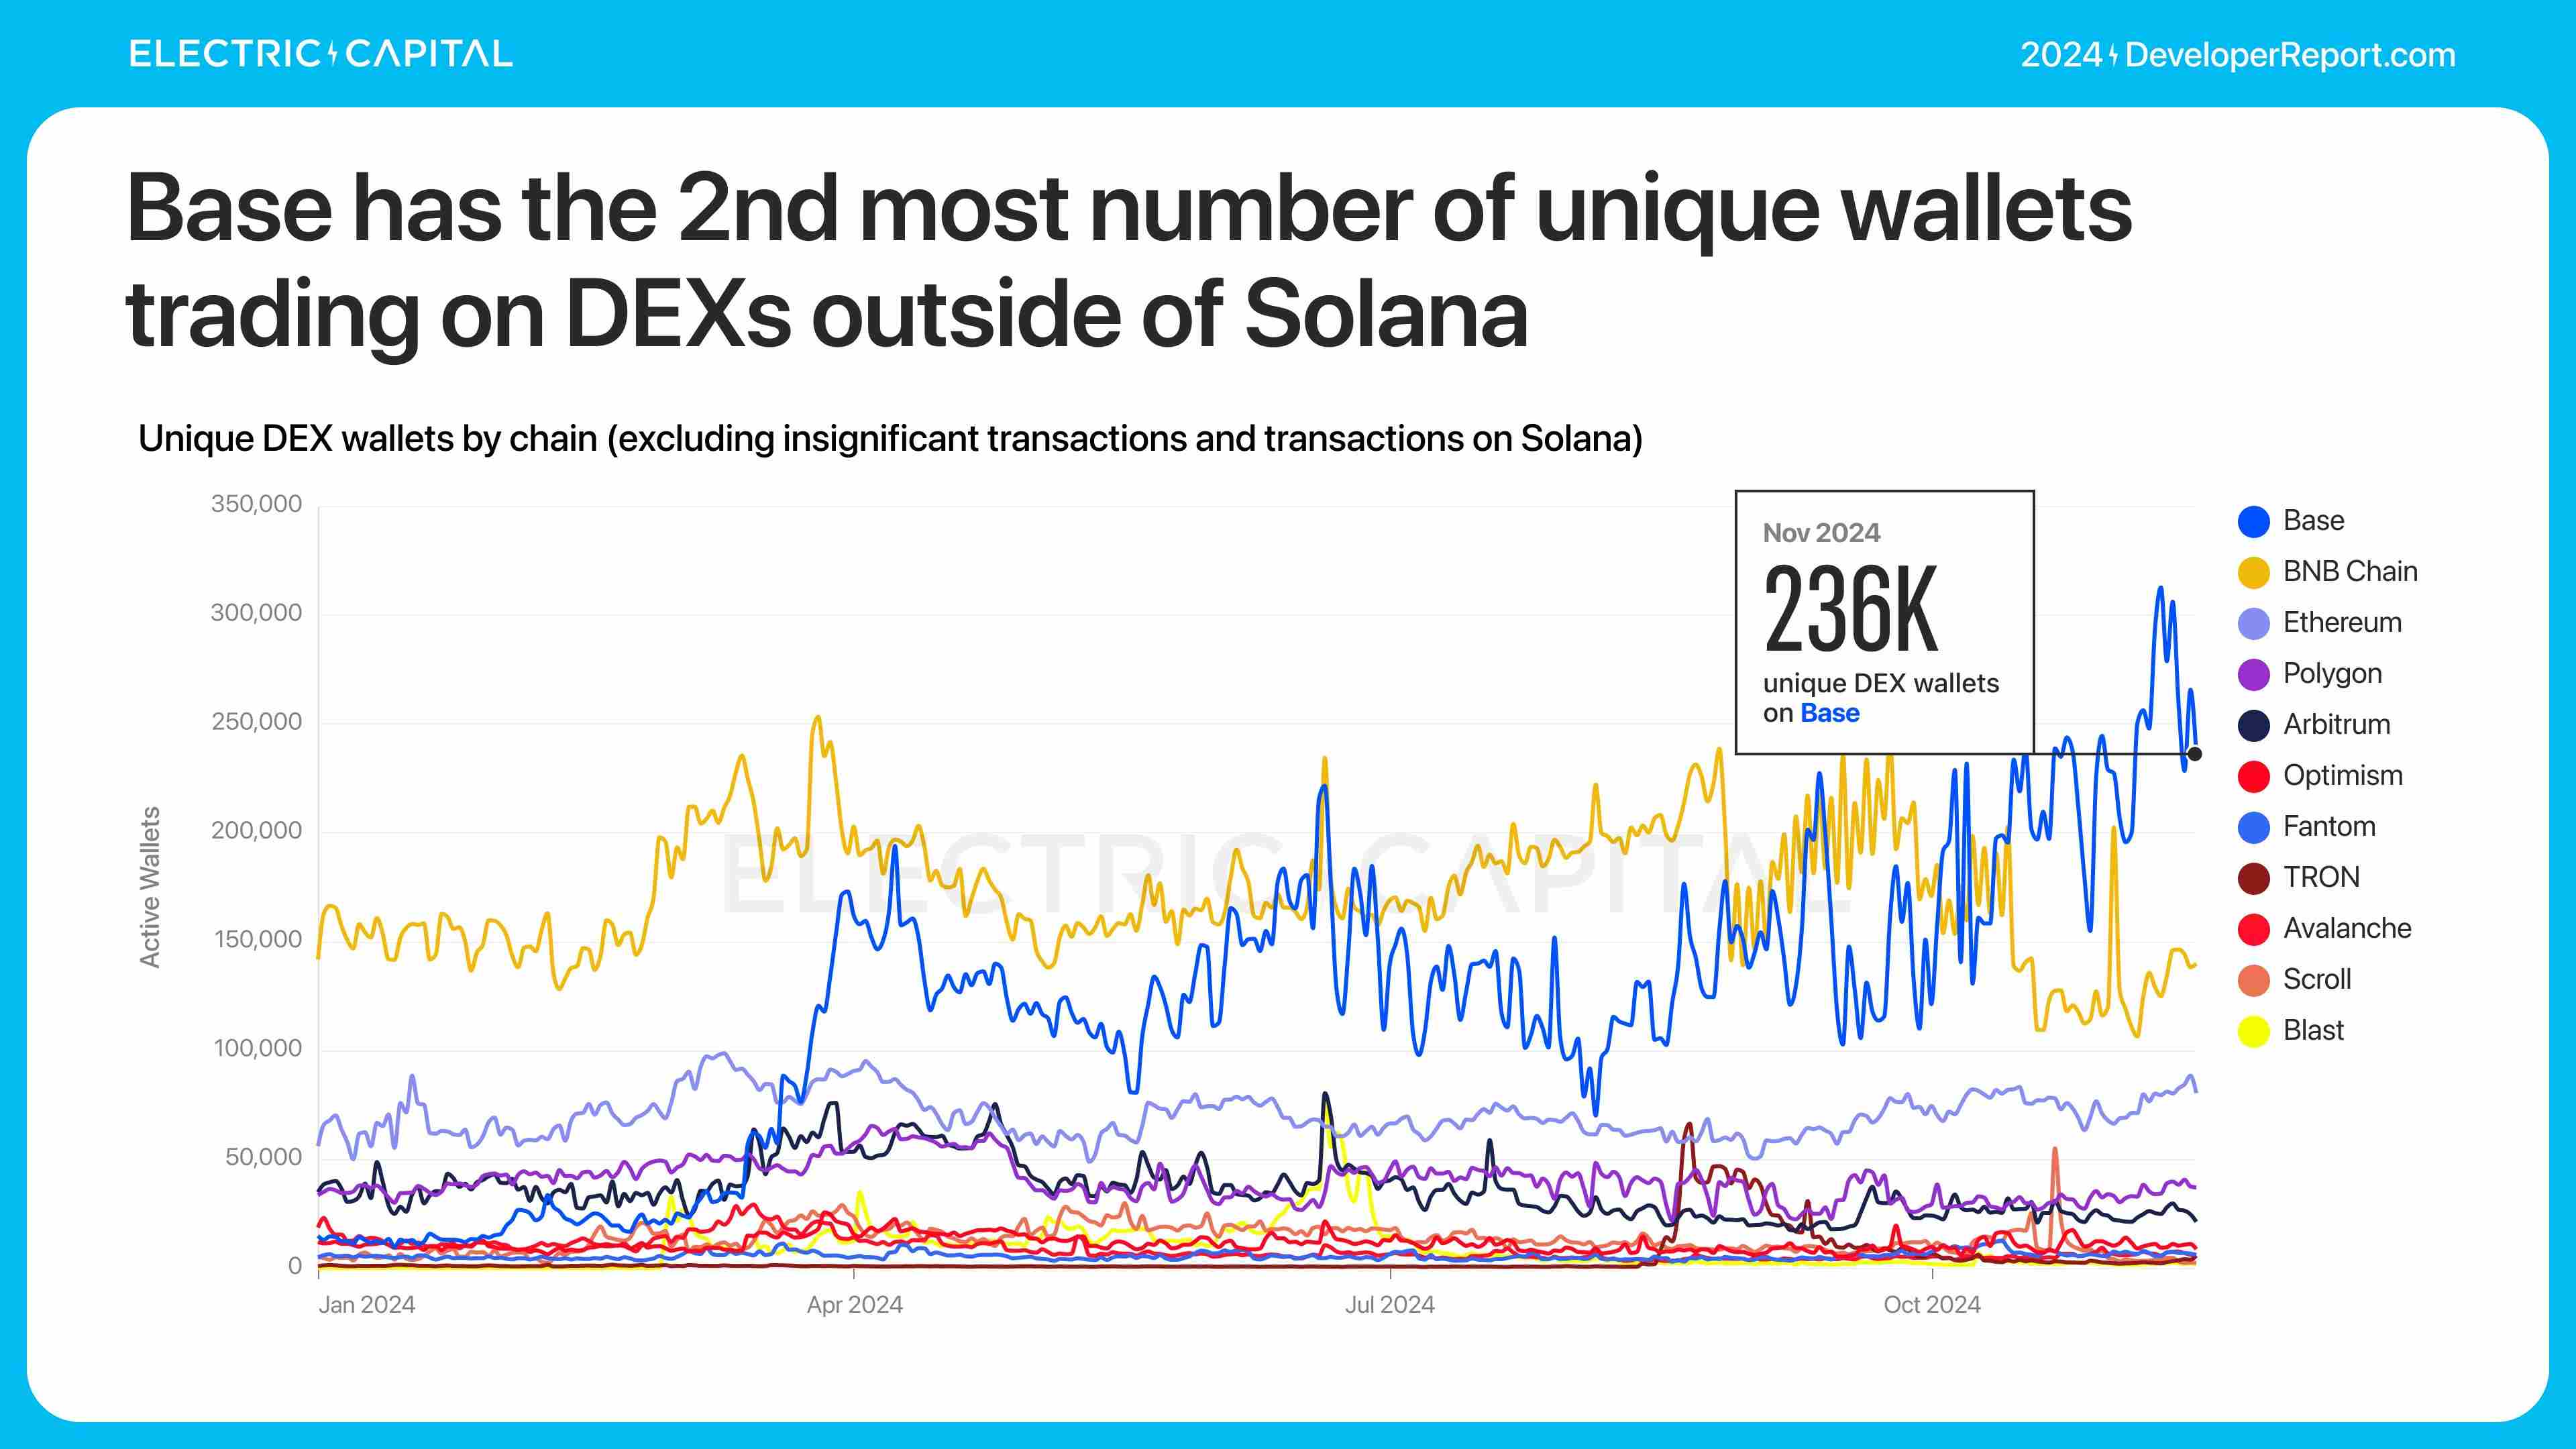
Base has the second-highest number of independent trading wallets outside of Solana.
Base and Solana are very popular for small transfers. Wallets on these chains have the smallest average transaction amounts.
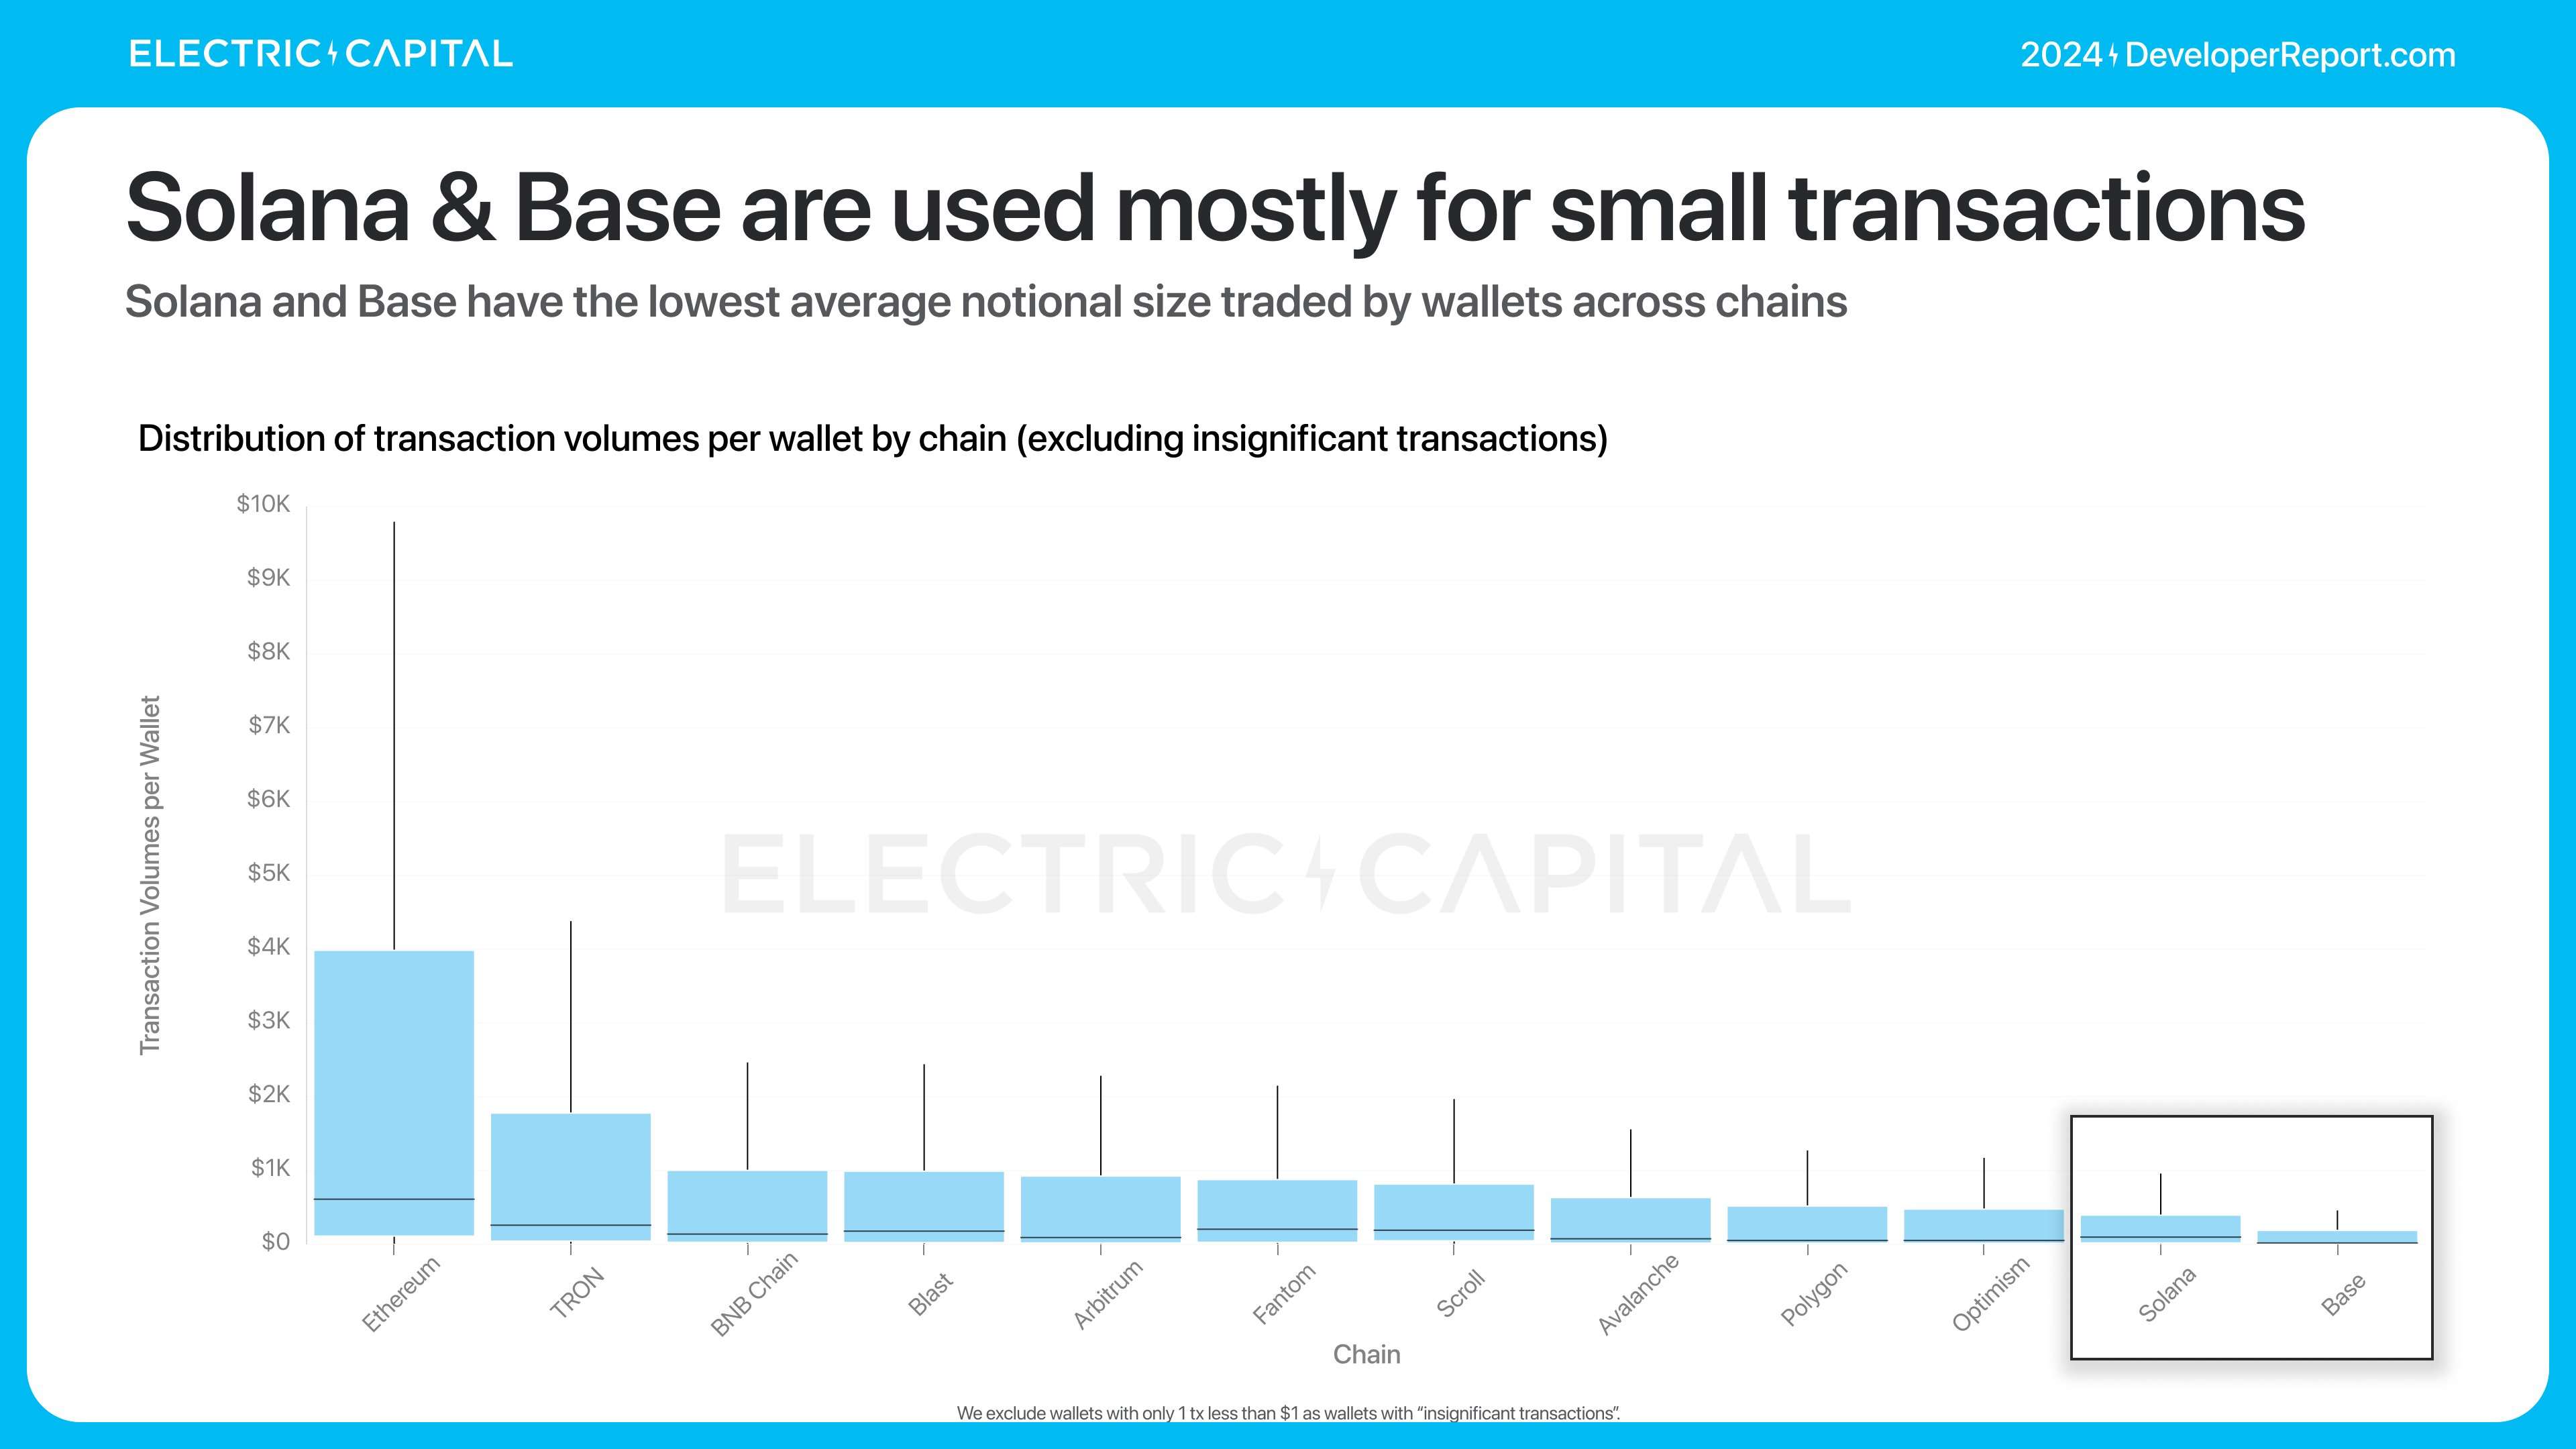
Ethereum is most popular for high-value transfers. Wallets on Ethereum have the largest average transaction amounts.

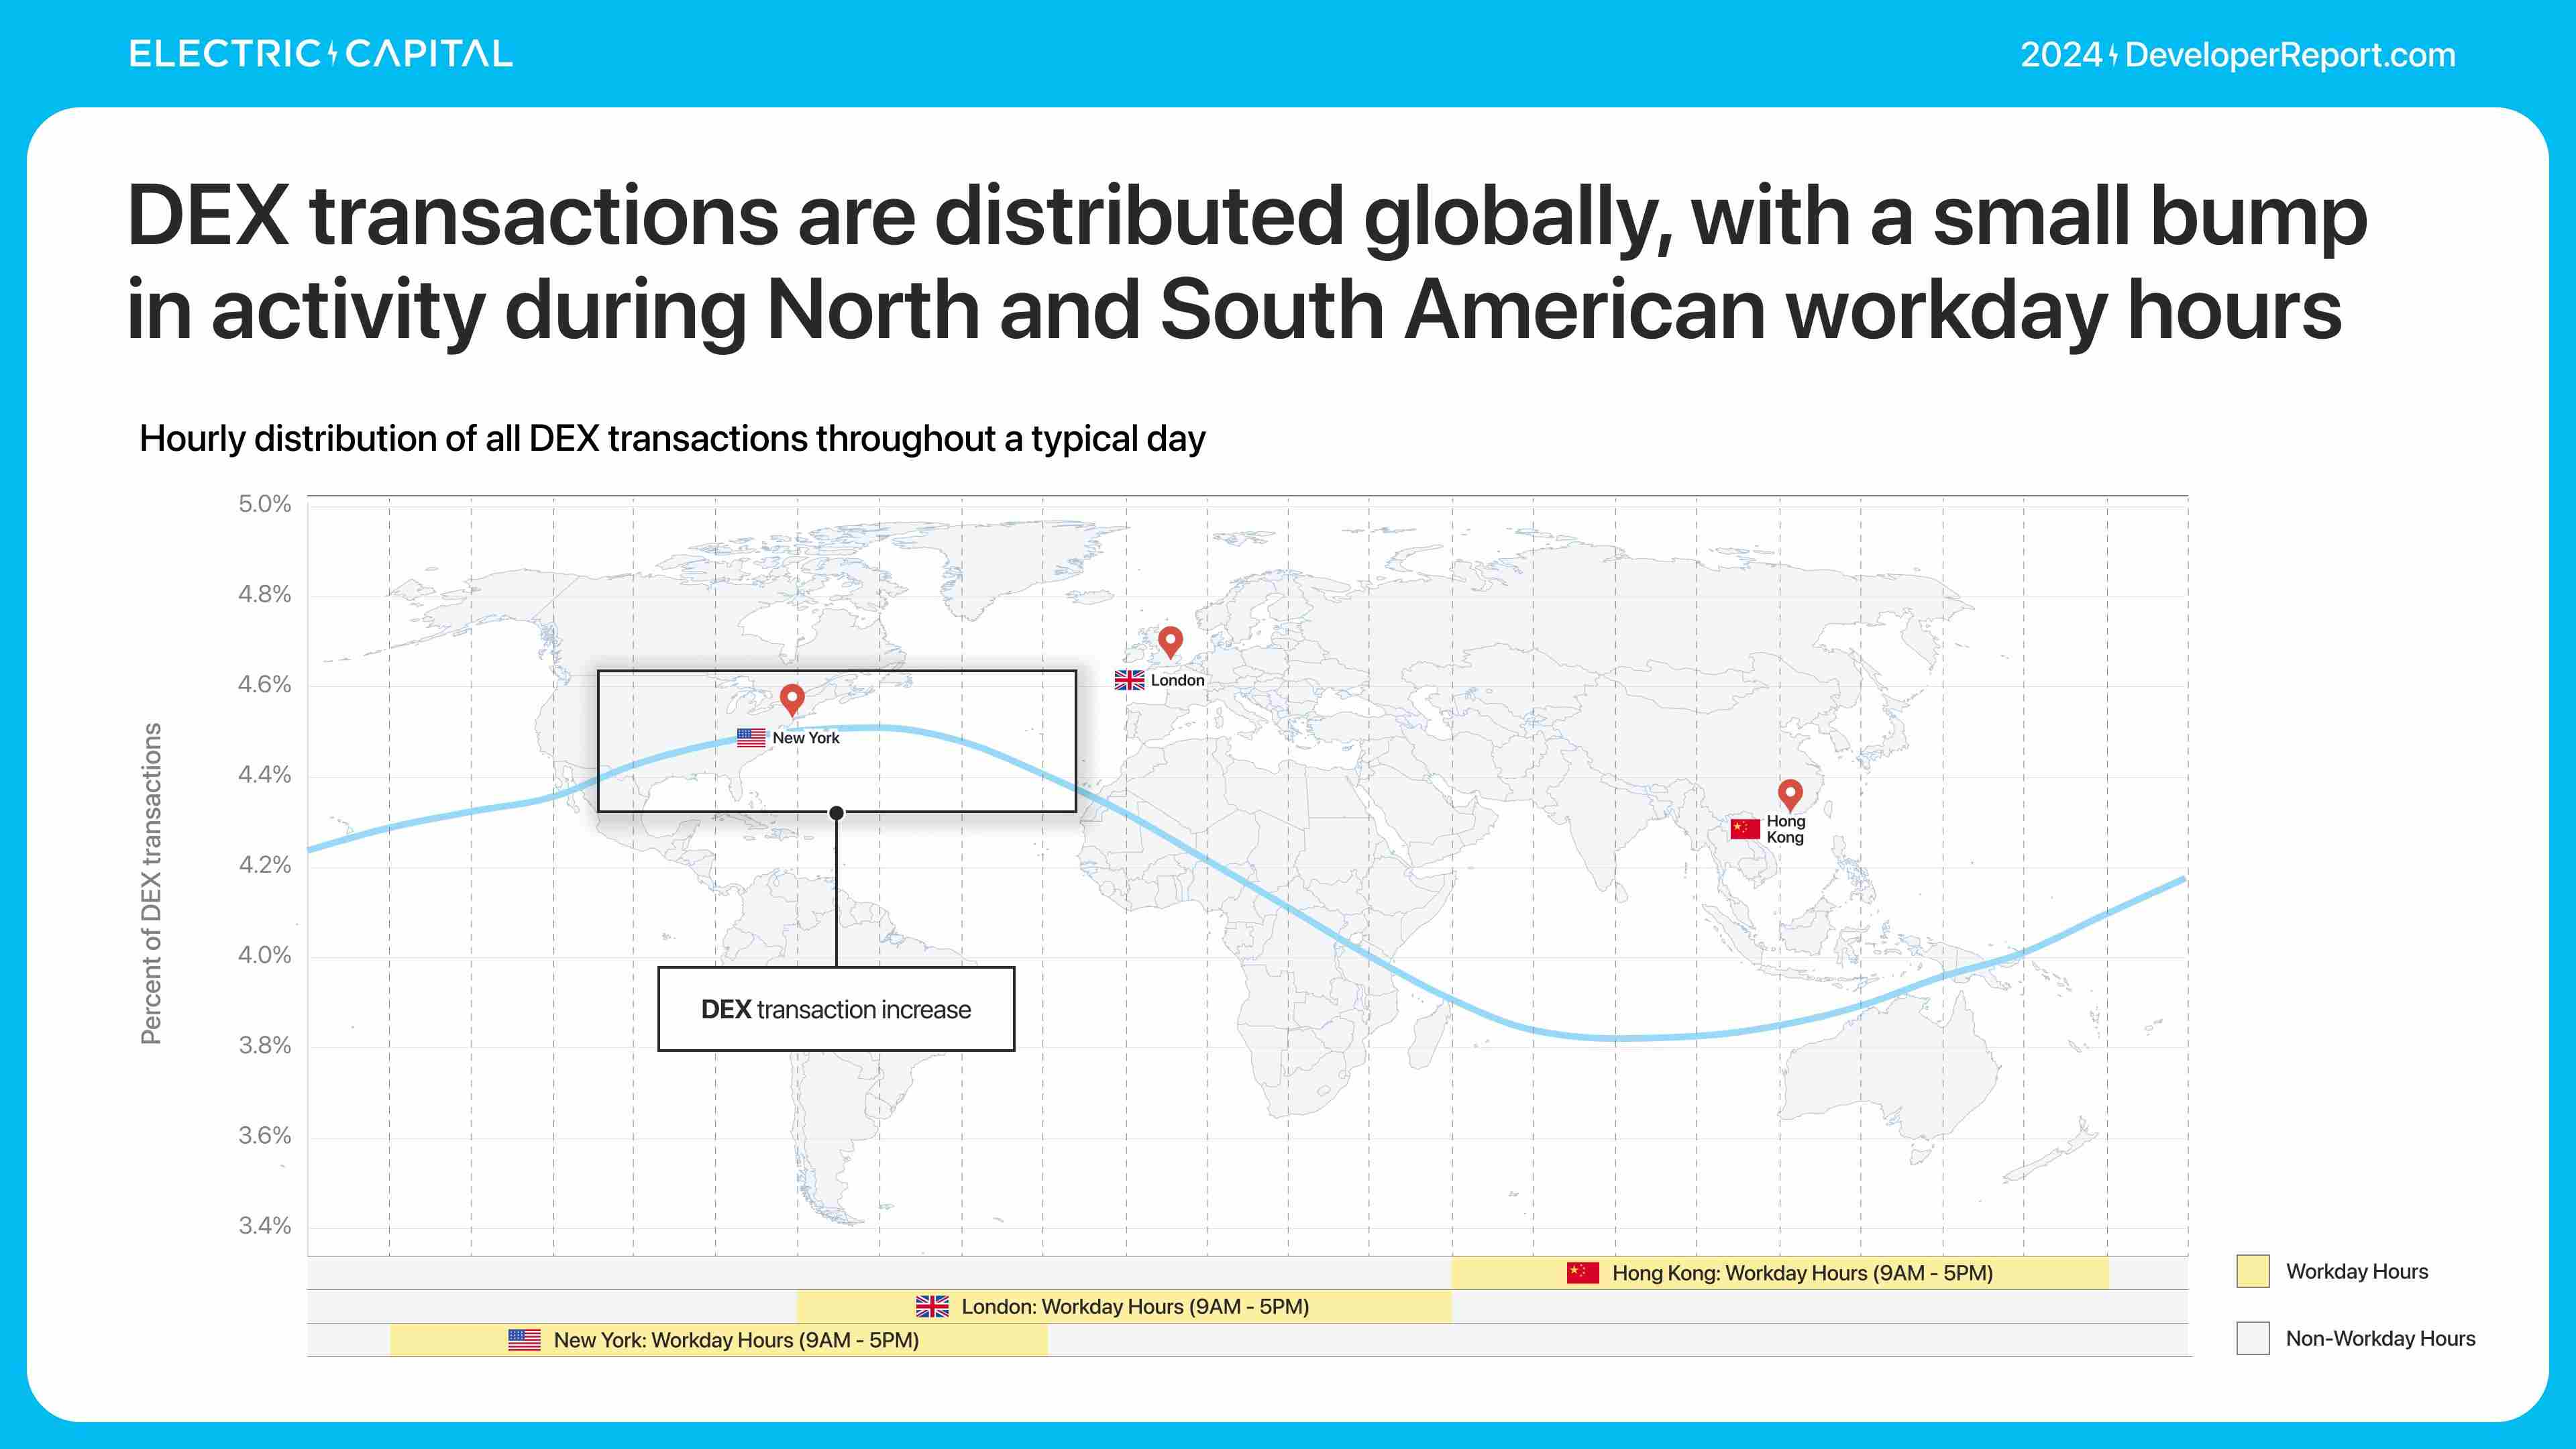
Where are these DEX users located? We can understand DeFi usage through DEXs, as financial activity often starts or ends there.
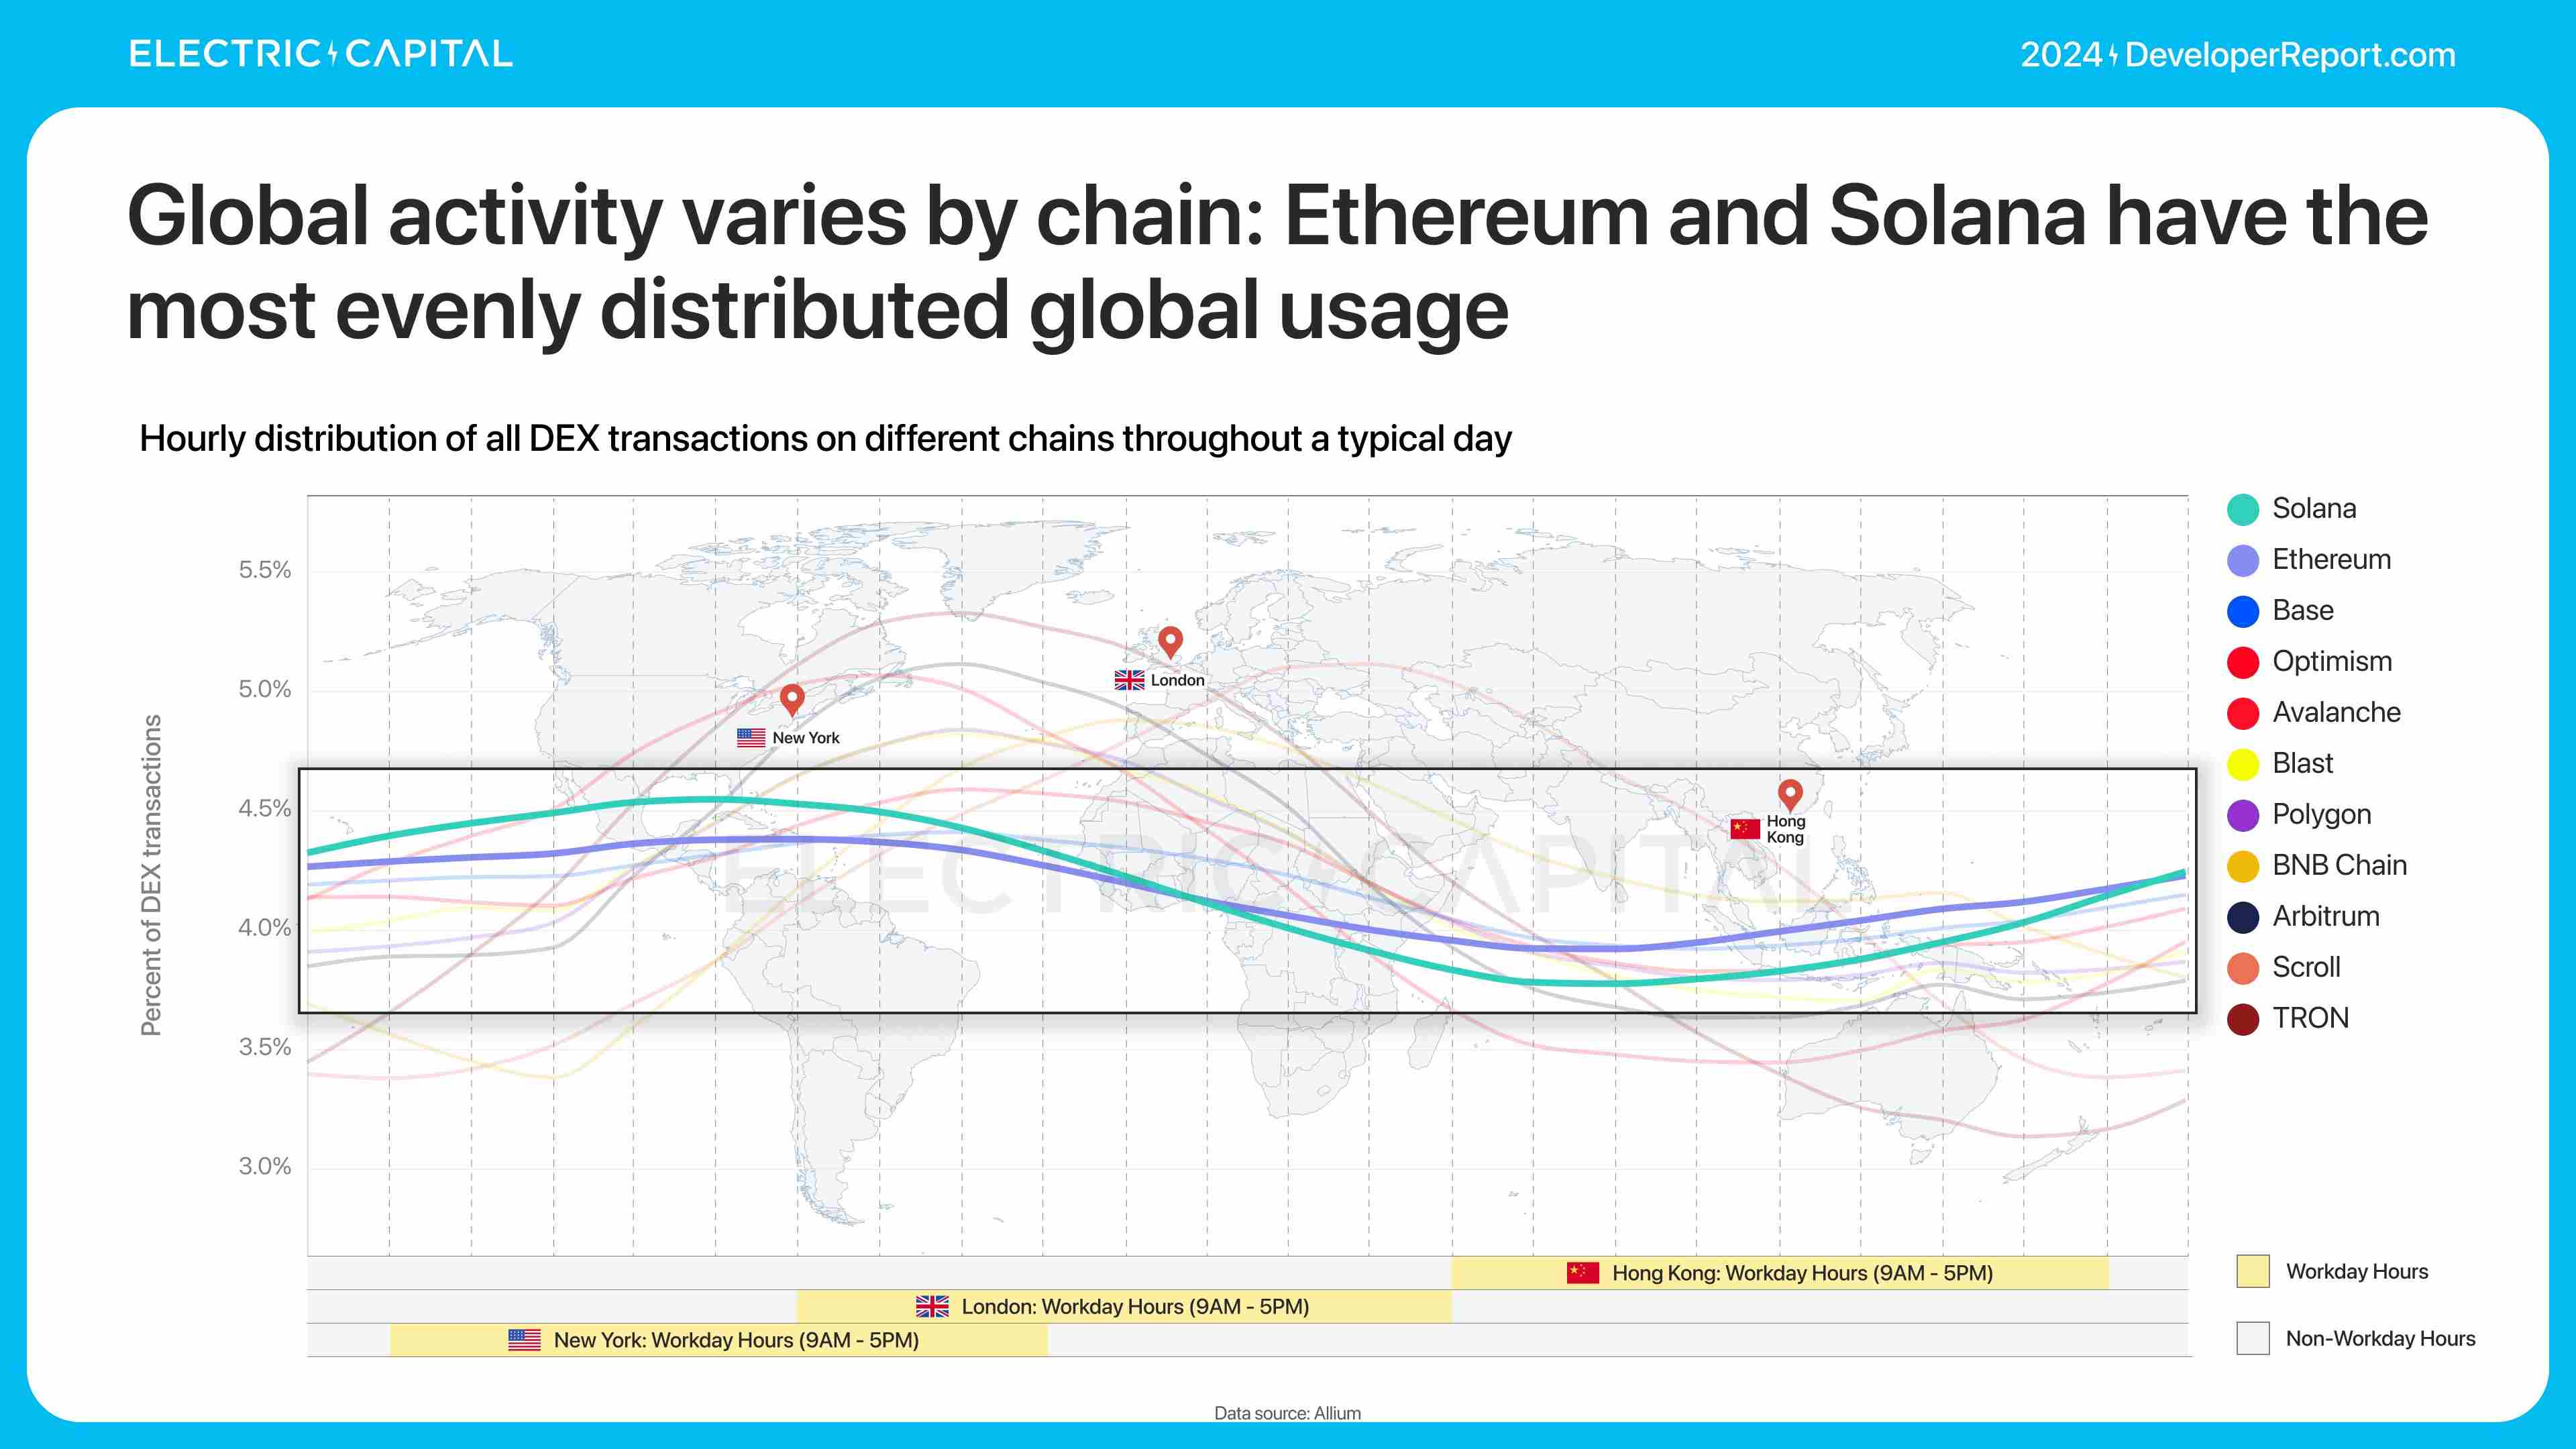
Global activity distribution varies across chains—the more evenly distributed, the more globally adopted. Ethereum and Solana have the most even usage distribution.
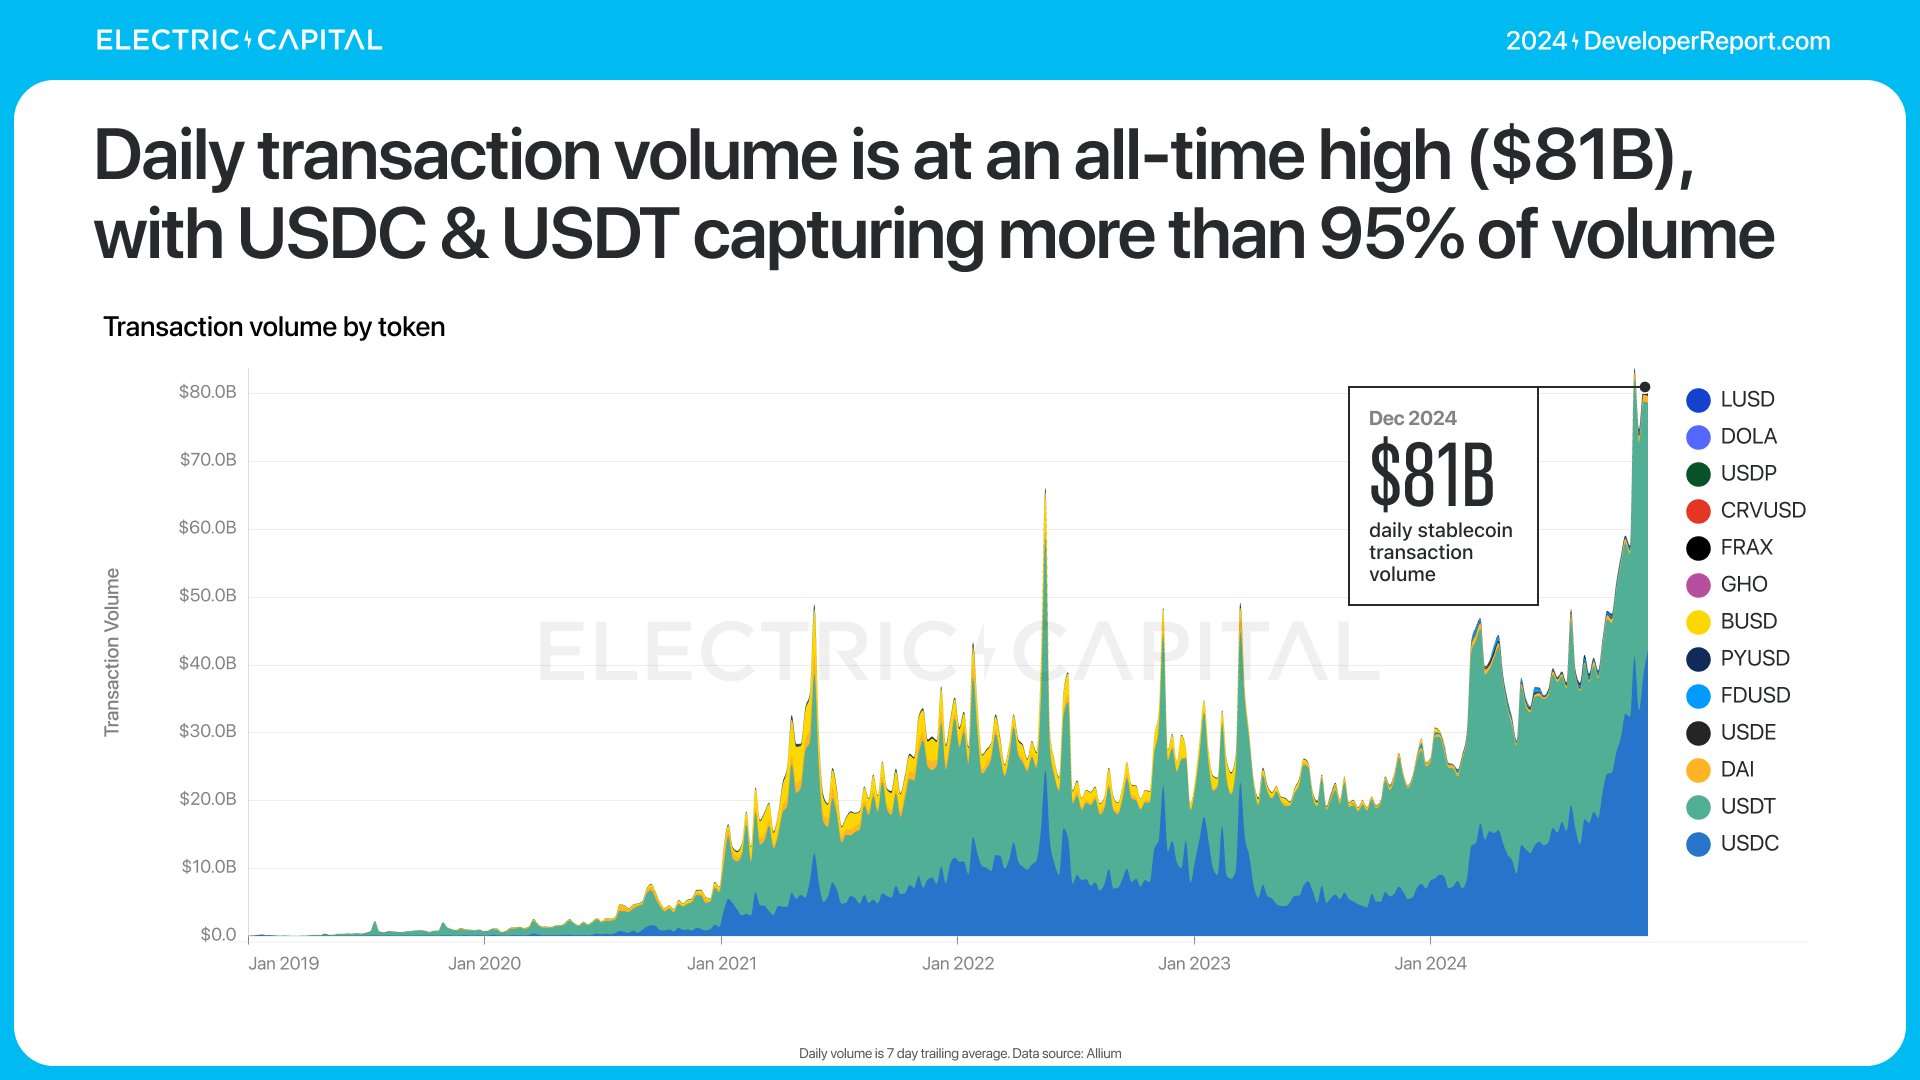
Stablecoins are one of the largest global crypto use cases. How are stablecoins performing? Stablecoin usage reached an all-time high: $196 billion in circulation and $81 billion in daily trading volume—both record highs.
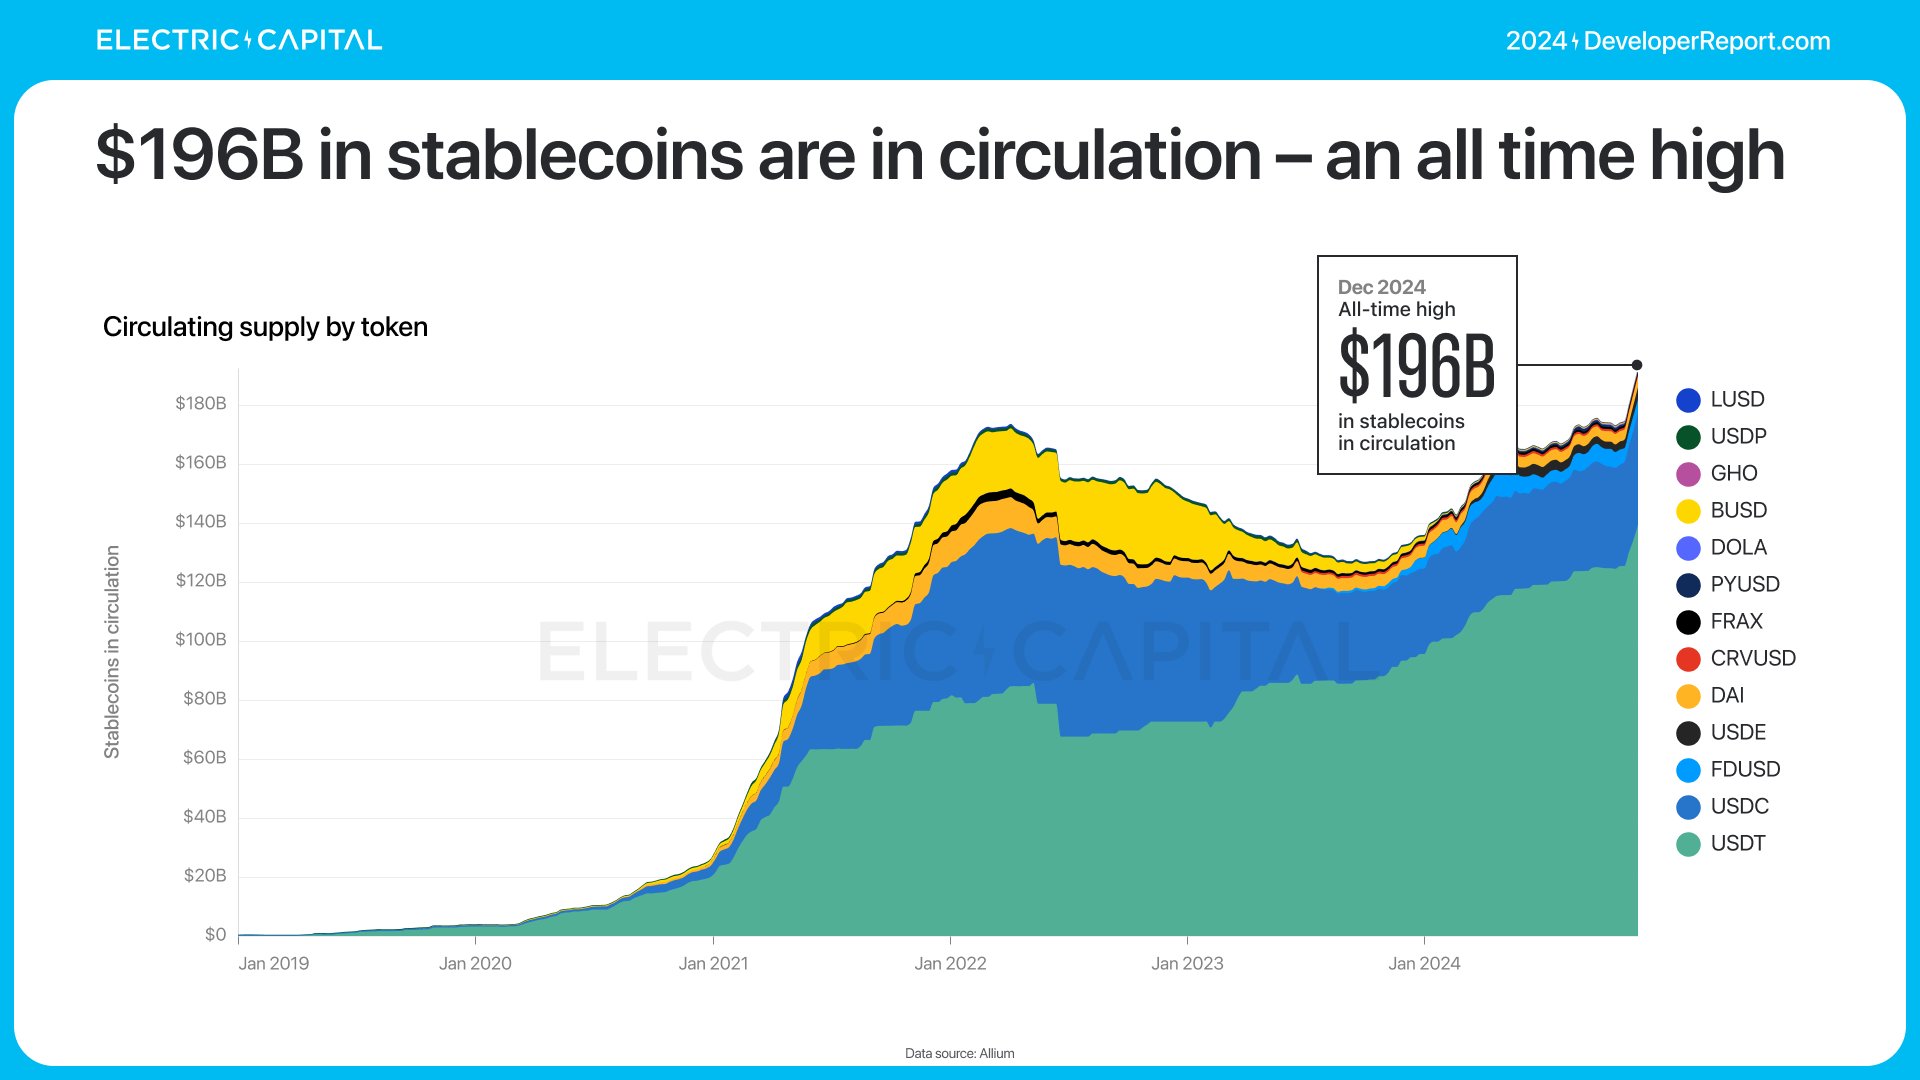
USDC and USDT account for 95% of trading volume.
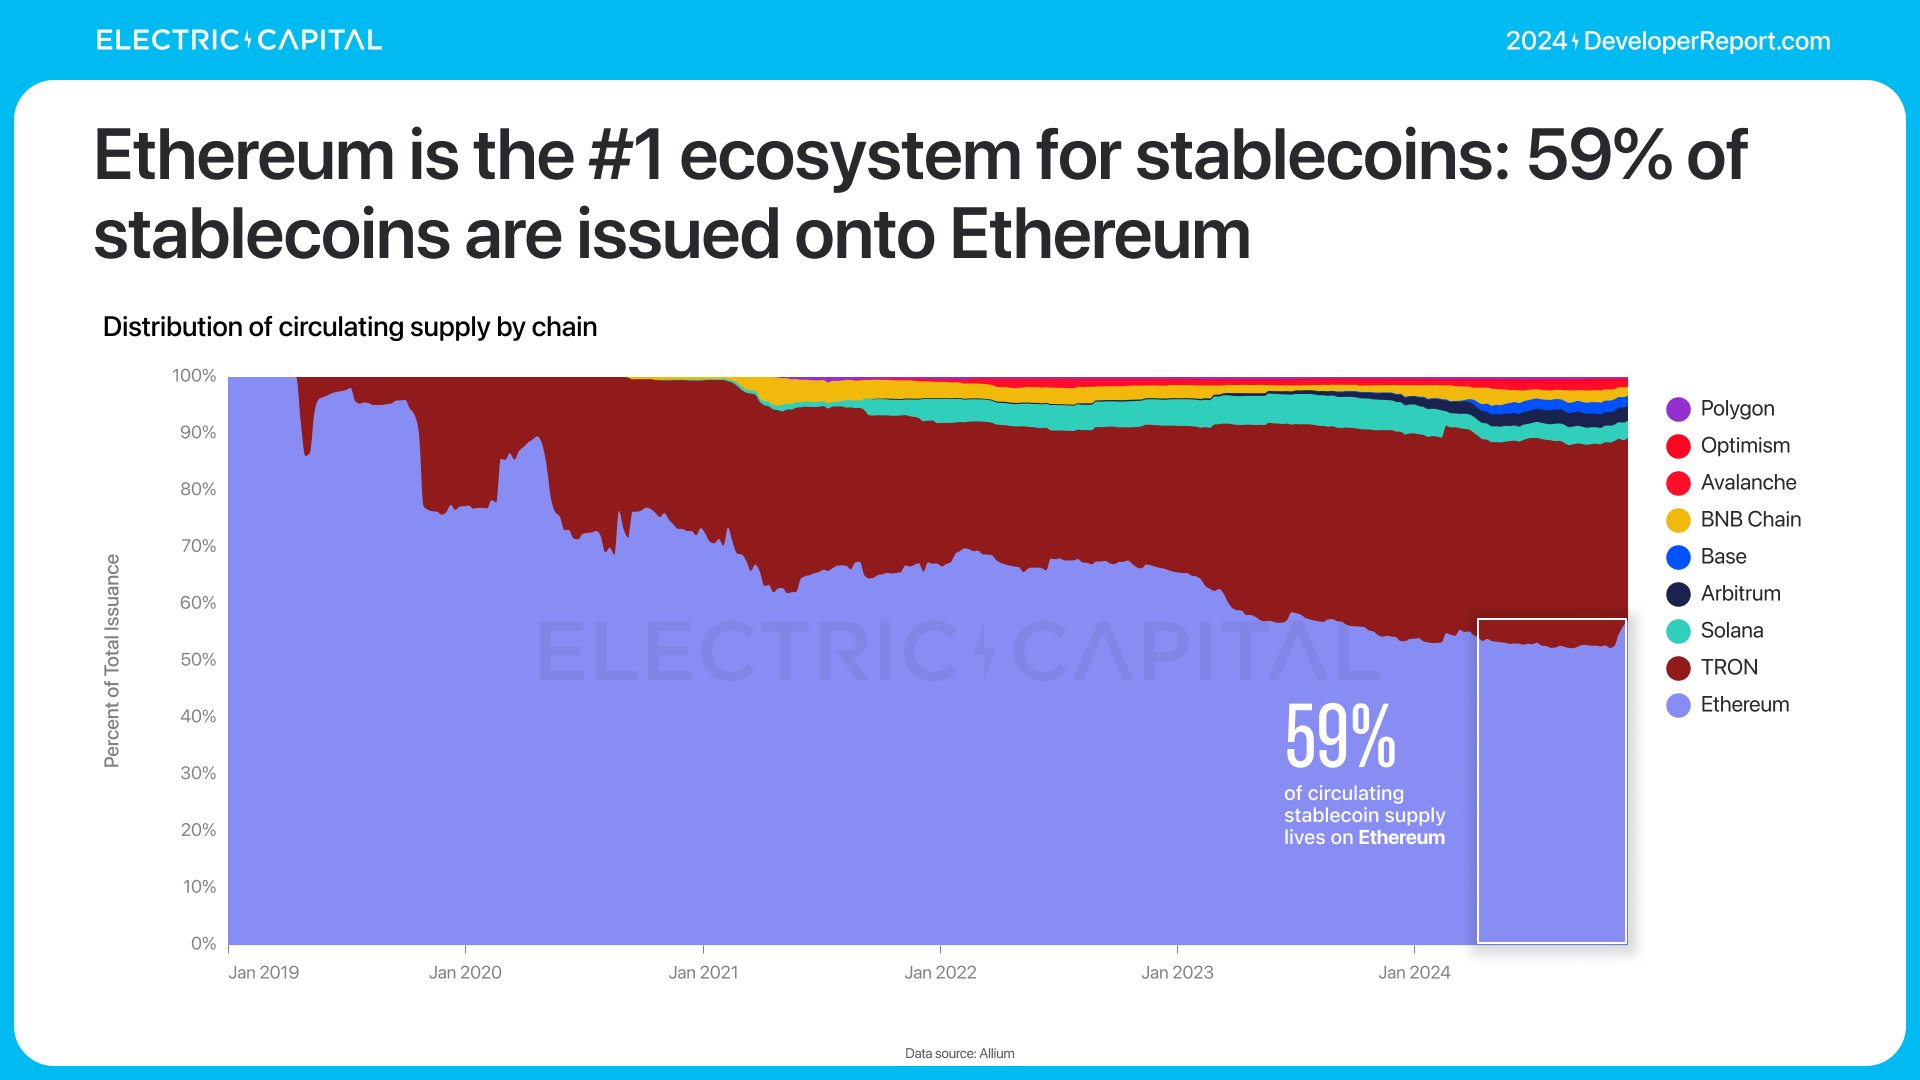
Ethereum was the first stablecoin ecosystem—59% of stablecoins are issued on Ethereum.
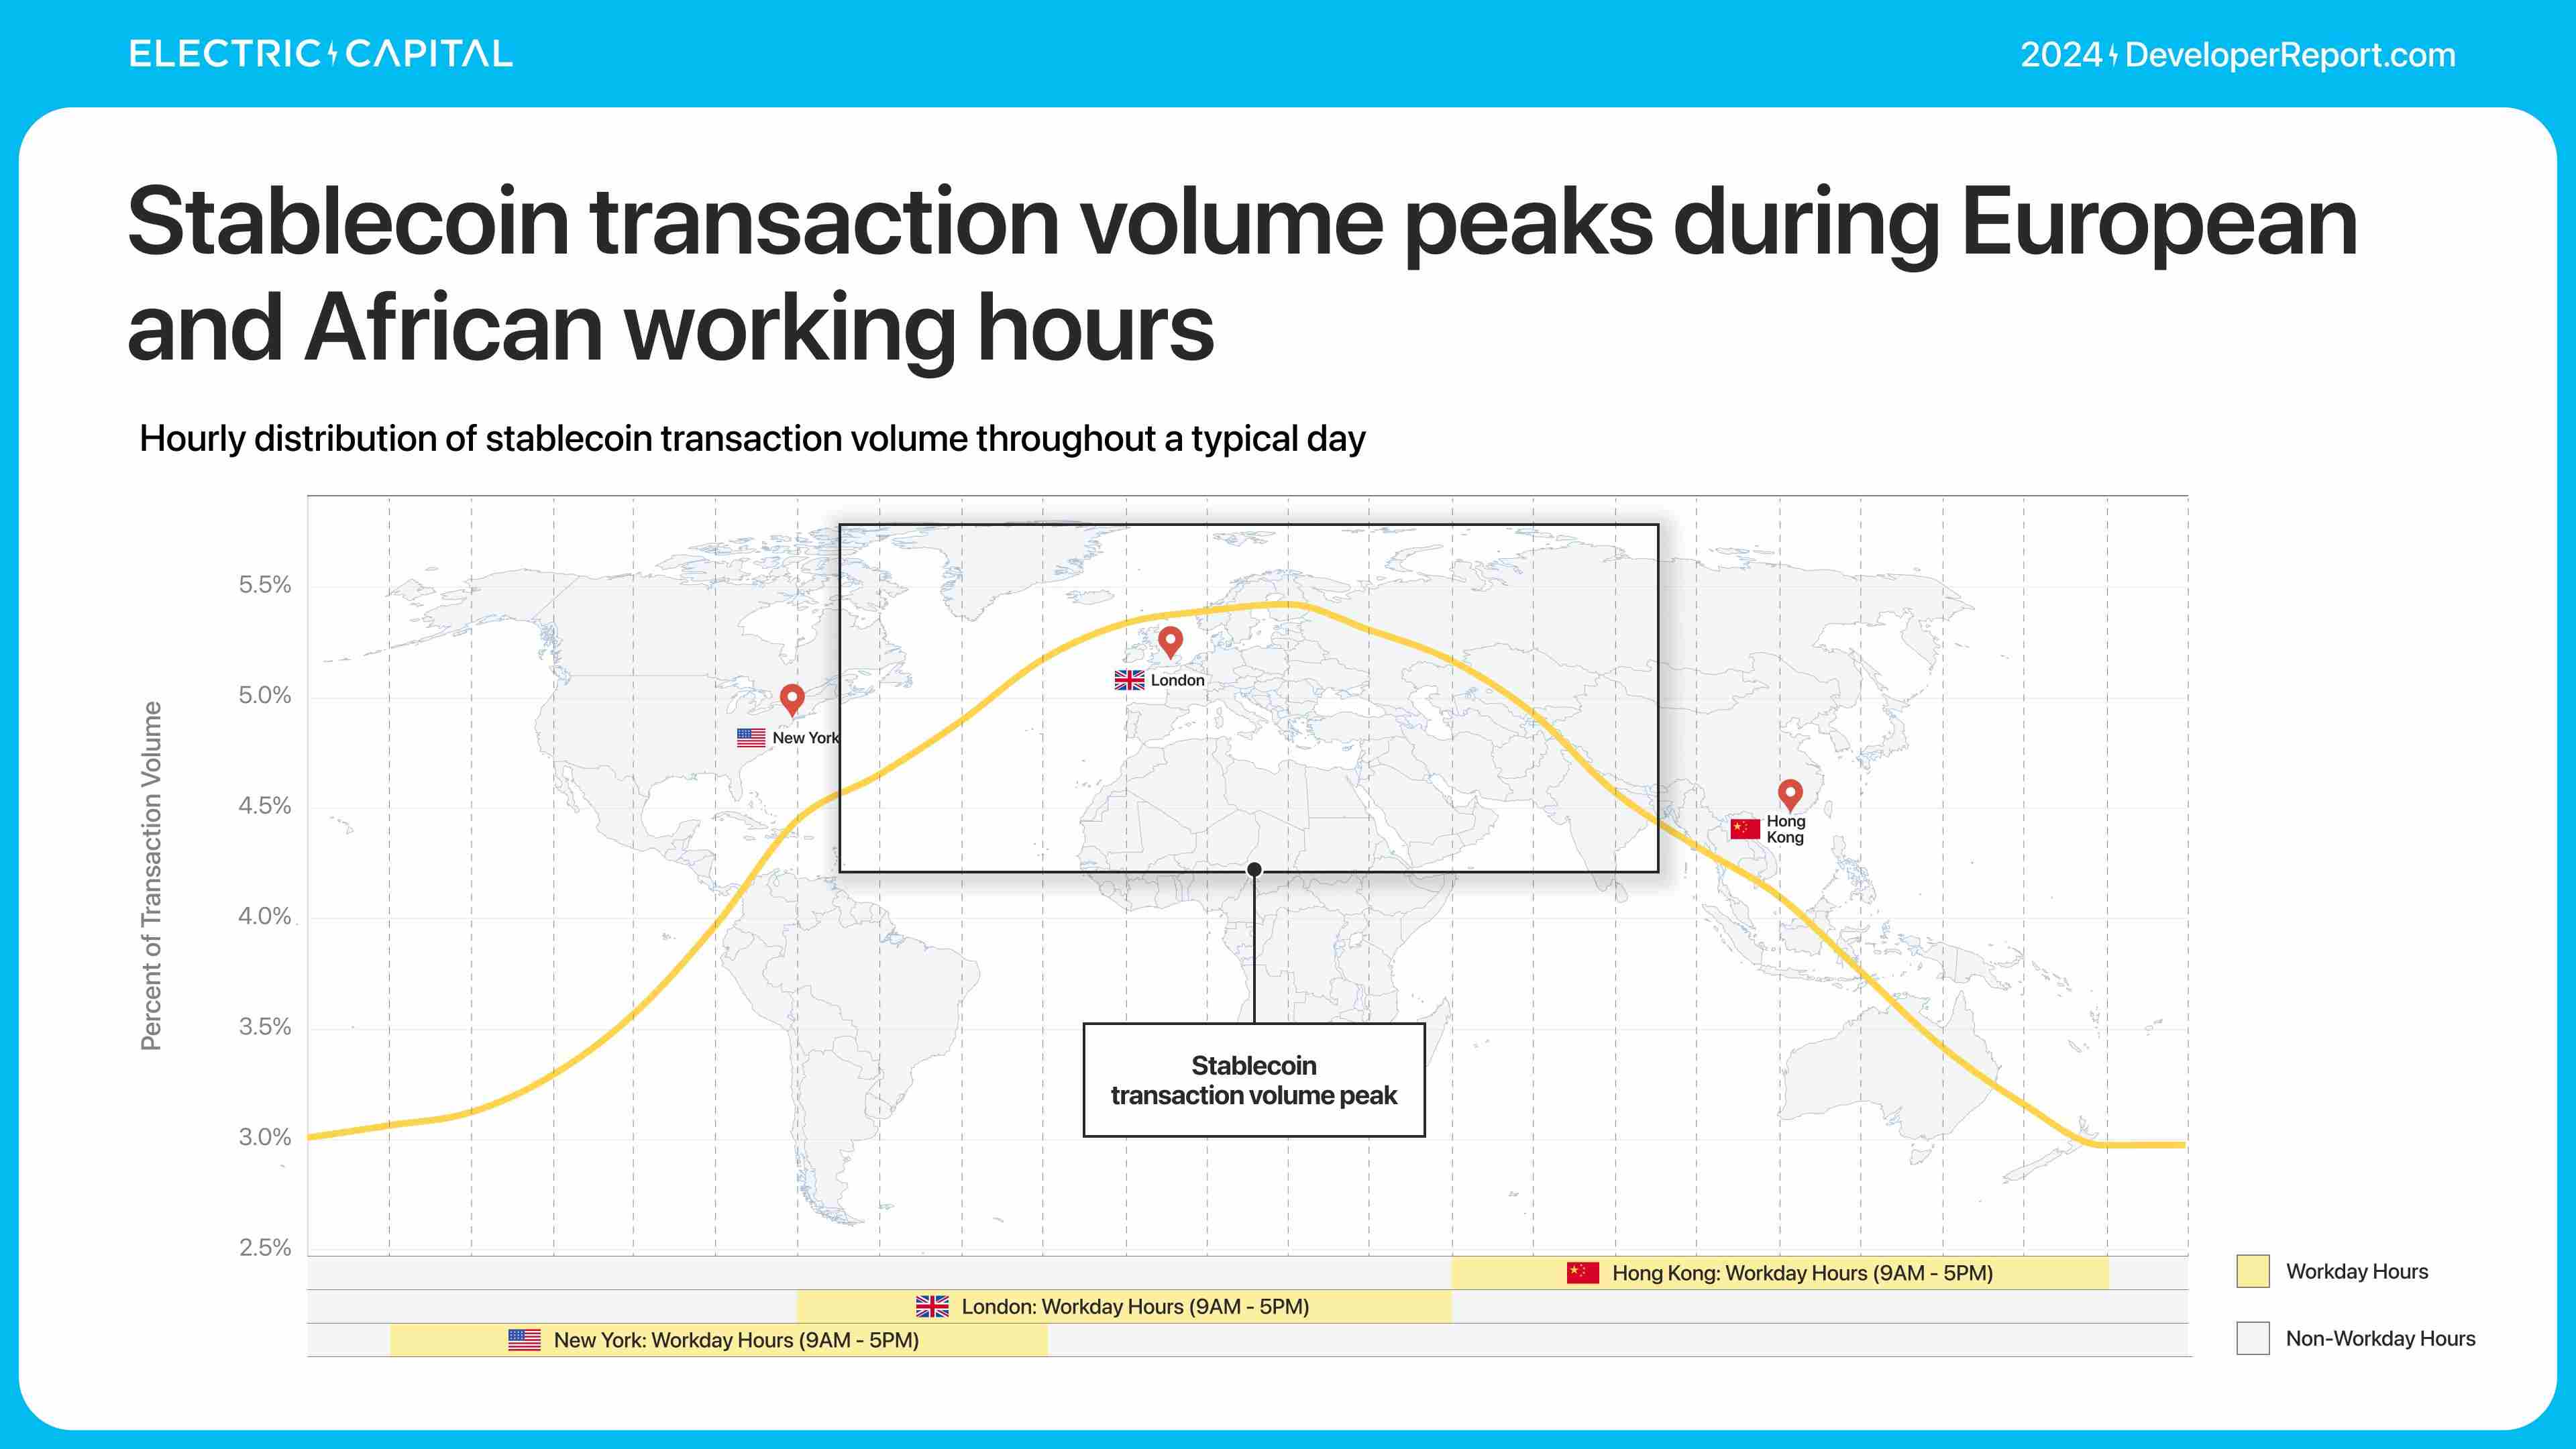
How is stablecoin activity distributed globally?
Stablecoin activity is constant, but volume increases by 2–3% during working hours in Asia, Europe, and Africa.

Although stablecoin trading peaks during Eastern Hemisphere business hours, volume skews toward the Western Hemisphere.
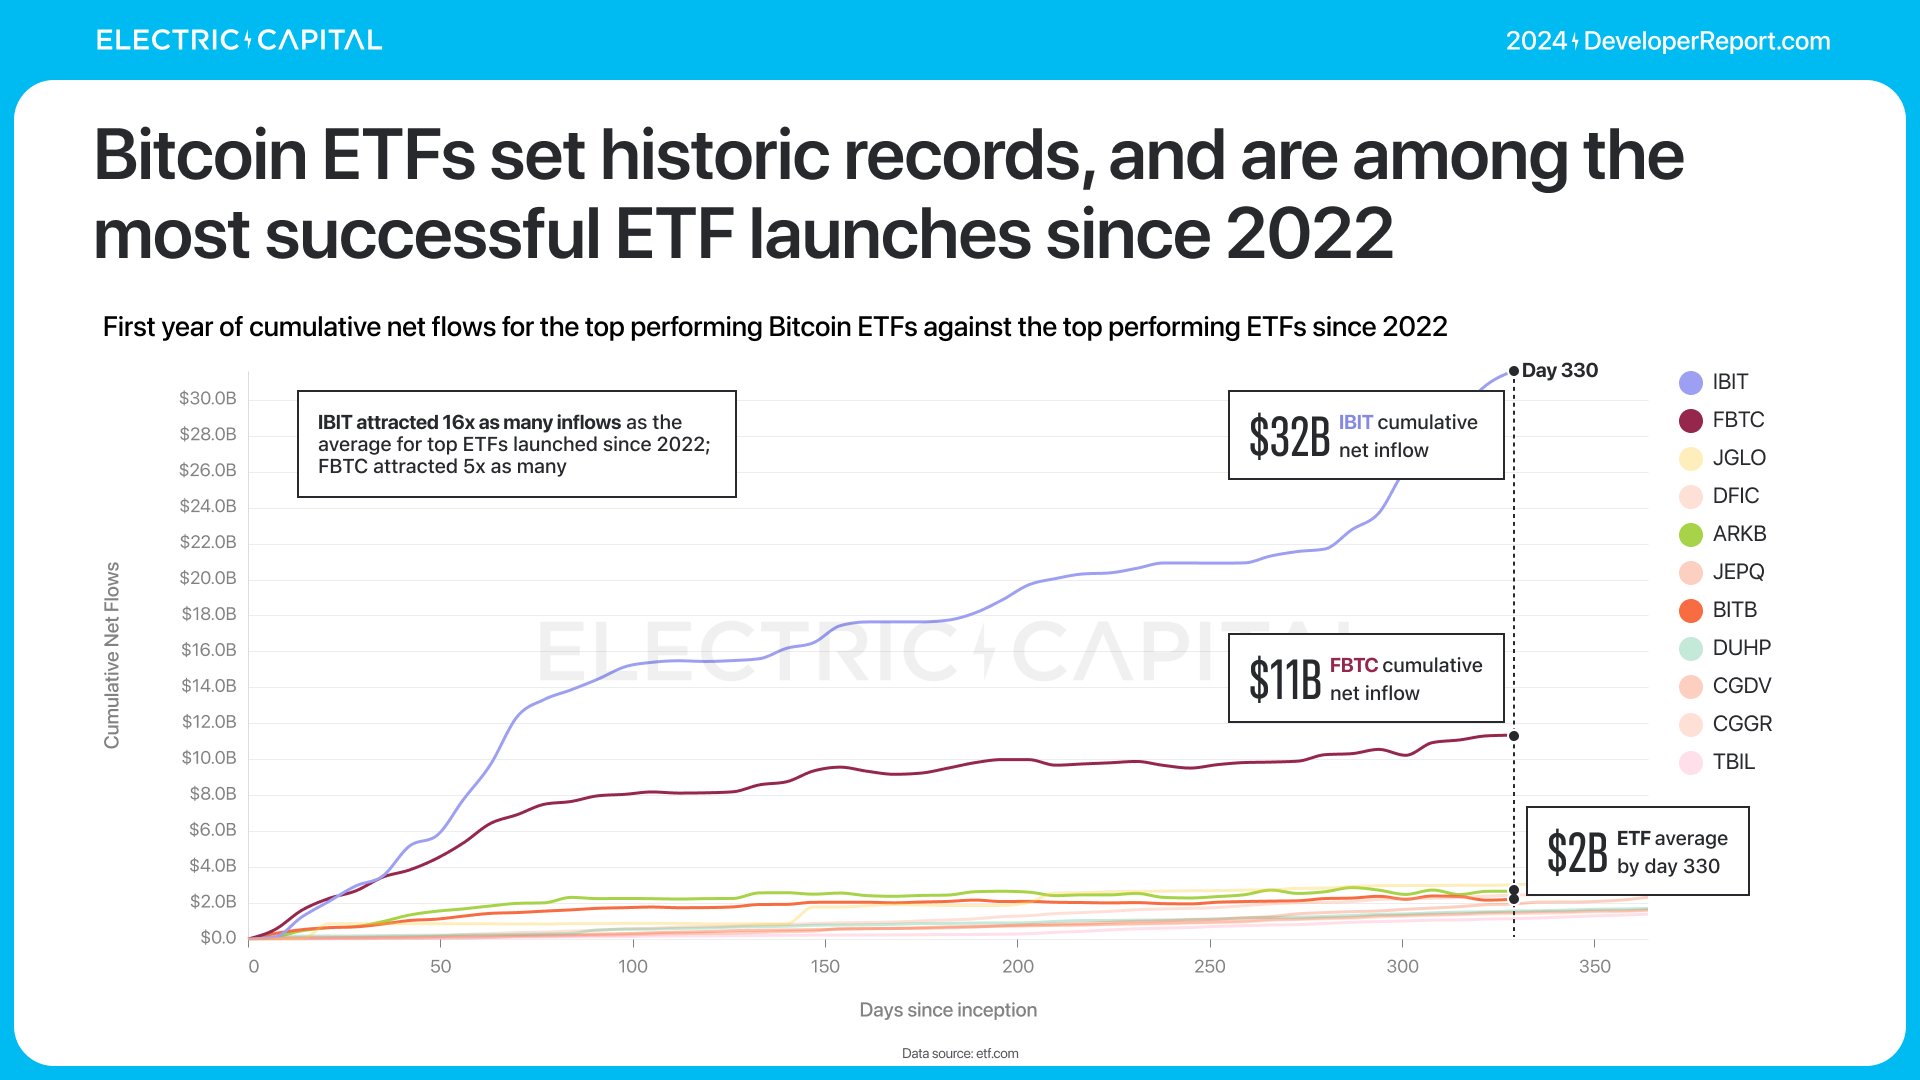
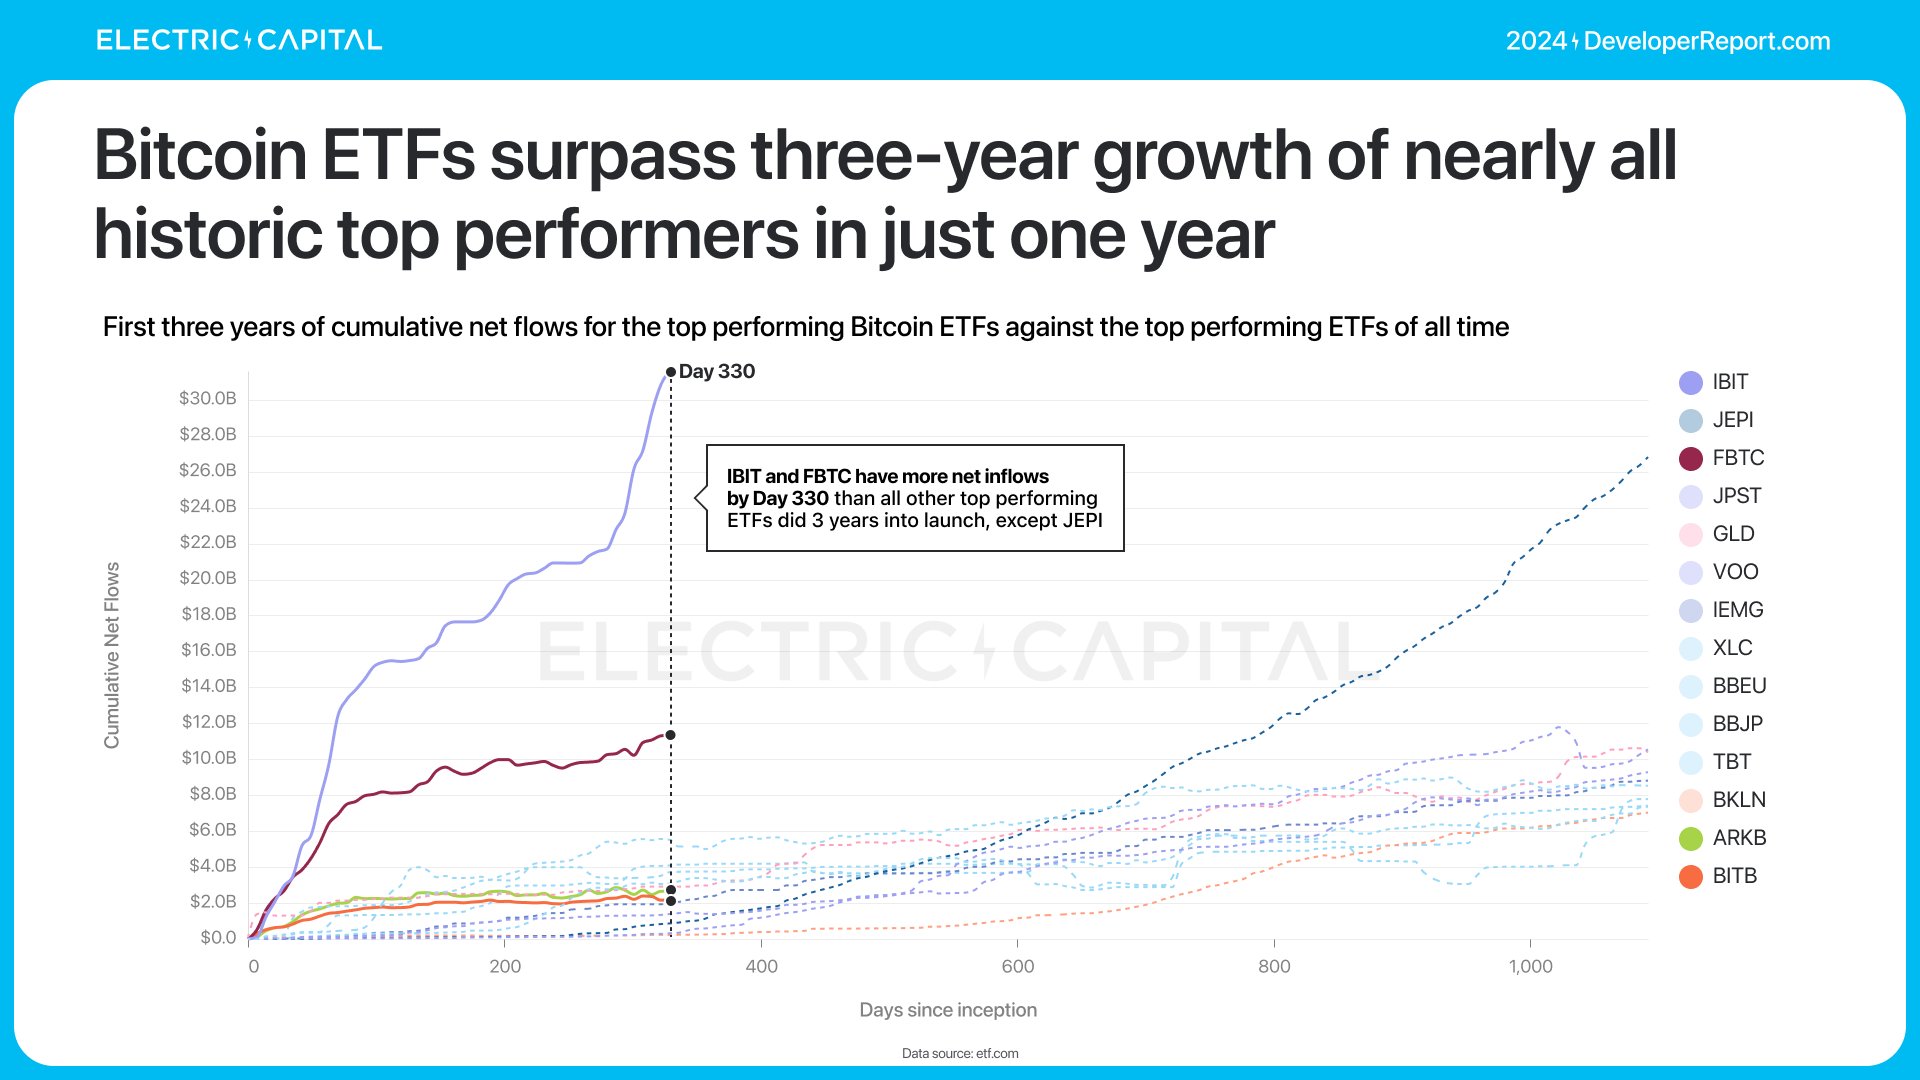
Bitcoin and Ethereum ETFs launched this year, offering off-ramp investors easy access to on-chain assets. Bitcoin ETFs attracted over $50 billion in net inflows, becoming one of the most successful ETF launches in history.
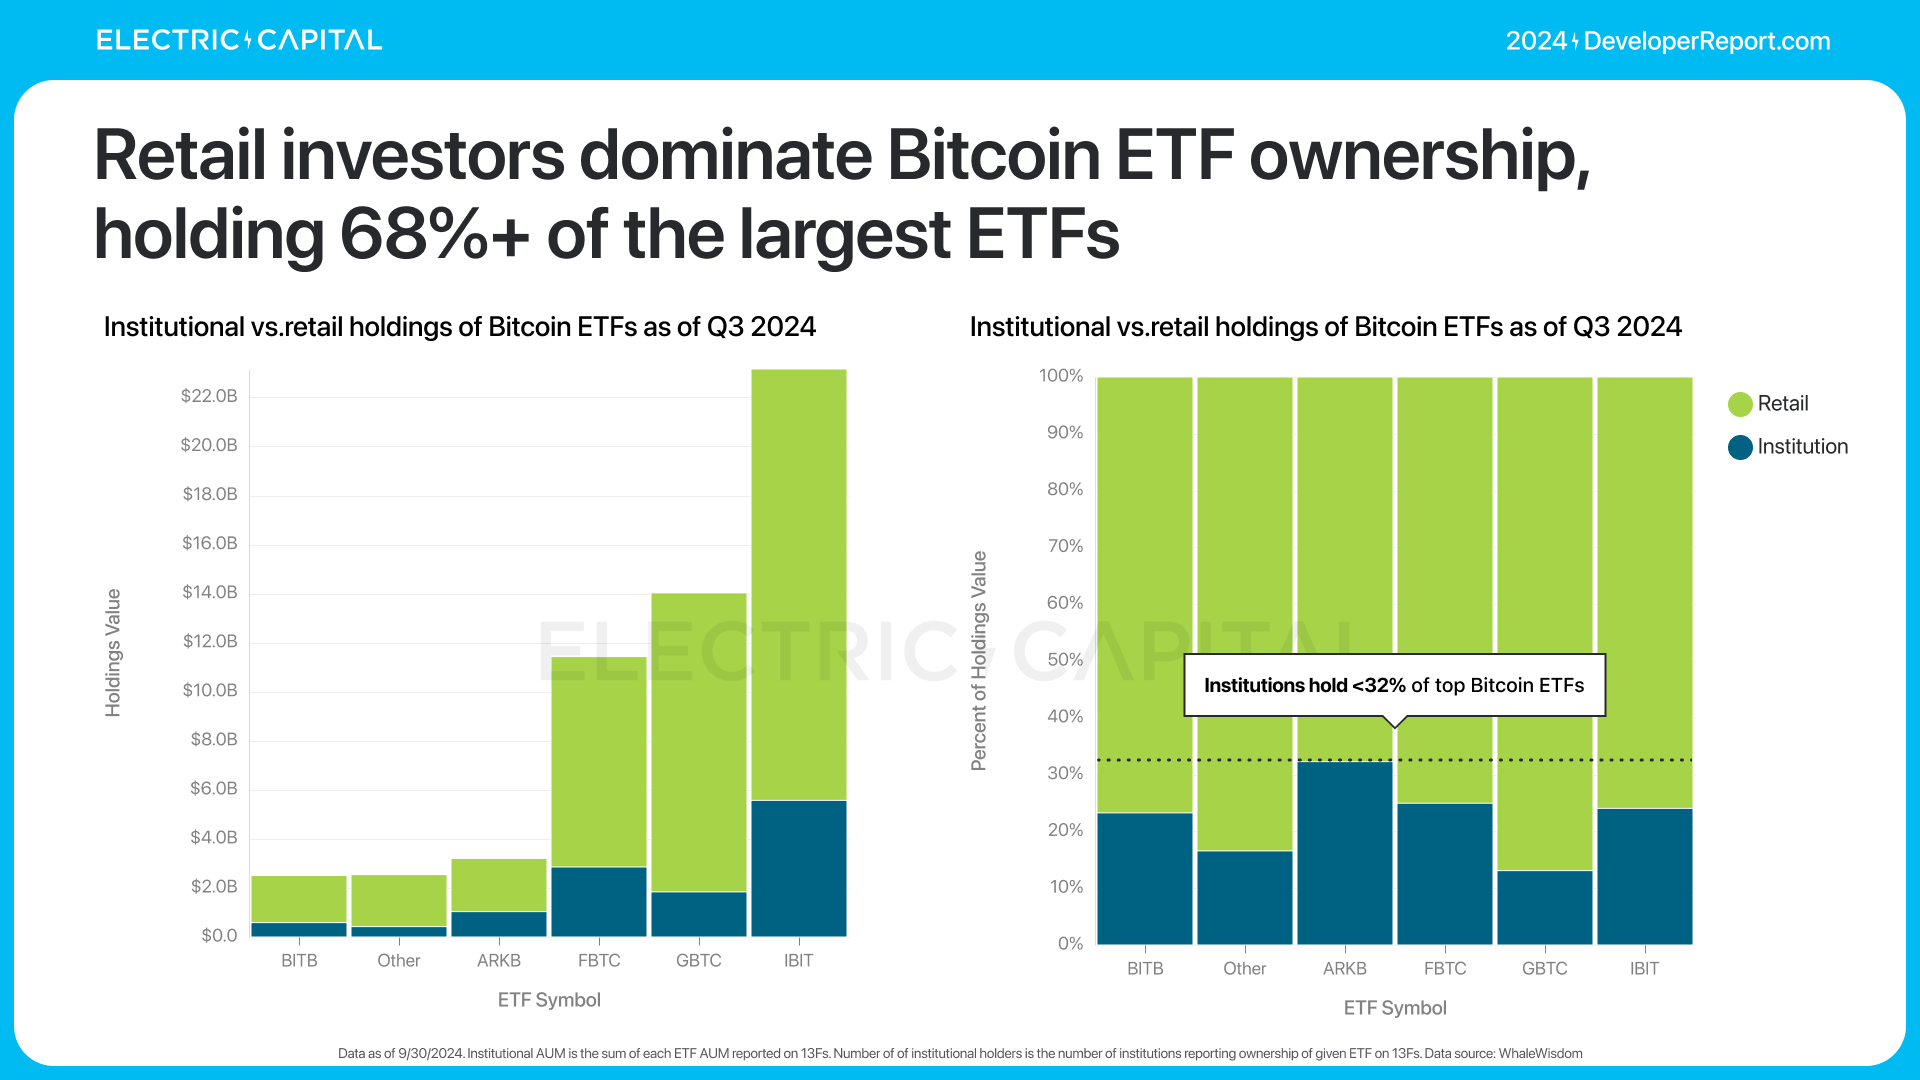
Most Bitcoin ETF trading volume comes from retail investors.
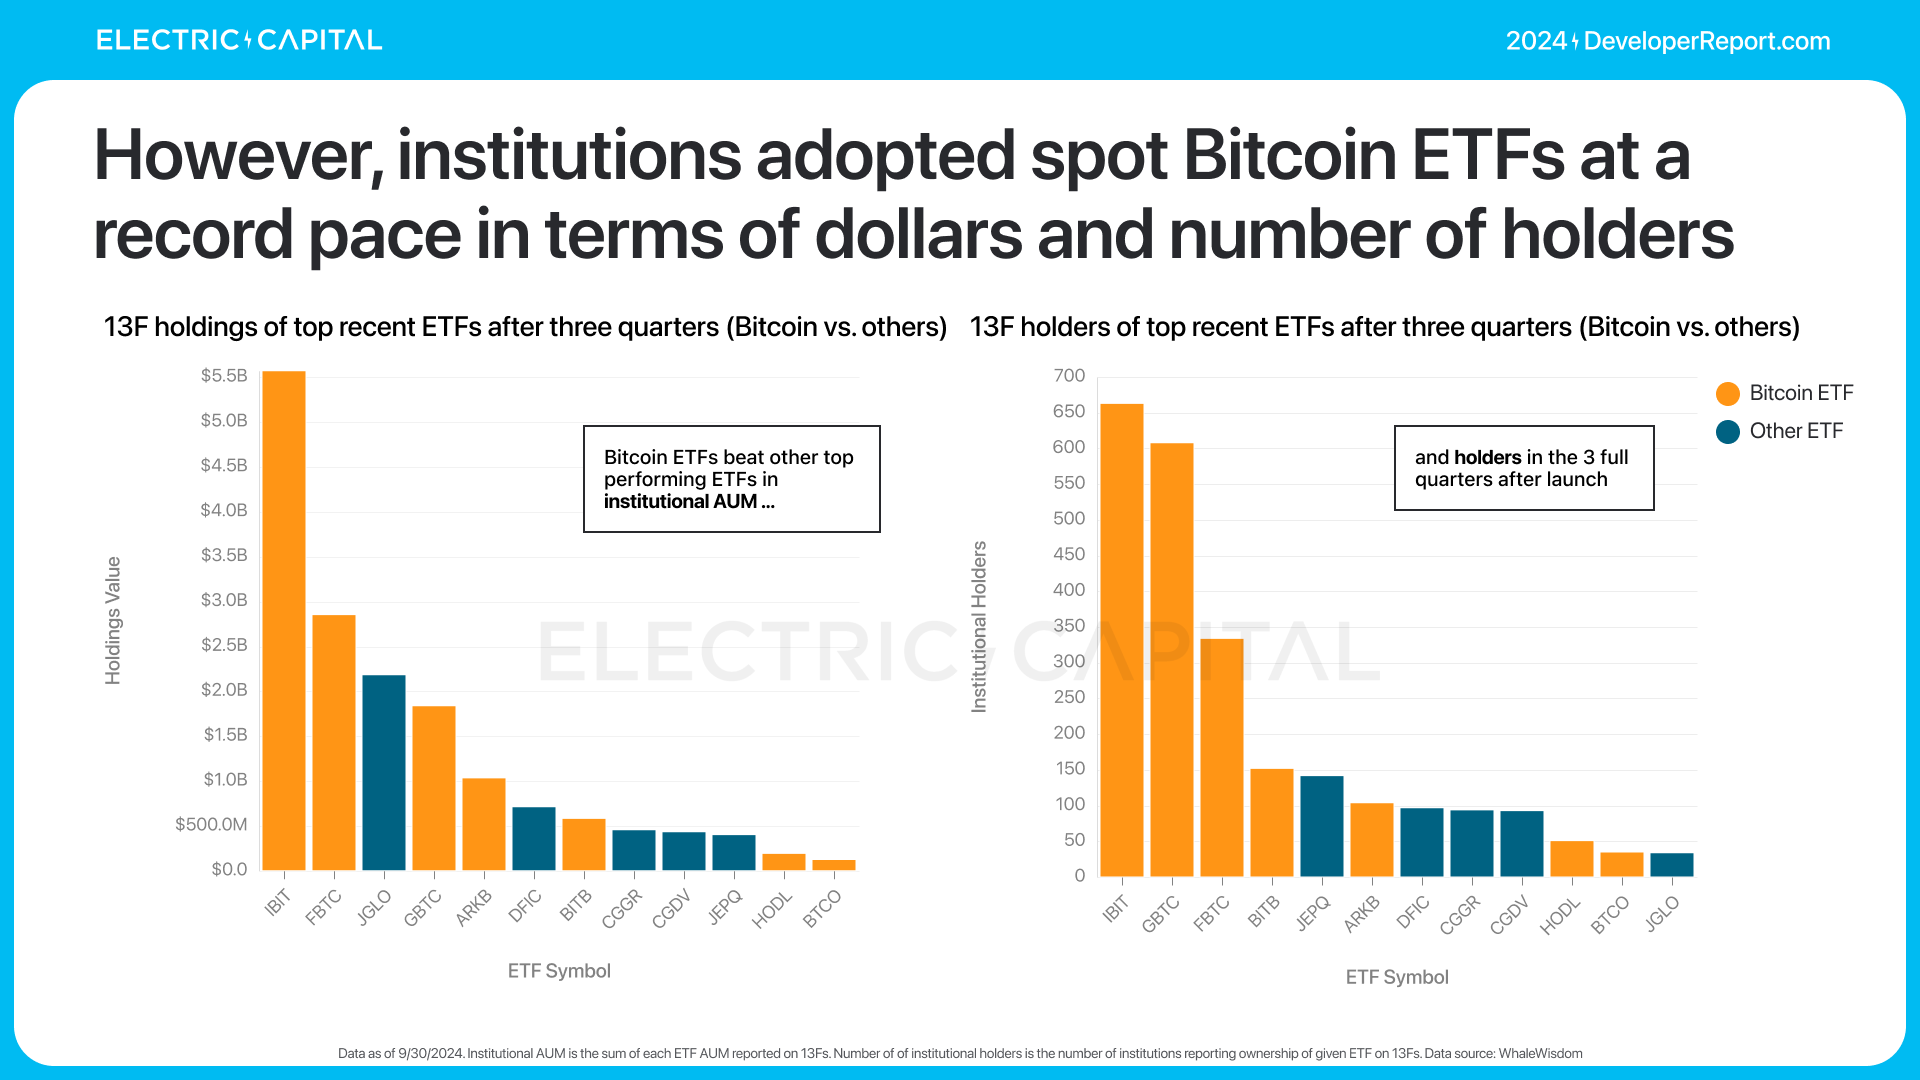
Although Bitcoin ETFs are still early, institutional investors continue buying spot Bitcoin ETFs at record pace.
Ethereum ETFs launched in July this year. Currently, Ethereum ETFs manage $13 billion in AUM, attracting $3.5 billion in net inflows. This performance matches that of the most successful non-Bitcoin ETF launches since 2022. Retail investors are the primary drivers.

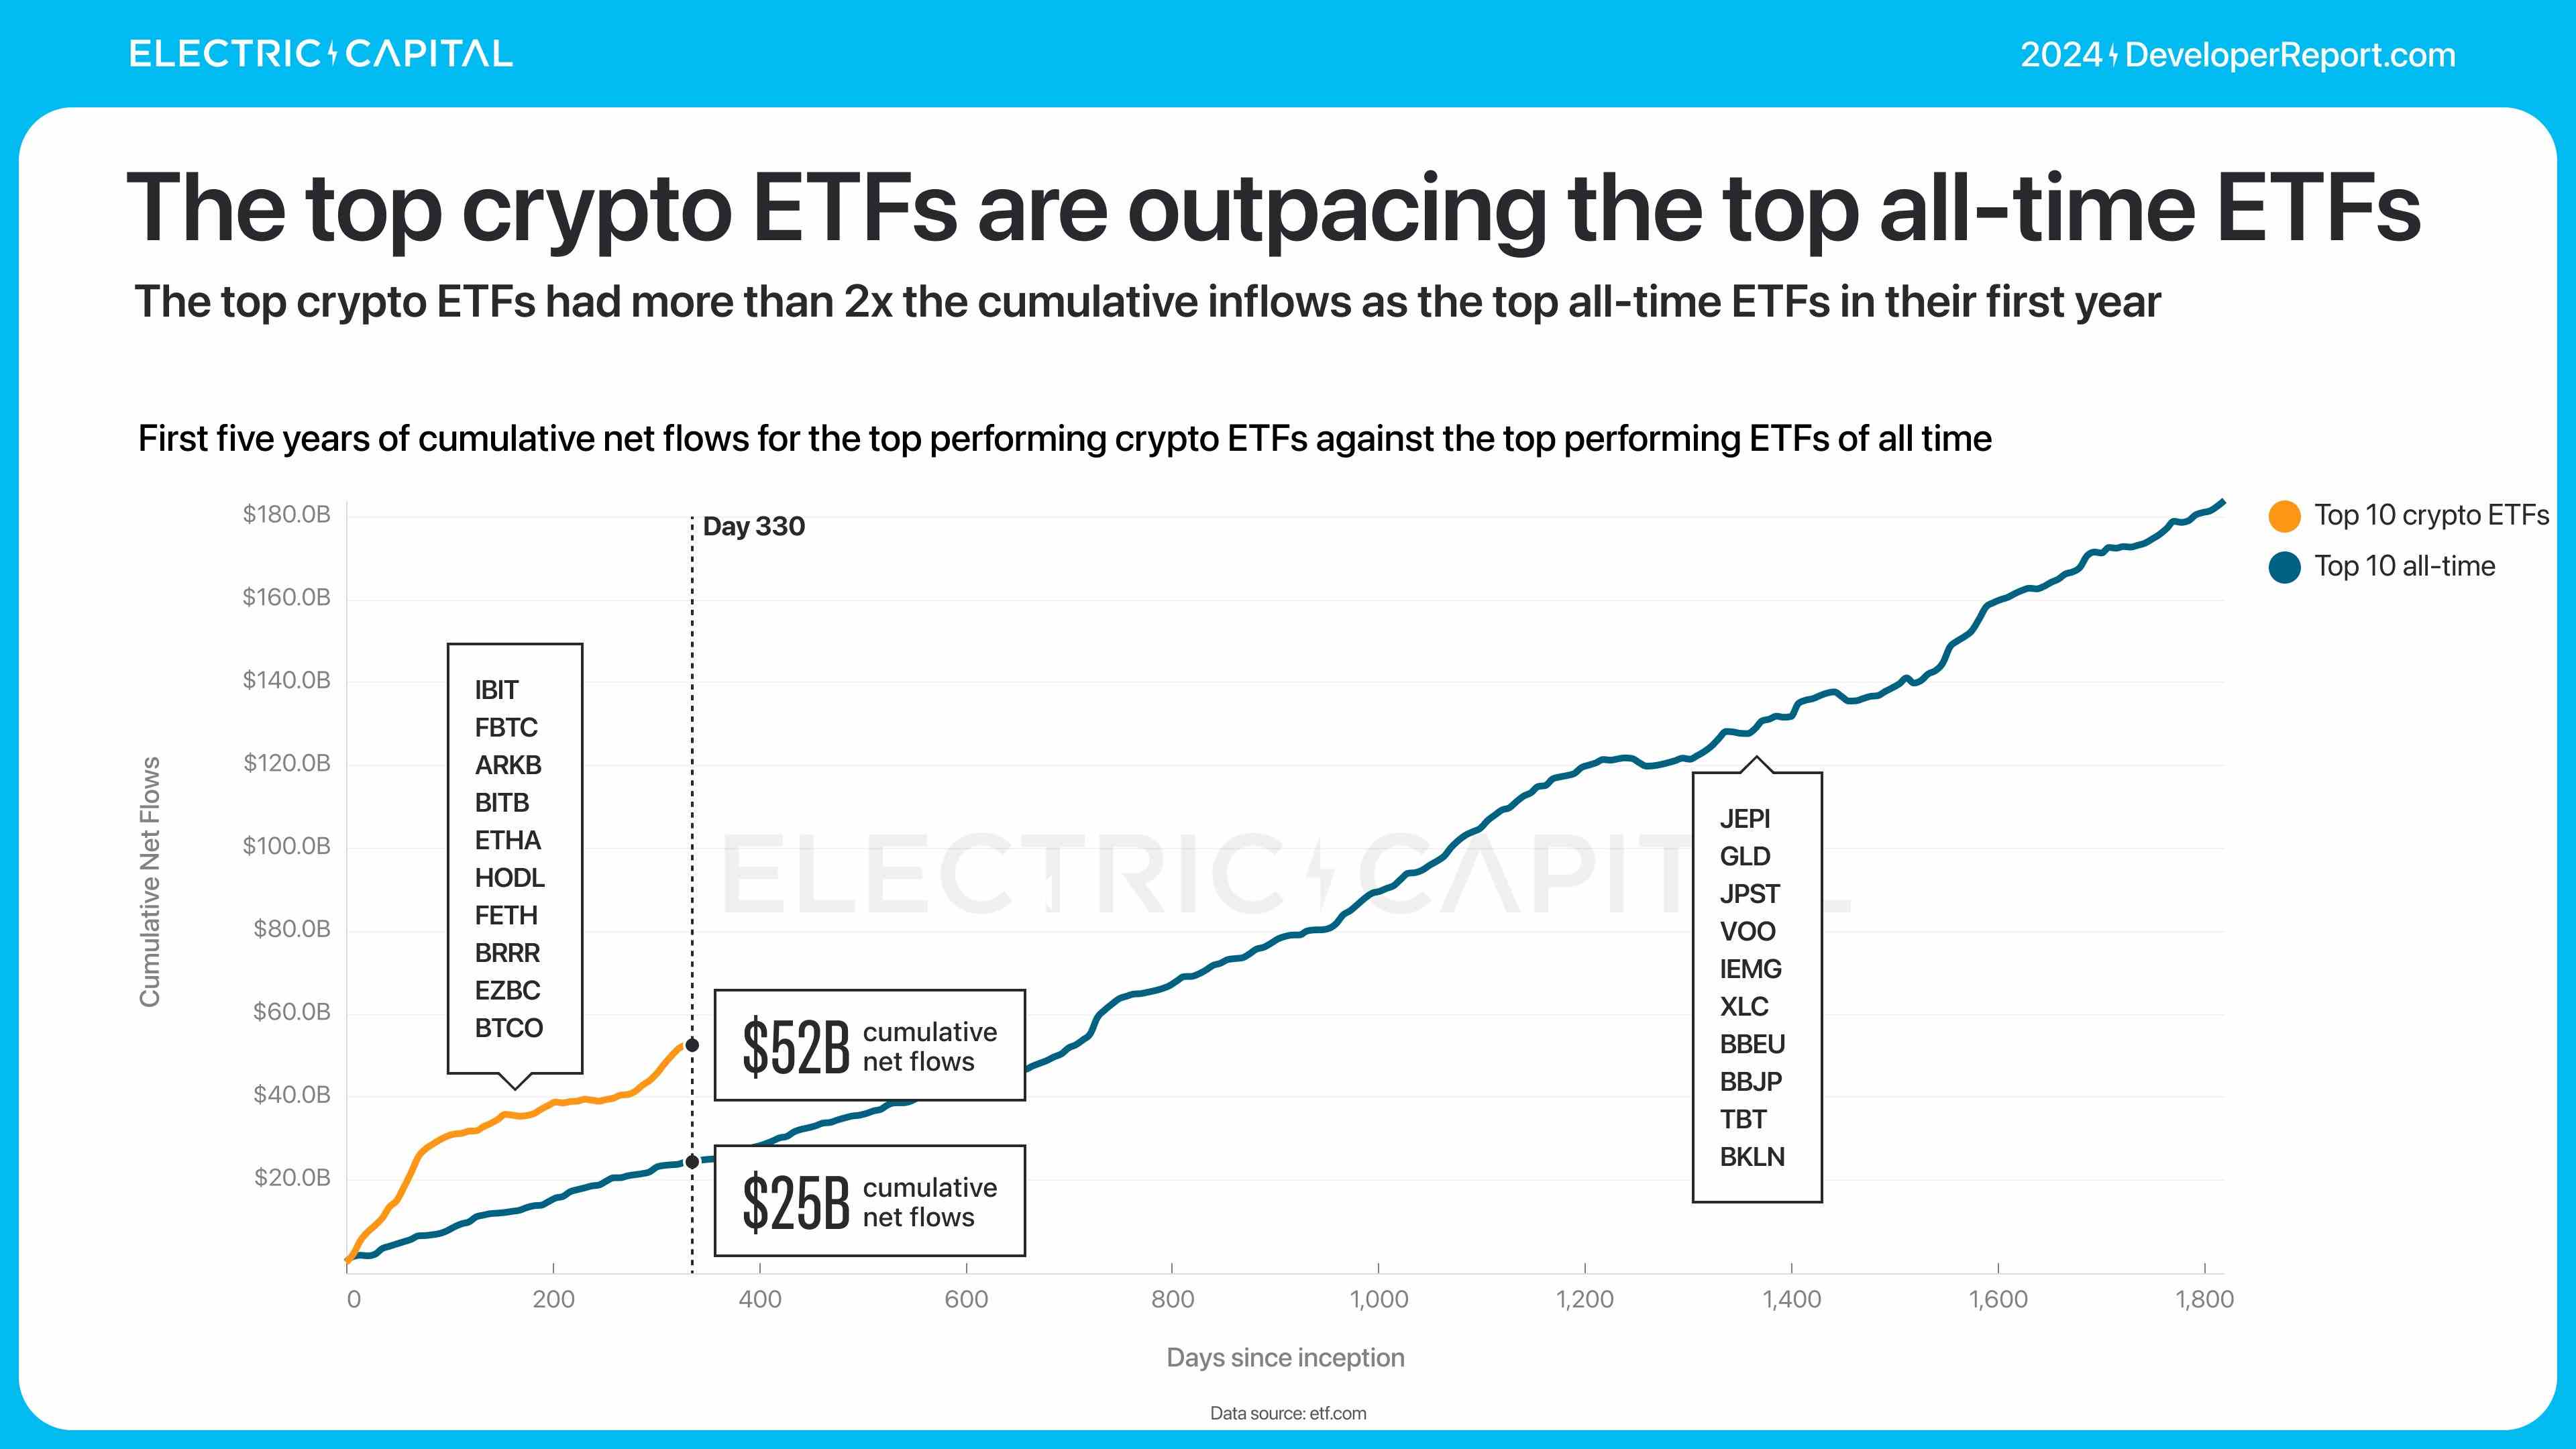
Bitcoin and Ethereum ETFs set historical records. Within their first year, cumulative inflows were more than double those of the previous most successful ETFs in history.
Join TechFlow official community to stay tuned
Telegram:https://t.me/TechFlowDaily
X (Twitter):https://x.com/TechFlowPost
X (Twitter) EN:https://x.com/BlockFlow_News