Bitcoin Drops to $62,000: Panic Sellers Cut Their Losses and Exit—Who’s Buying the Dip?
Author: Glassnode
Compiled by: TechFlow
TechFlow Editorial Note: Bitcoin dropped to $62,000 on November 15, as massive investor capitulation pushed realized losses to extreme levels historically only seen at major cycle bottoms. Meanwhile, leveraged longs in the derivatives market faced a forceful flush-out, with open interest and order book depth revealing intense long-short dynamics. This article objectively presents, section by section, the actual holding periods of on-chain sell-offs, the defensive strength of the core support zone between $62,000 and $66,000, miner capital shifting toward AI, and the technical patterns of altcoin extreme washouts.
Core Executive Summary
Bitcoin's recent sharp pullback has pushed investors' realized losses to typical capitulation selling levels, while thoroughly flushing speculative leverage from the derivatives market.
The current spot price sits within the cost range where recent buyers are most concentrated: $62,000 to $66,000. Below this, at $60,000 and lower, limit buy walls have mounted their strongest defense since August.
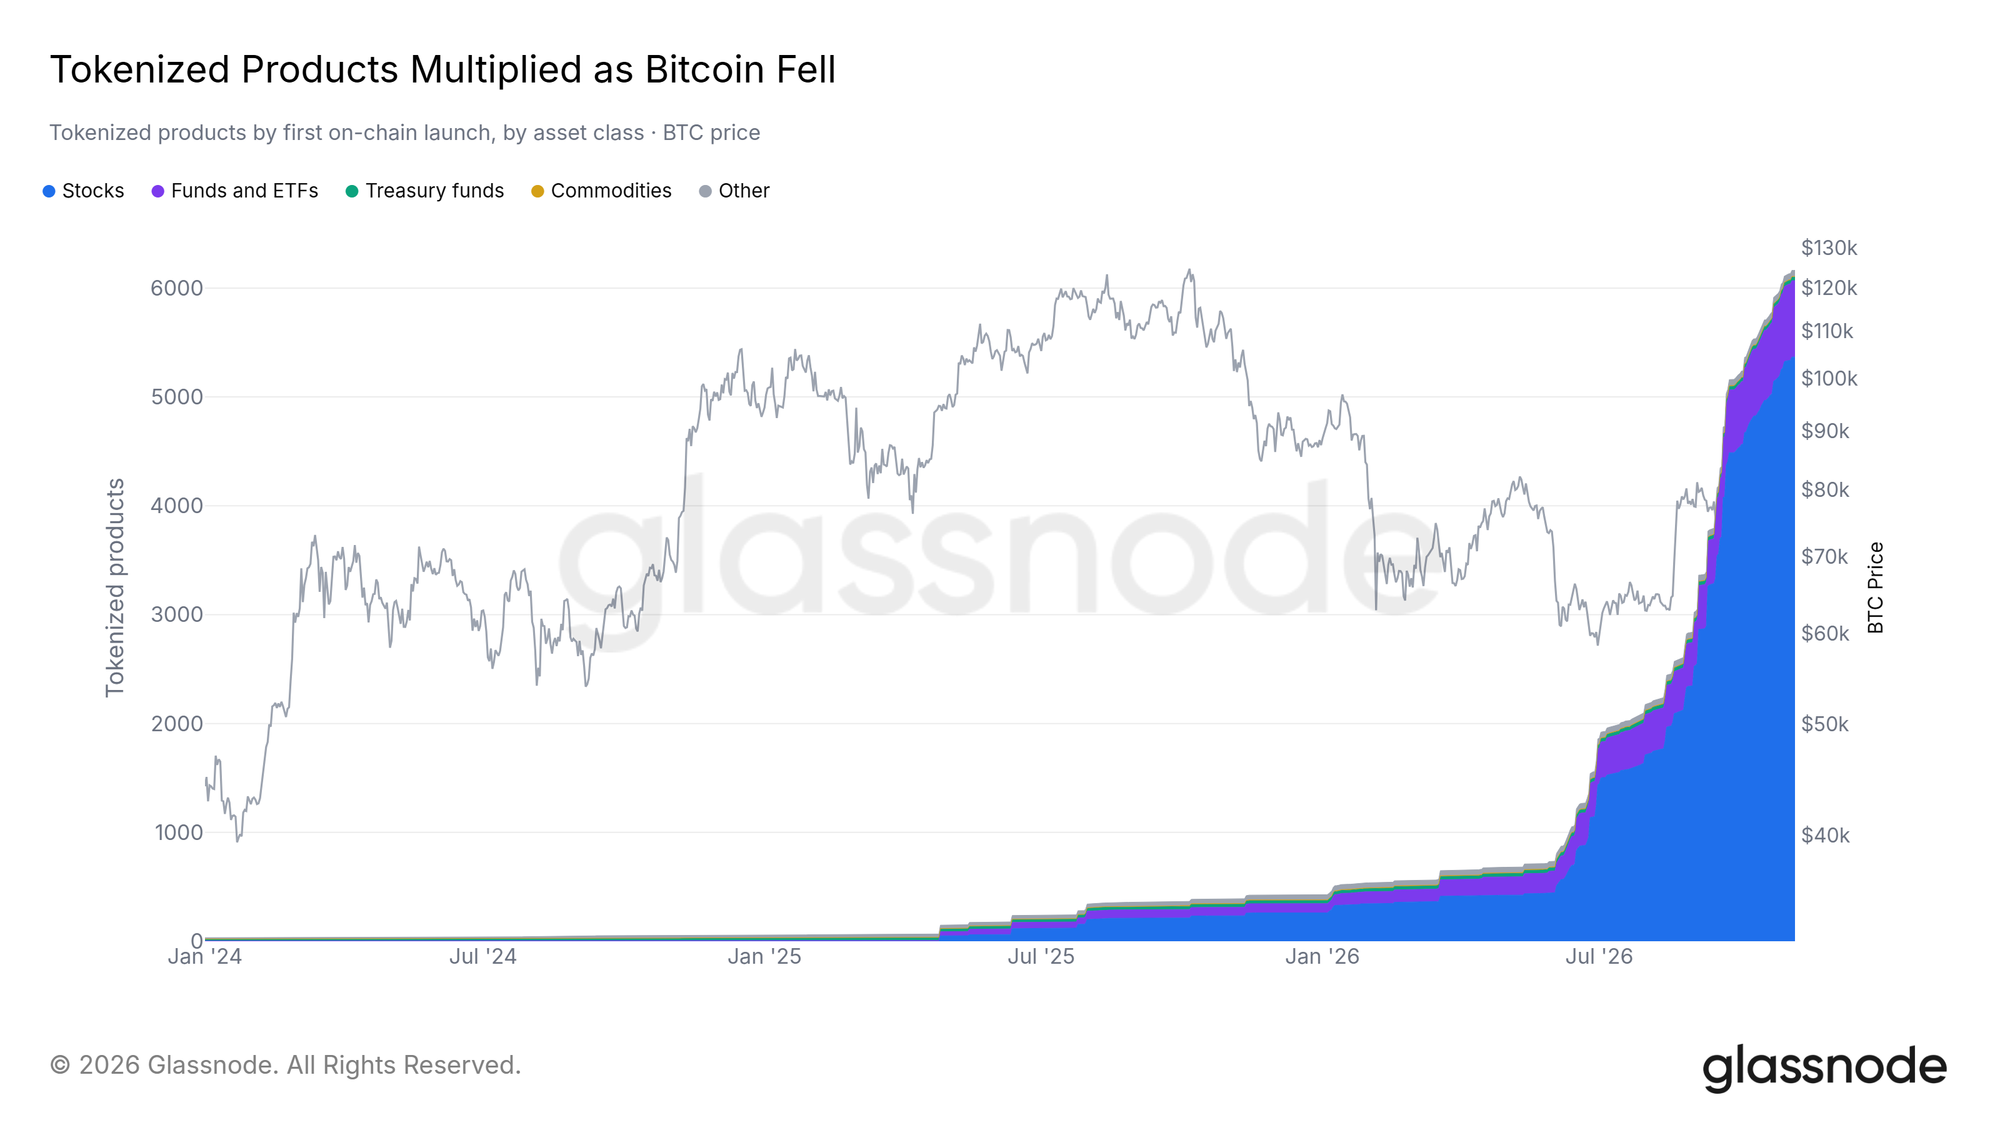
While macro demand for spot Bitcoin remains relatively subdued, the expansion momentum of on-chain tokenized real-world assets (RWAs) has not been interrupted by the market downturn and continues to grow steadily.
Capitulation Selling Kicks Off
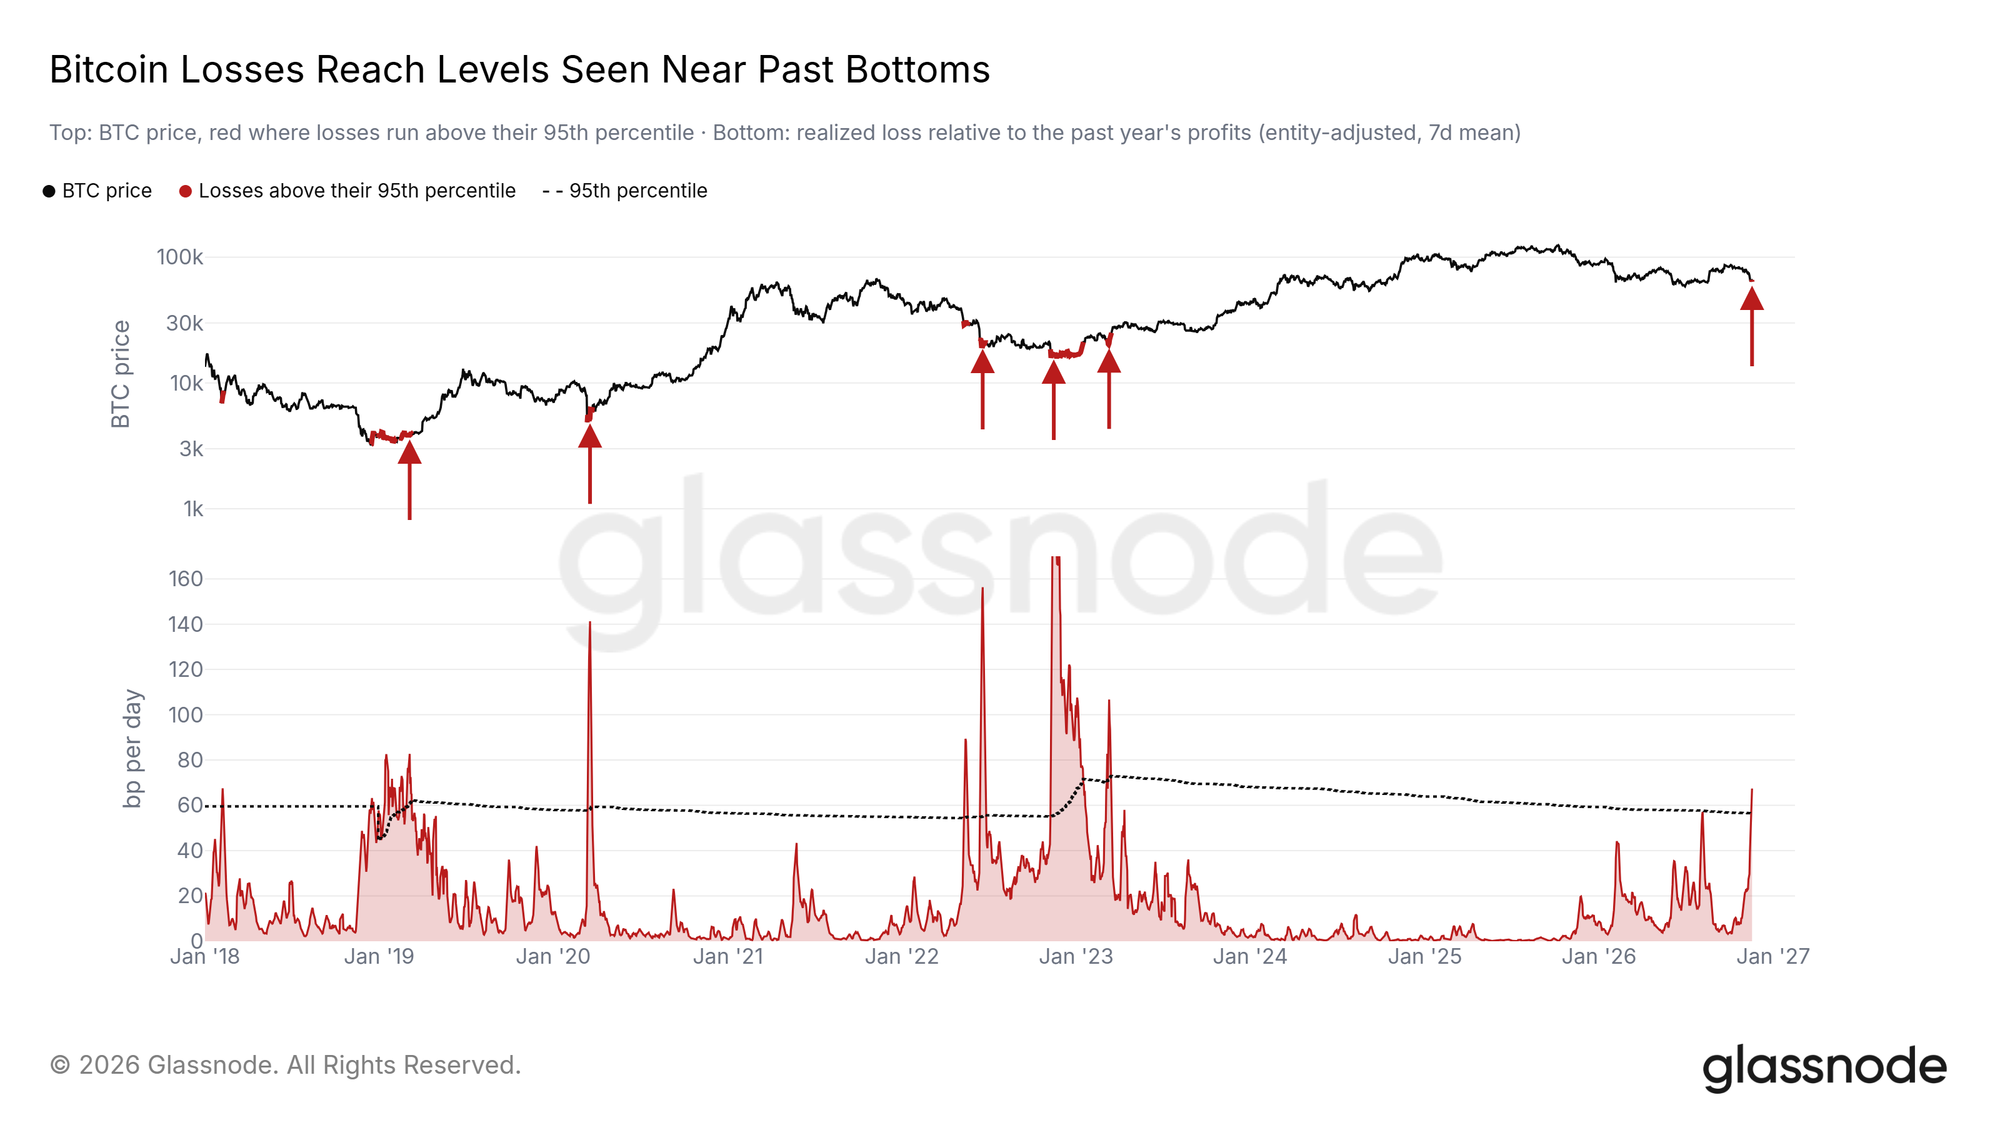
The crash on November 15 drove Bitcoin prices directly down to $62,000, with the scale of investor liquidation at a loss being extremely rare.
To horizontally compare the severity of these losses across different market cycles, we employ a standardized realized loss metric relative to the realized market cap.
This metric has now reached levels previously only seen at extreme market bottoms, such as in 2018, 2020, 2022, and early 2023; it also marks the first time in this cycle that realized losses have hit this level of severity.
Recent Buyers Accepting Losses and Exiting
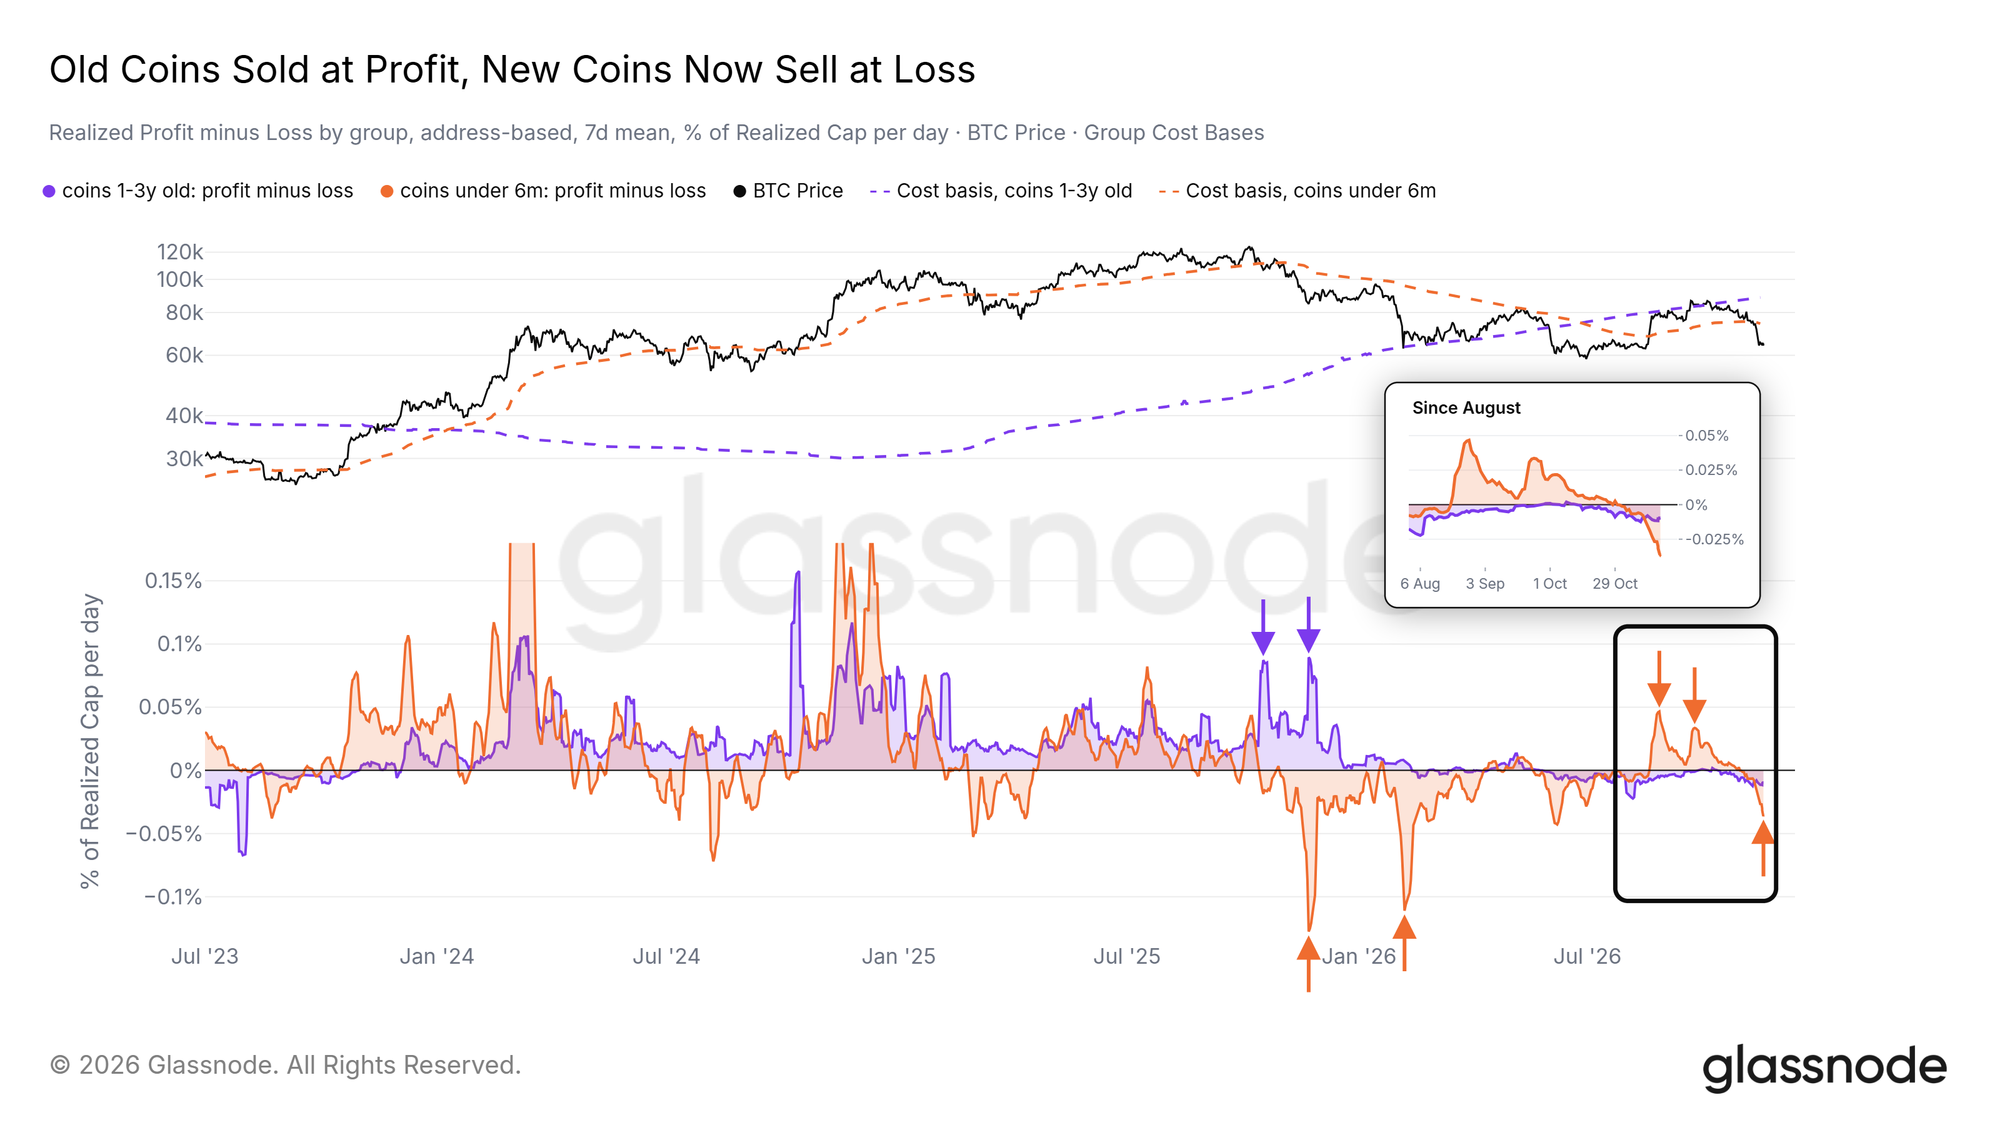
The primary source of this selling pressure comes from recently accumulated buyers.
Holders with 1- to 3-year holding periods locked in major cycle profits back in late 2025 and have largely exited active trading, keeping their holdings dormant.
Therefore, the true backbone of this wave of selling consists of investors who entered within the past 12 months, as well as Short-Term Holders with durations under 3 months.
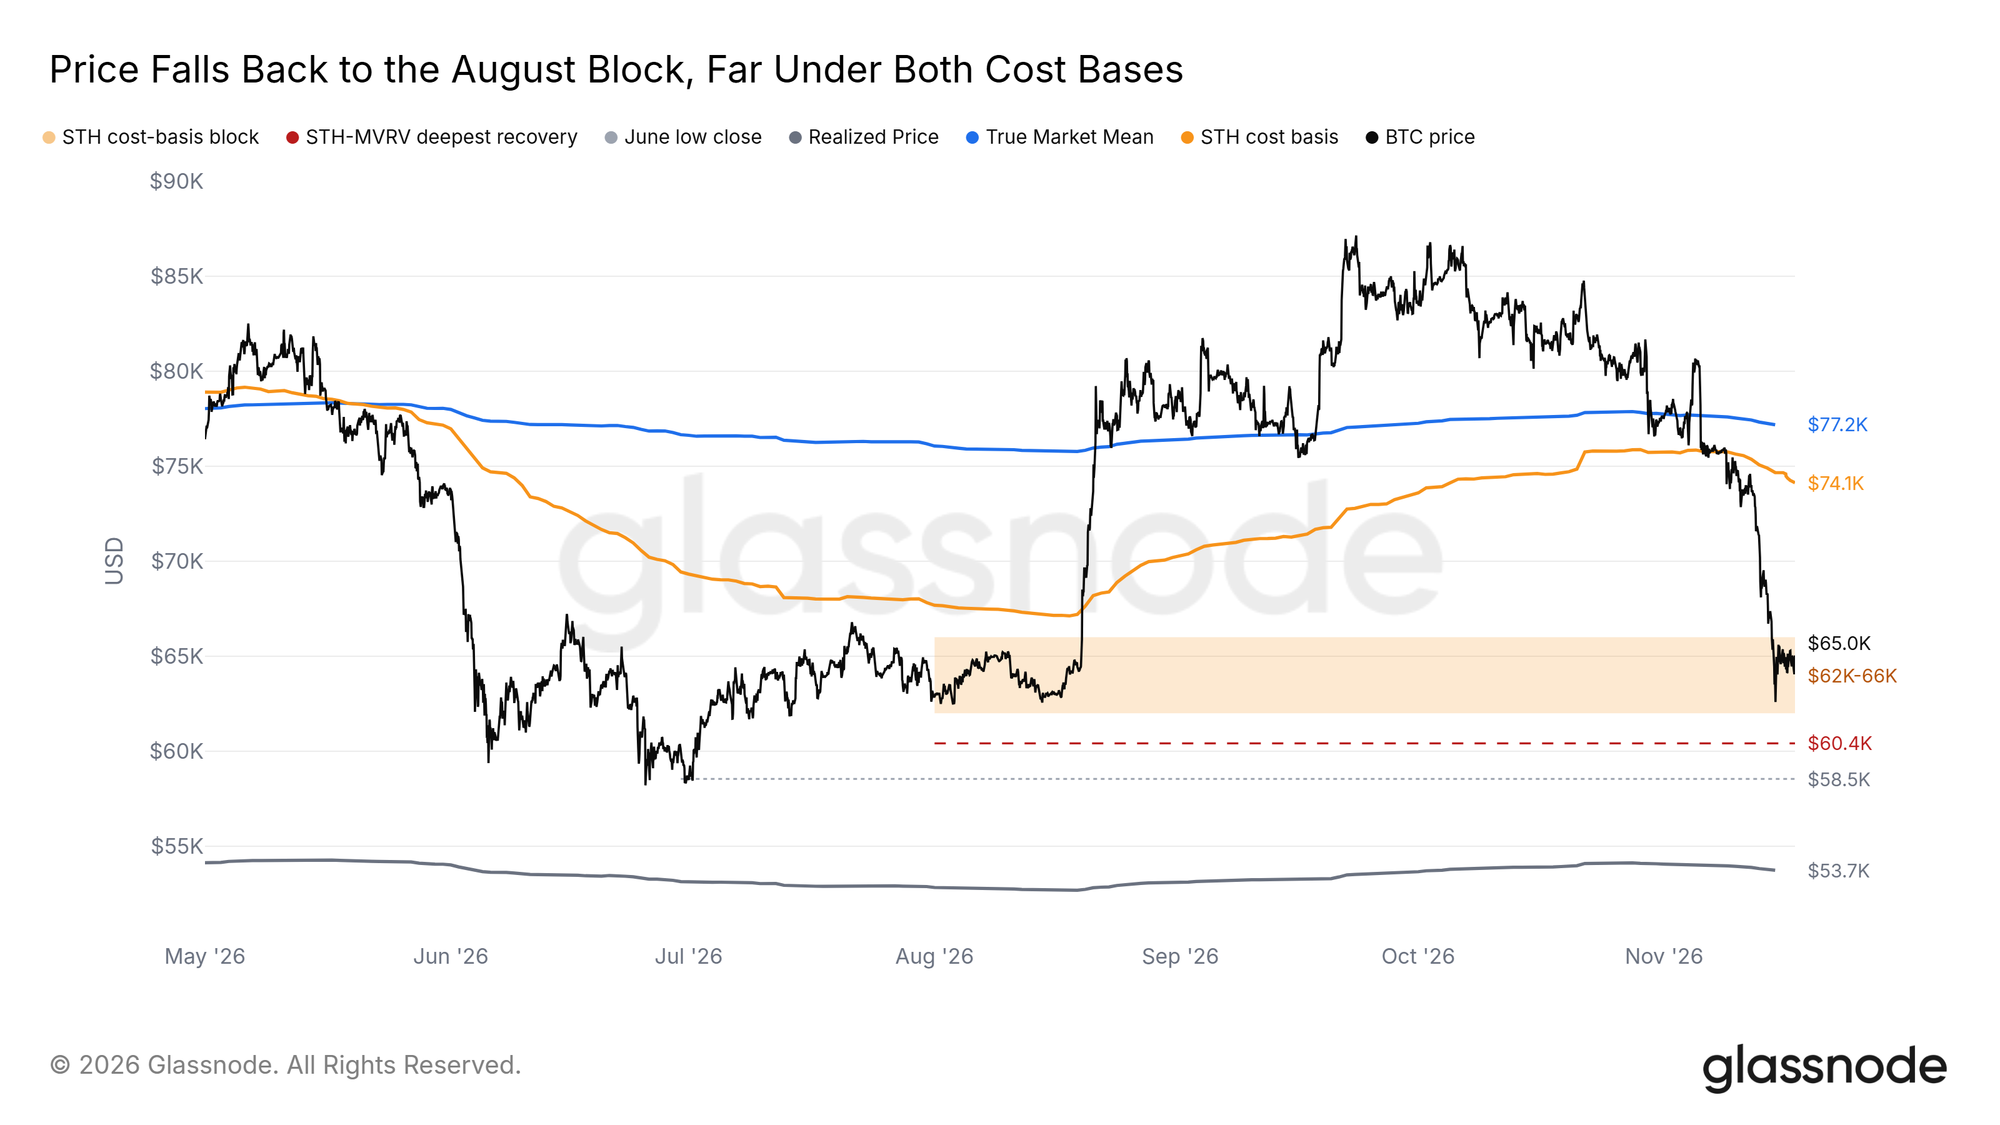
The current Bitcoin price has broken below the average entry costs for both groups (indicated by the dashed lines in the chart). As long as the price remains below these cost bases, more recent buyers may be forced to exit at a loss via stop-losses.
Holding the August Coin-Dense Zone
In last week's report, we clearly identified the $62,000–$66,000 zone as the sole dense on-chain support band below the spot price, and this crash precisely tested its lower boundary.
This makes the $62,000–$66,000 range a critical lifeline that bulls must defend at all costs, as breaching it would expose the market to severe downside technical risks.
Below $62,000, there is very little short-term holder accumulation, with secondary support formed by older positions only appearing near $48,000 further down.
On the upside, the Short-Term Holder Cost Basis sits at $74,100, representing the break-even threshold for recent buyers as a whole.
Leveraged Long Flush
This severe drop forced high-leverage longs into mass liquidations and stop-loss executions.
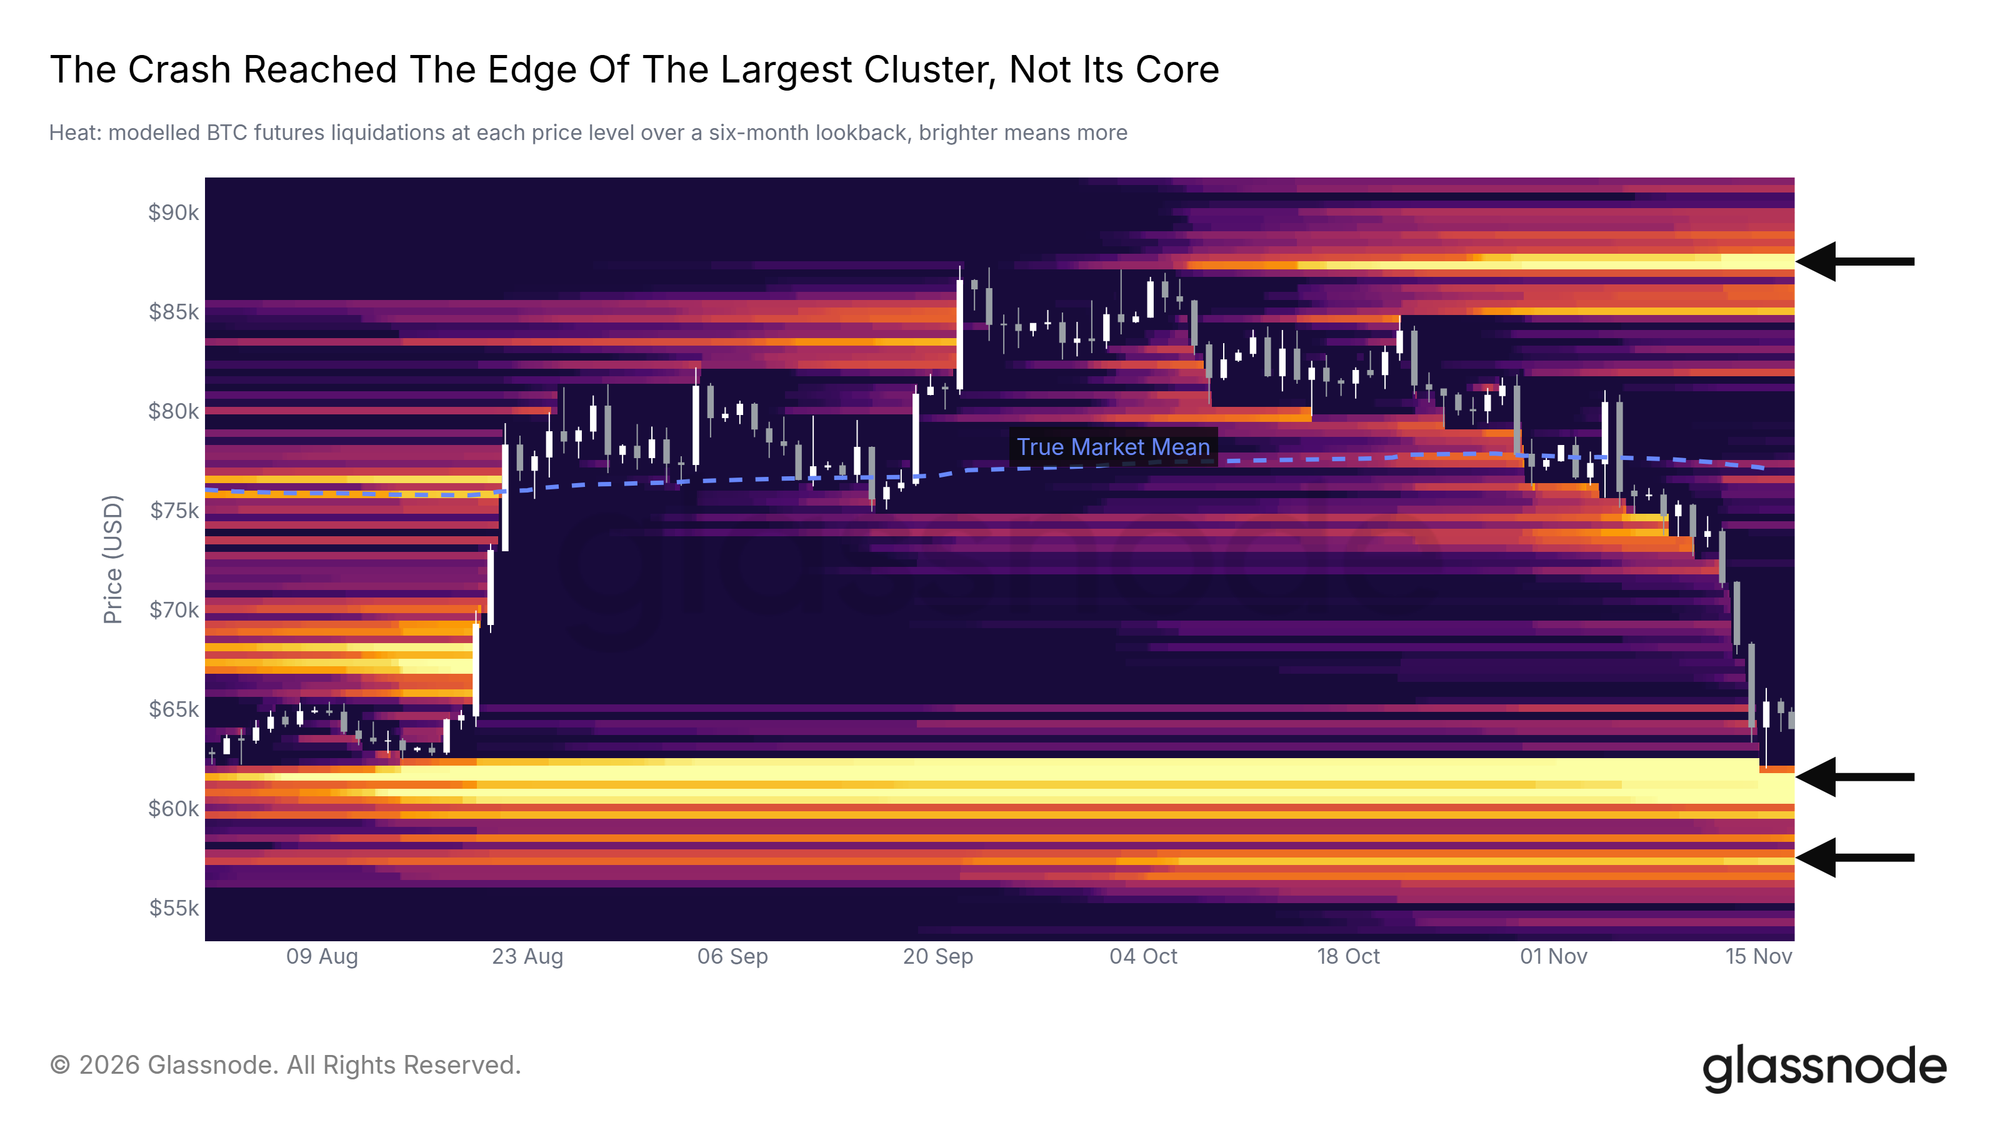
Measured as a percentage of total open interest, the long liquidation volume on November 13 and 14 represented the most intense wipeout since August 2024.
Looking at the liquidation heat map, the previously clustered long liquidation band was located between $59,500 and $62,200. Although the intraday low on November 15 probed the upper edge of this zone, it ultimately held above this cluster.
Buying Waiting Below to Absorb
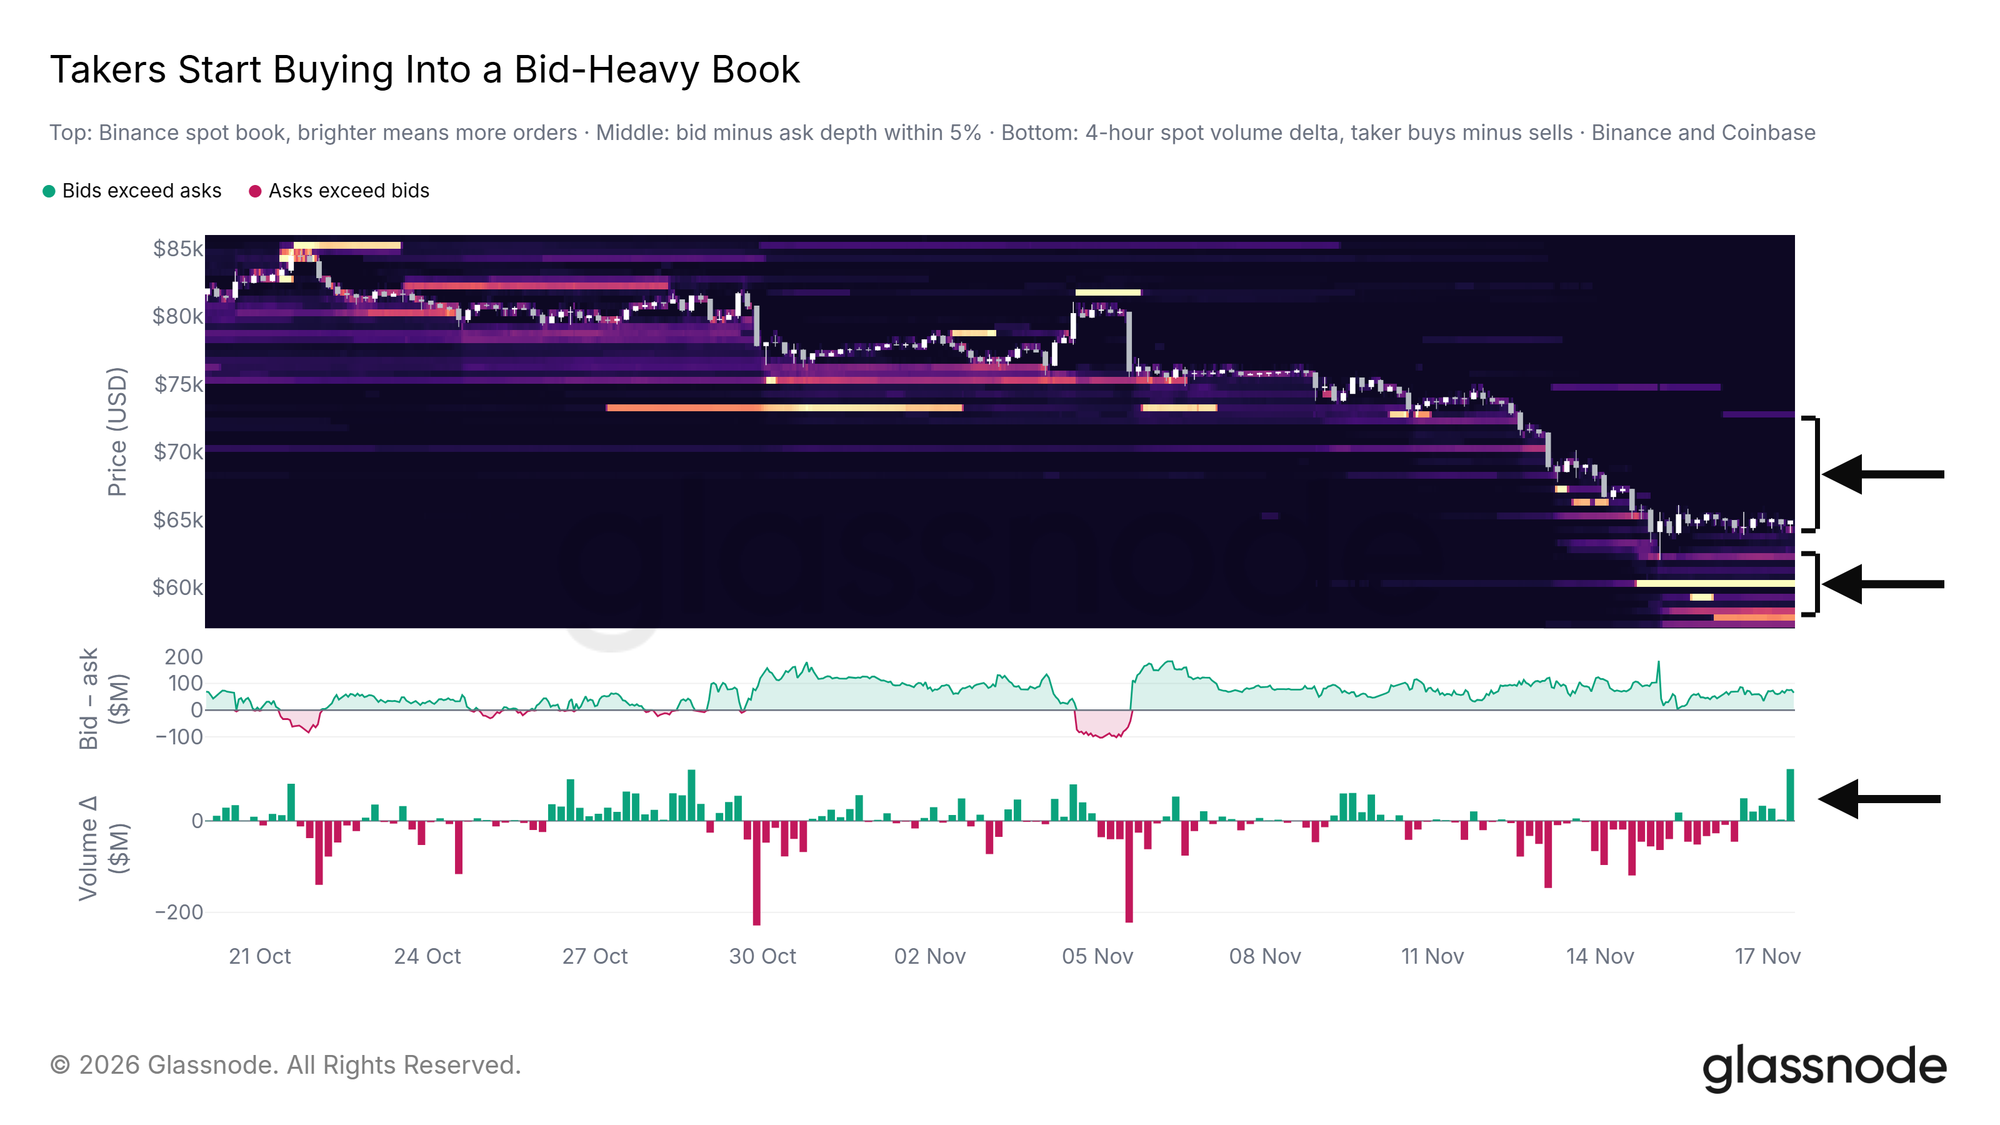
Within a 5% range from the spot price, the volume of limit bids on Binance and Coinbase currently stands at roughly 2.3 times that of asks.
Since late August, bid volumes have typically been equal to or weaker than ask volumes; the substantial surge in bid density now reflects large-scale limit buys actively absorbing selling pressure.
During the crash, market sell orders (takers) smashed aggressively into these bids, as shown by the red bars in the chart; however, they have turned net buyers over the past day.
Premium Signals Emerge at Lower Levels
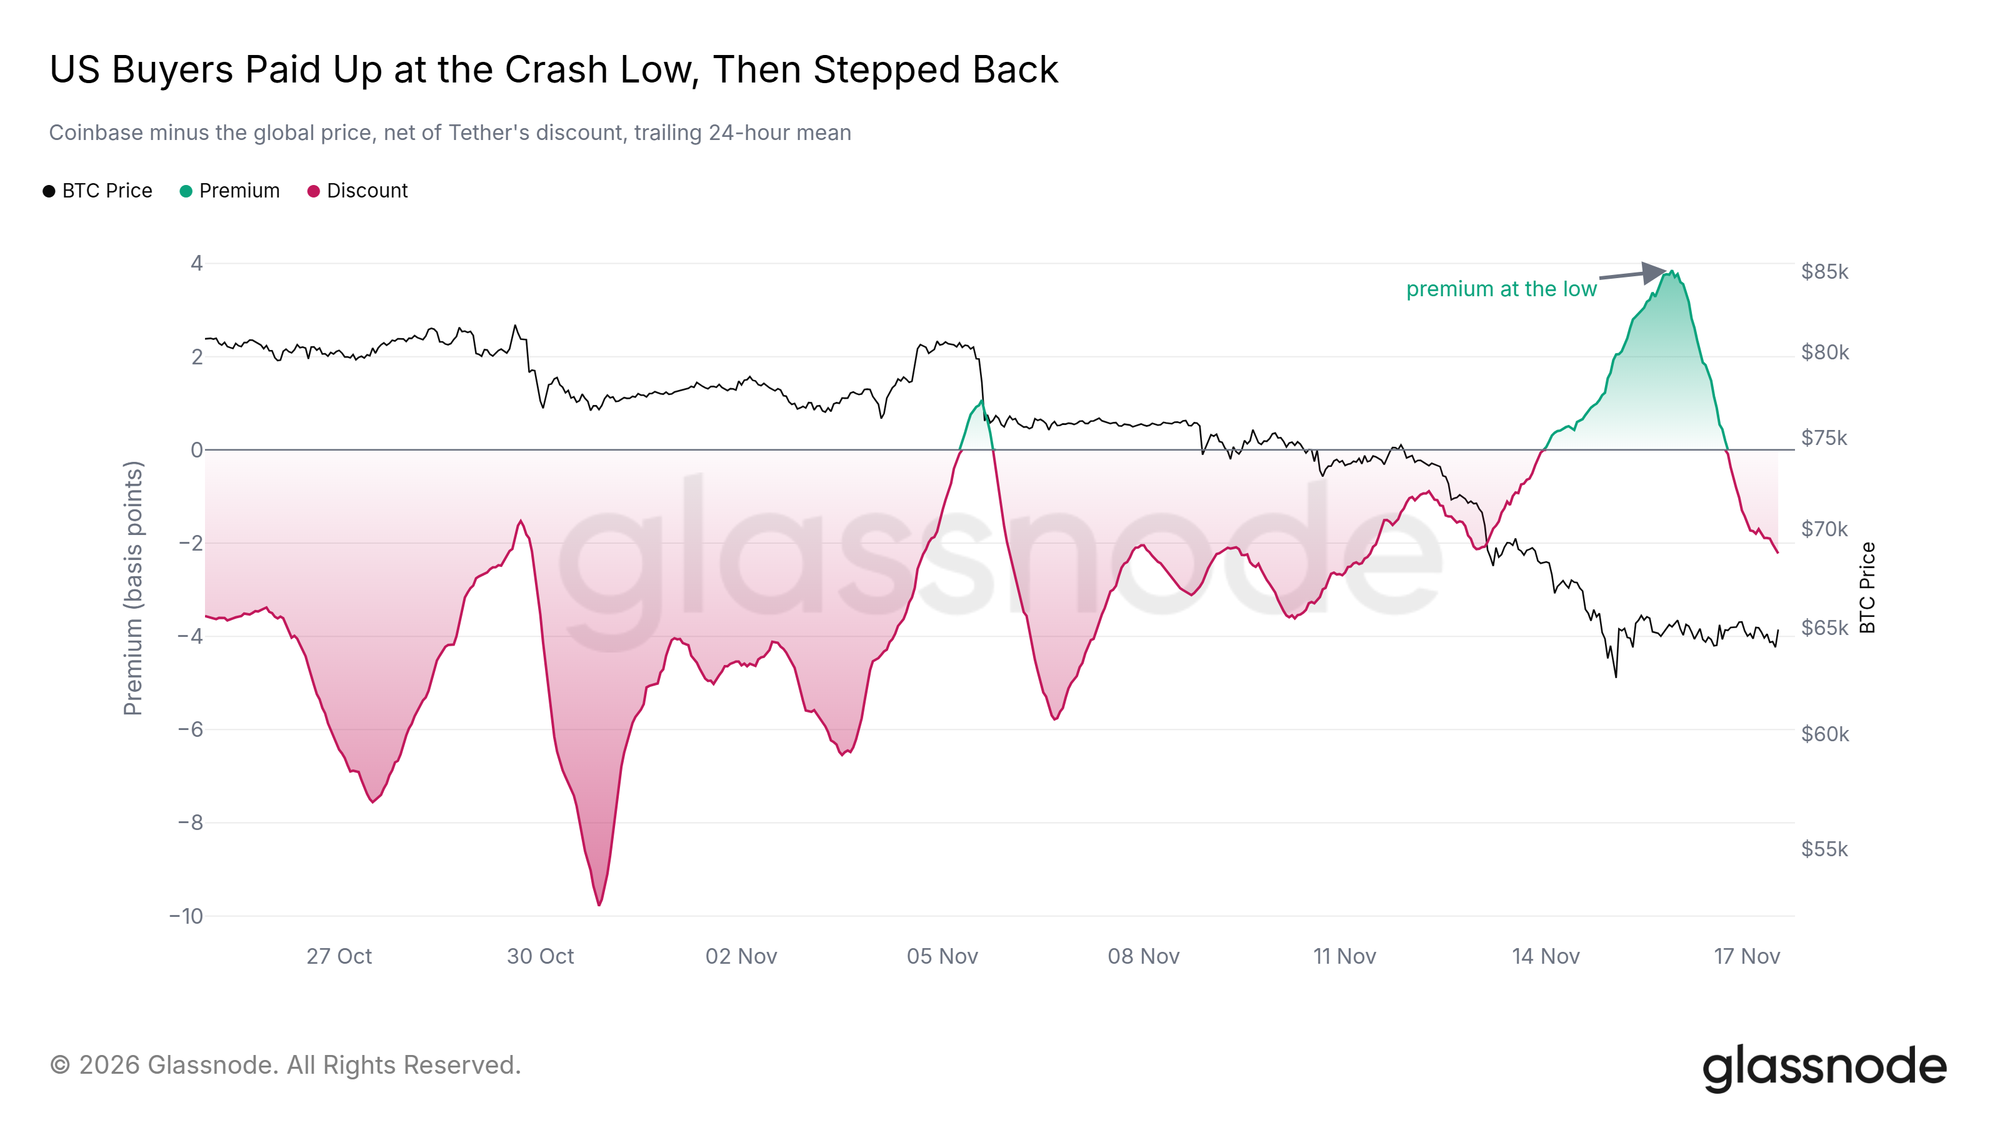
The Coinbase Premium Index contrasts the price difference between Coinbase, the primary U.S. institutional exchange, and global offshore markets.
Prior to the crash, this premium had been in discount territory for a consecutive week, indicating a lack of U.S. buying power; it then briefly spiked into positive premium territory around the local bottom.
The indicator has since retreated to a slight discount. If the Coinbase Premium can flip back to positive and hold effectively, it will serve as a key leading signal for substantive recovery in U.S. demand.
Cash Exit Shifting to U.S. Treasuries
Apart from limit-based bottom-fishing during the decline, overall macro-level spot demand remains weak.
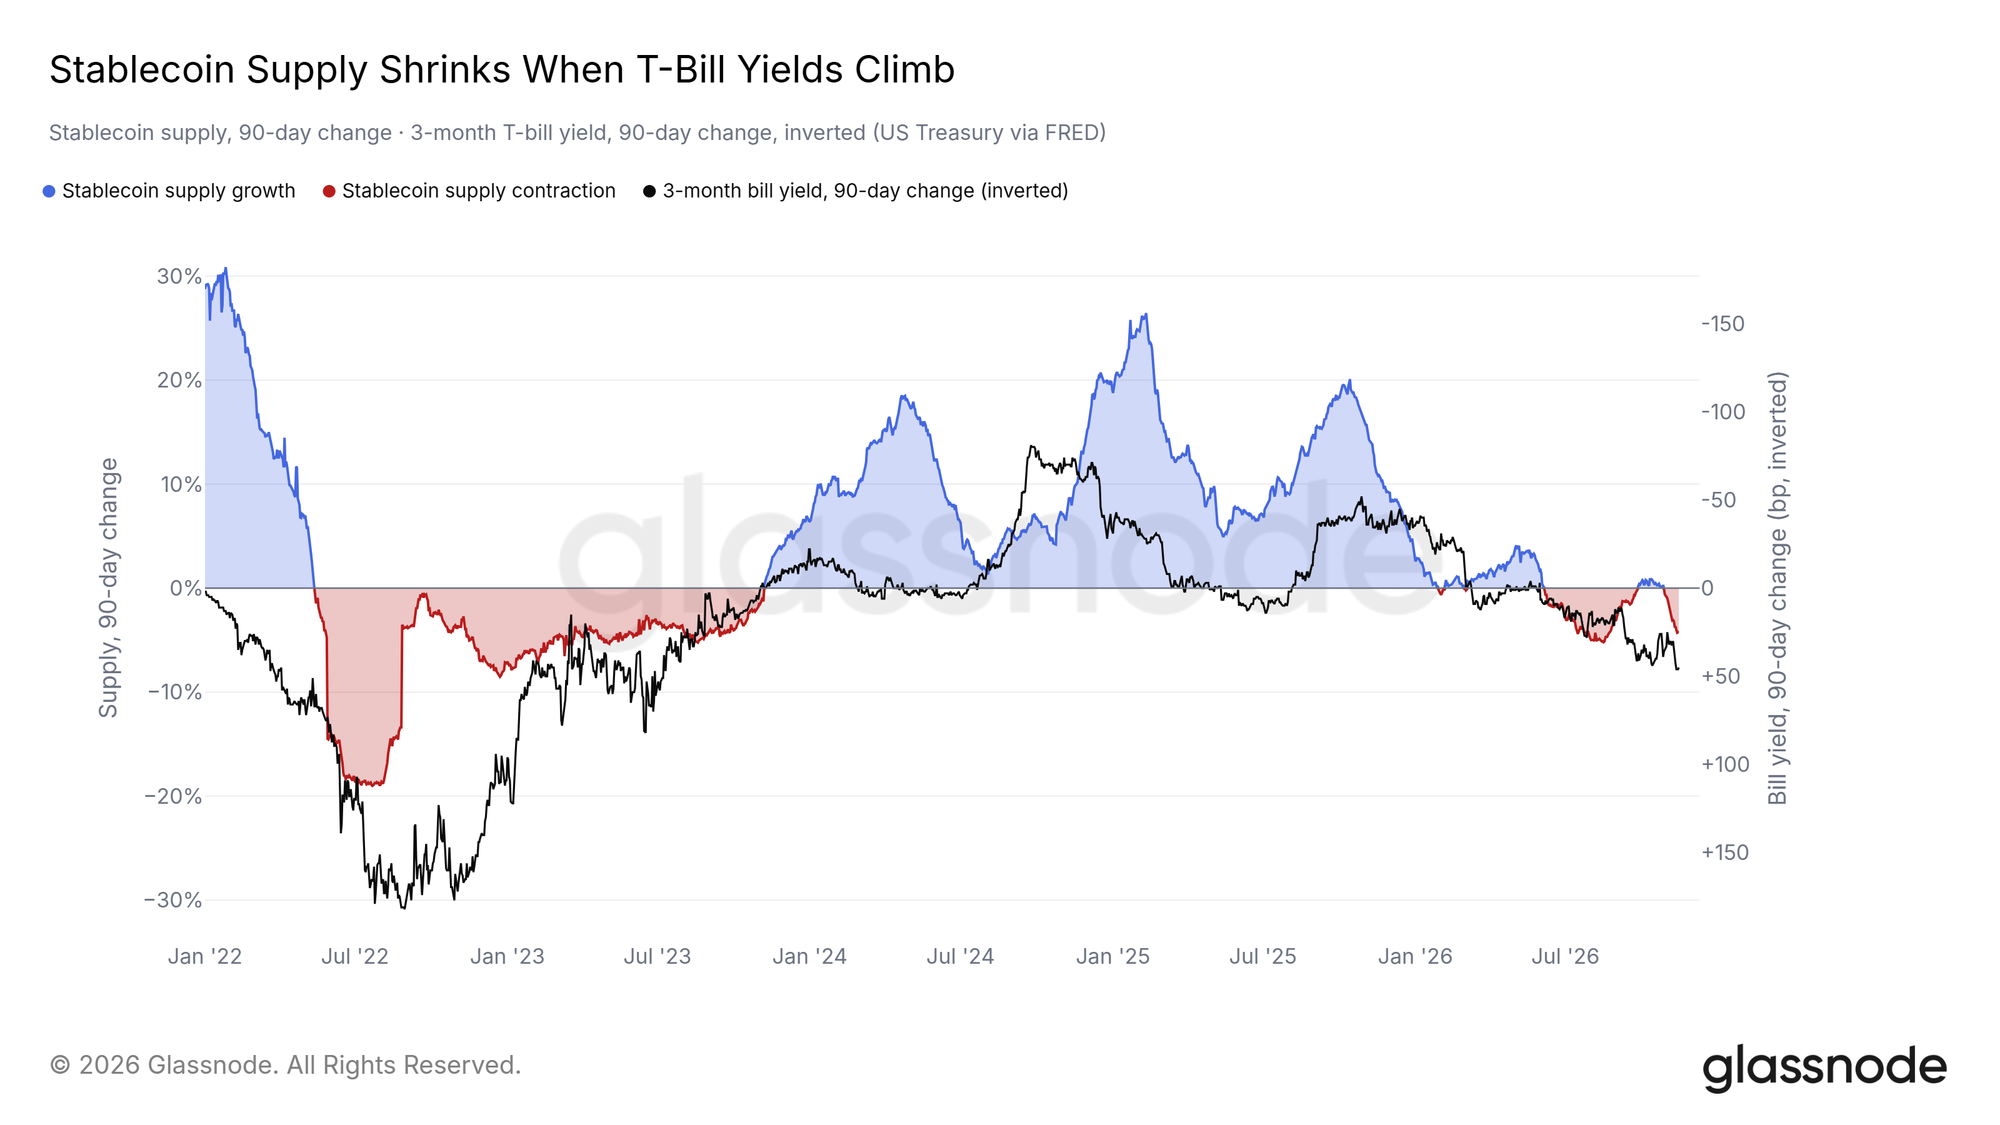
Stablecoins, acting as the cash nexus of the crypto market, saw their total market cap contract by 4.2% over the past 30 days, marking the fastest outflow rate since late 2023.
Historical data shows that since 2022, stablecoin supply tends to contract whenever short-term U.S. Treasury yields rise. After all, holding stablecoins generates no native yield, whereas three-month Treasuries offer risk-free returns exceeding 4.3%.
Miner Sales Fund AI Transition
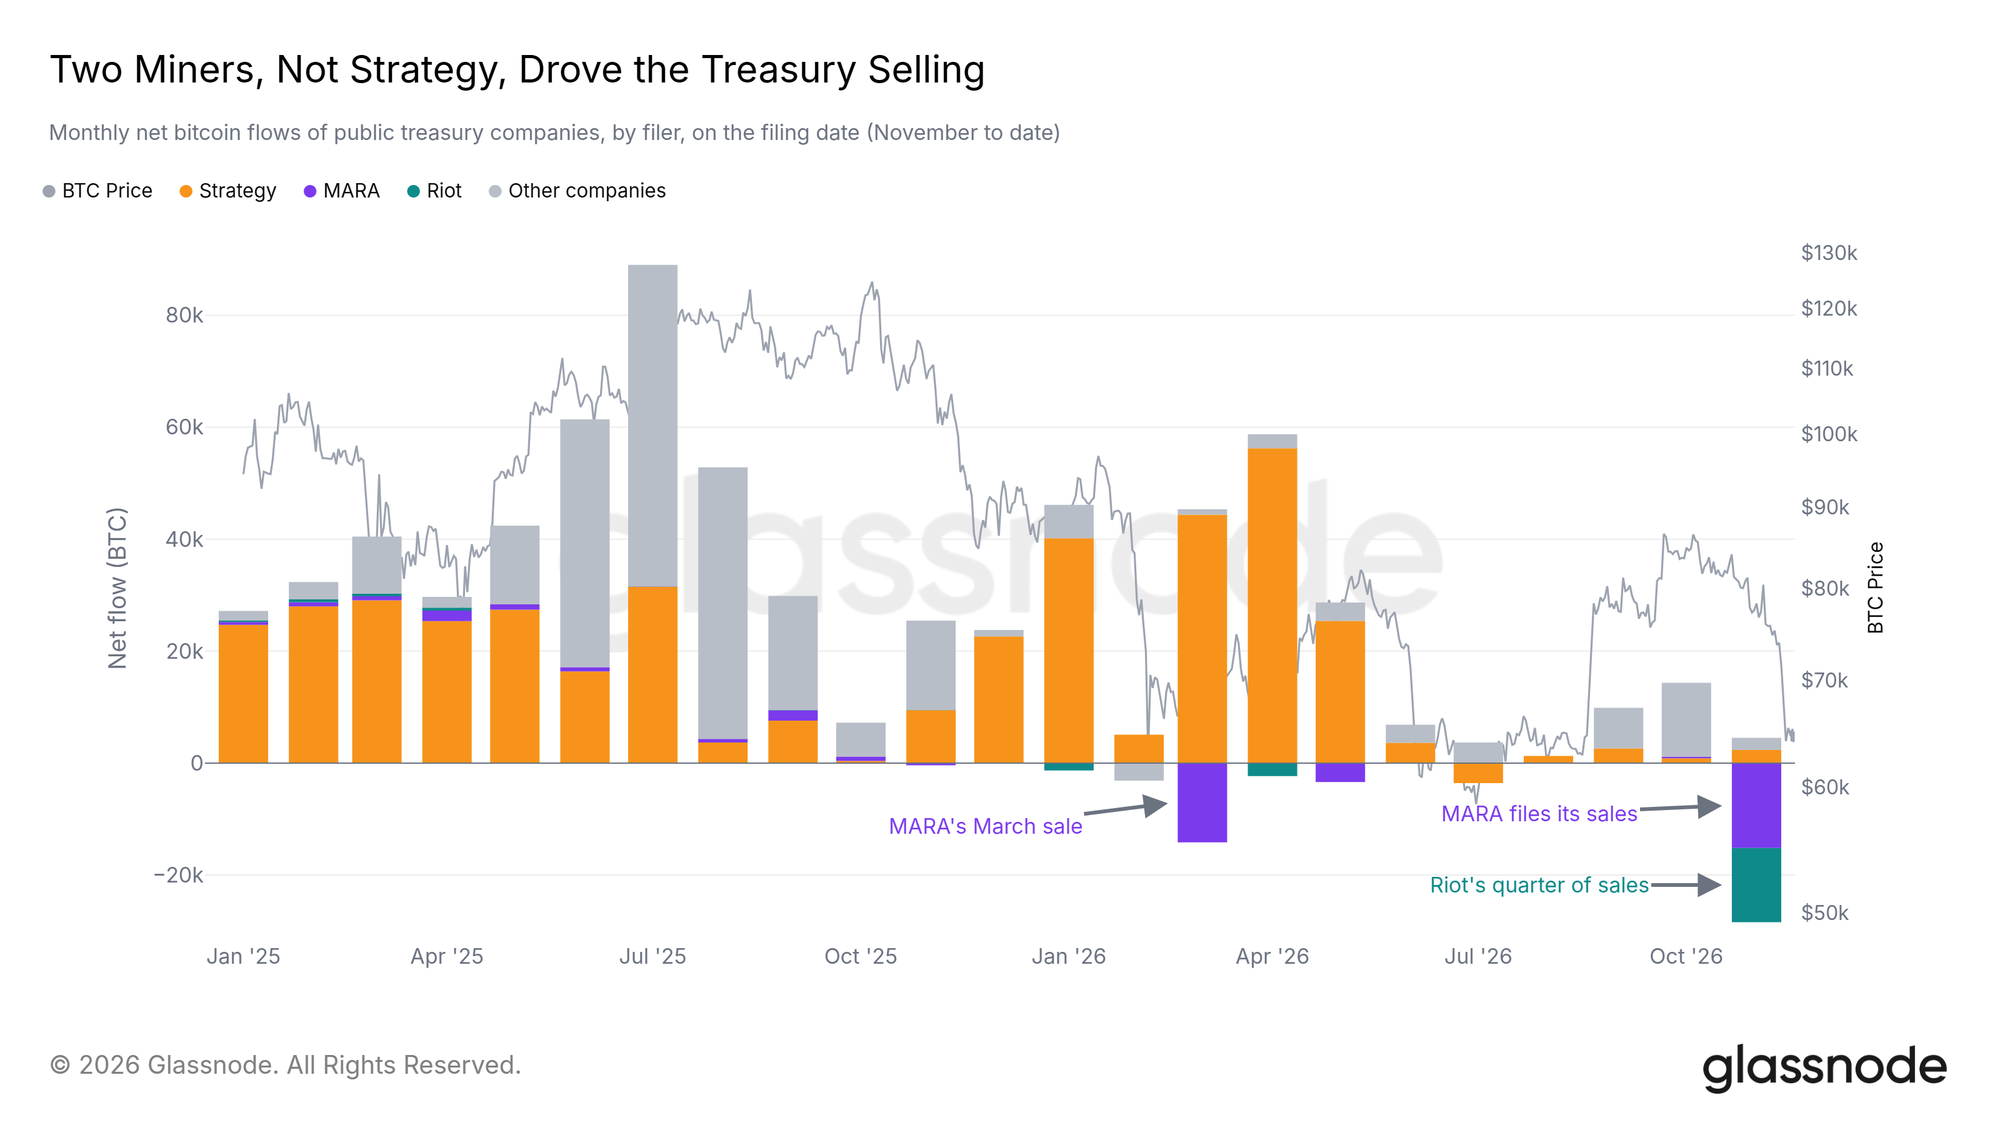
Meanwhile, Bitcoin miners continue to sell. MARA and Riot reported sales of approximately 28,000 BTC this month, while MicroStrategy continues to accumulate.
Public mining companies are selling Bitcoin primarily to raise capital expenditures for transitioning their hash rates toward AI data center infrastructure. As AI rental businesses command higher P/E multiples, this strategic shift is draining miners' Bitcoin reserves.
U.S. spot ETFs also show signs of cooling demand. Over the 10 trading days ending November 13, cumulative net outflows reached $2.6 billion.
Pricing Future Risk Events
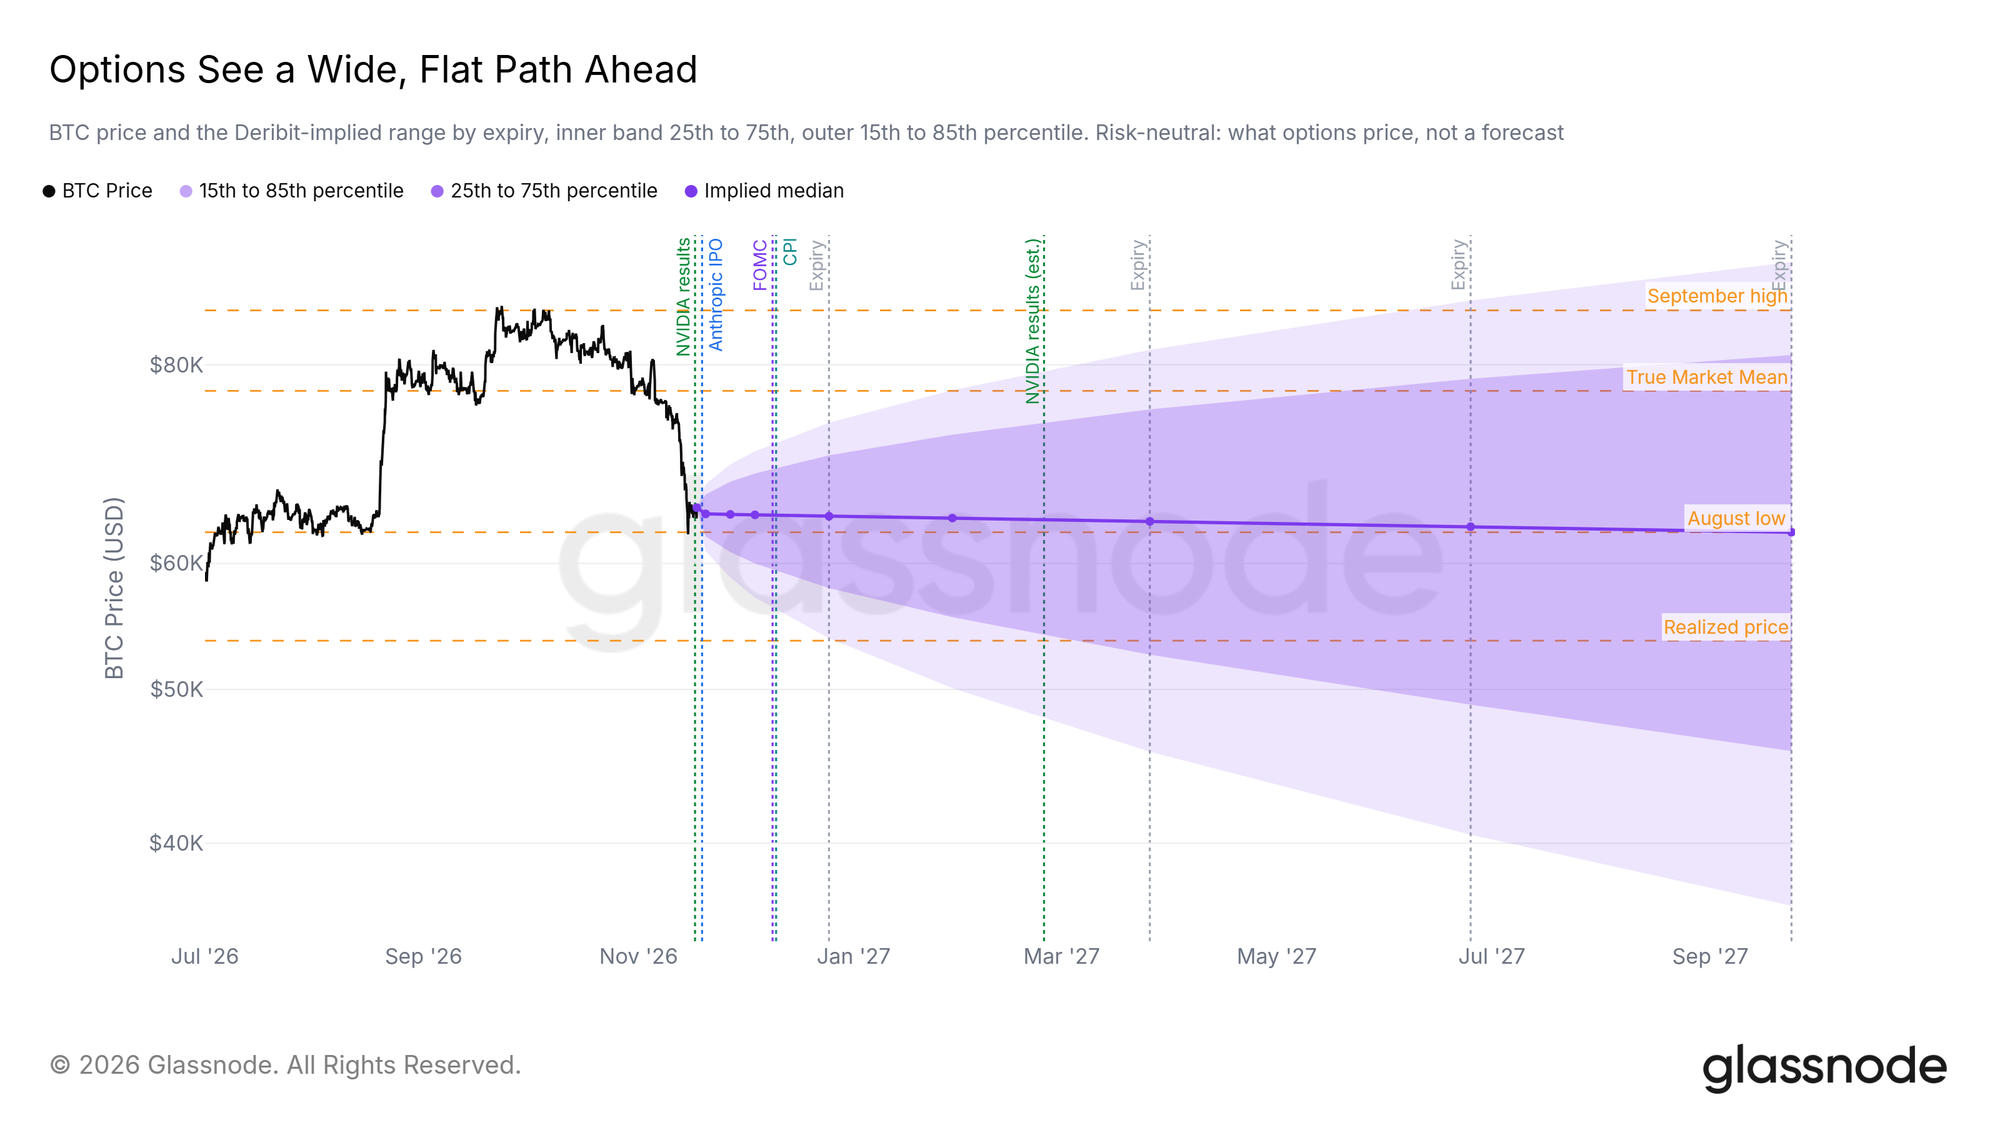
The implied volatility surface in the options market shows that option implied volatilities on Deribit continue to widen through 2027, indicating the market is fully pricing in long-term uncertainty.
Multiple major events that could disrupt this range are expected over the coming weeks. NVIDIA is set to release earnings today, and with its CEO stepping down, movements in the semiconductor supply chain are drawing close attention.
Familiar Altcoin Extreme Washout
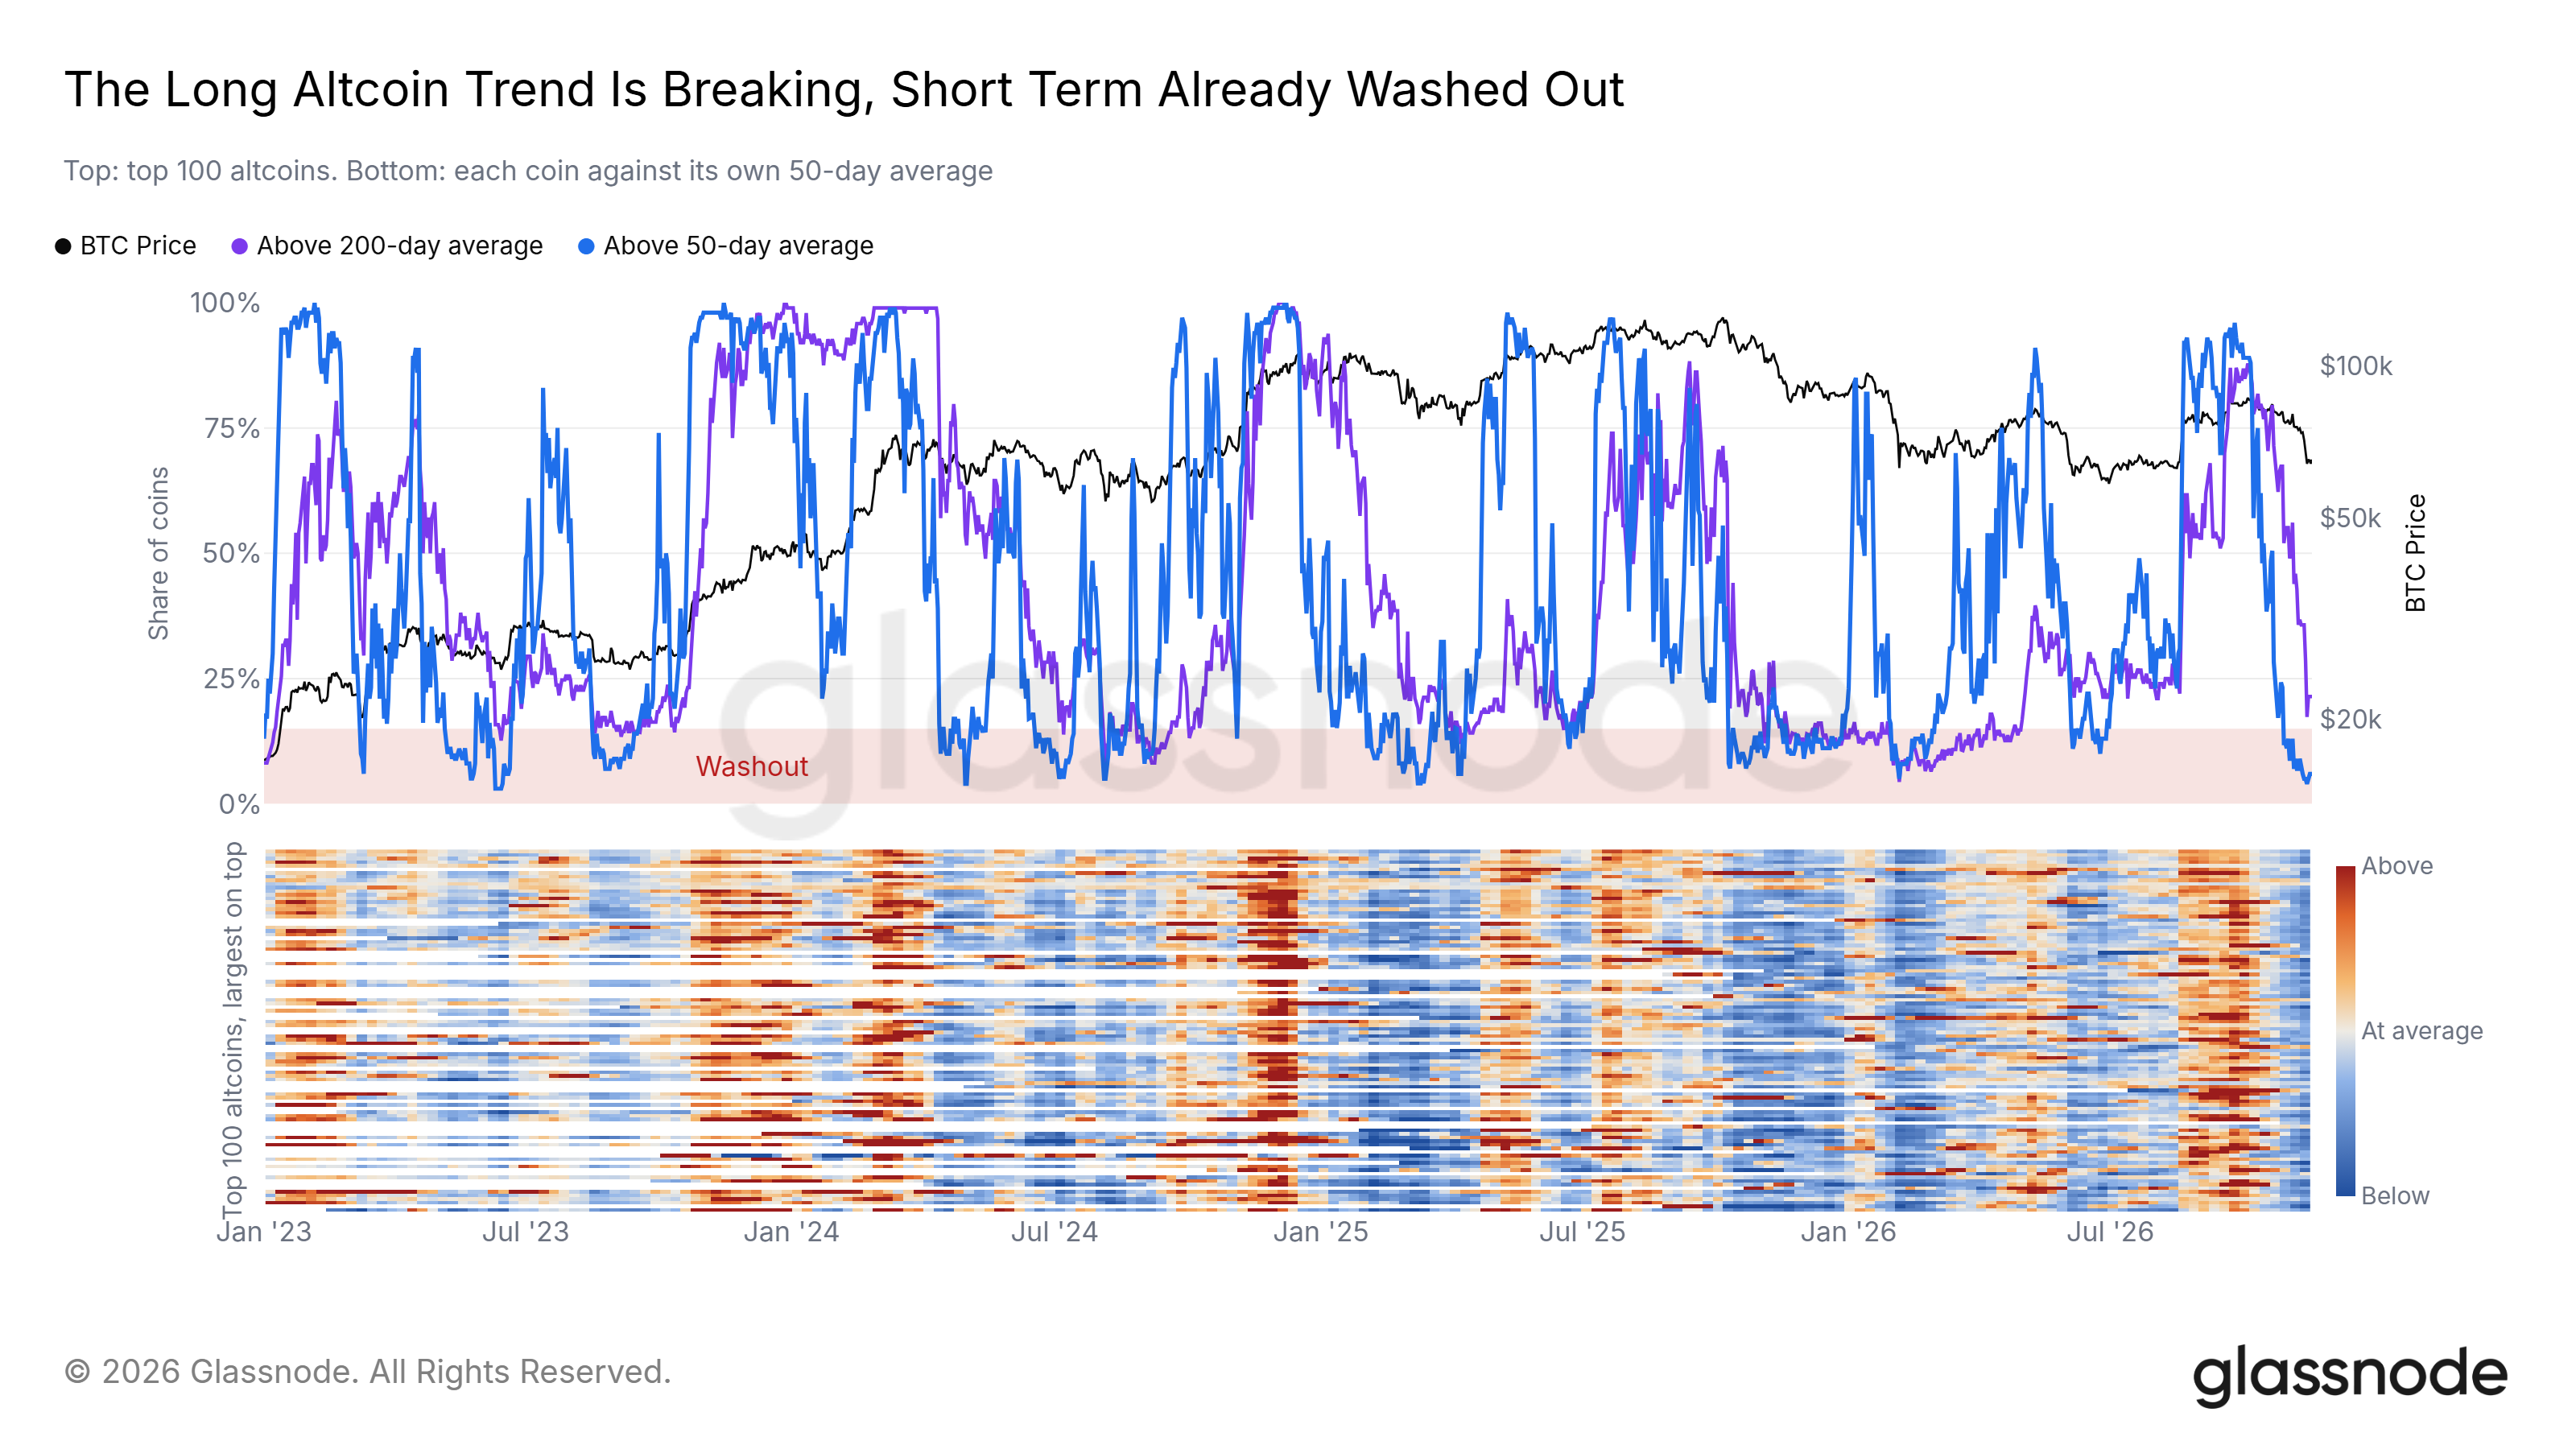
Currently, among the top 100 cryptocurrencies by market cap, only 6% of tokens are priced above their 50-day moving average, falling into an extremely deep oversold washout zone.
The proportion of tokens priced above their 200-day MA is merely 11%, matching readings from the yearly low in July.
Historical data since 2023 shows that the deepest altcoin extreme washouts typically occur within four days of Bitcoin's cyclical lows; in the subsequent 60 days, Bitcoin prices have invariably recorded higher gains.
Tokenization Ecosystem Continues Building
Although Bitcoin struggles to attract incremental capital in the secondary market, development in other areas of the crypto ecosystem continues unabated.
The number of active projects involving on-chain tokenized financial products (such as tokenized funds, bonds, commodities, etc.) experienced explosive growth this year, reflecting that the long-term trend of bringing traditional financial assets on-chain remains undisturbed by market conditions.
Conclusion
Bitcoin has just undergone a deep washout: realized losses have reached capitulation levels, and speculative leverage has been comprehensively cleared.
At lower price levels, dense buying absorbed the sell-off, allowing the spot price to hold the final dense coin accumulation zone established since August.
The $62,000–$66,000 range is the critical defense line requiring close monitoring at present. If bulls can reclaim the $74,100 Short-Term Holder Cost Basis, it will mean most recent buyers escape the loss trap, and market structure will return to stability.
Join TechFlow official community to stay tuned
Telegram:https://t.me/TechFlowDaily
X (Twitter):https://x.com/TechFlowPost
X (Twitter) EN:https://x.com/BlockFlow_News
 @glassnode