Bernstein Research Breakdown: After Memory Stocks Pull Back, Slowing Price Hikes Misread as Topping Out
Written by: Rita
Storage stocks have pulled back from their June peak, with bears interpreting the deceleration in price growth for dynamic random-access memory (DRAM) and flash memory (NAND) as a sign of the cyclical top. In its October 21, 2026 report, Bernstein offered a contrary view: the slowdown stems from base effects and long-term contract price caps; absolute price increases remain at the 95th percentile historically, indicating the cycle has not turned down.
Bernstein refutes the bears with three arguments. Historically, quarterly sequential price increases of 15% to 20% still sit at the 90th to 95th percentile; the absolute price increase per GB was approximately $0.05 in C3Q26 and C4Q26, ranking at the 95th percentile over the past 15 years; long-term contract price caps suppress apparent growth rates, with SanDisk (SNDK) having over 50% of its FY27 shipments covered under agreements.
Hard disk drives (HDDs) are not facing a deceleration issue. Nearline HDD prices per exabyte (EB) increased year-over-year by only 13.6%, compared to roughly 400% for NAND and DRAM, leaving significant room for HDD acceleration. Bernstein maintains Outperform ratings for Seagate Technology (STX), Western Digital (WDC), and SanDisk, with FY27 earnings forecasts for the three companies approximately 12% higher than consensus.
Deceleration Driven by Base Effects
Bears focus on the narrowing quarterly sequential growth rates, ignoring the base effect. NAND contract prices rose sequentially by 85% to 90% in Q1 2026, 55% to 60% in Q2 2026, an estimated 18% to 23% in Q3 2026, and an estimated 15% to 20% in Q4 2026. DRAM dropped from 93% to 98% in Q1 2026 to 10% to 15% in Q4 2026.
Looking back over the past 15 years, a 15% to 20% quarter-over-quarter increase in NAND sits at the 90th to 95th percentile, while a 10% to 15% increase in DRAM falls between the 76th and 89th percentiles. The deceleration occurred following abnormal spikes in Q1 and Q2.
Smartphone OEMs began raising prices starting in H1 2026, with some brands adopting more conservative production plans. Consumer price sensitivity is nearing its ceiling, partially explaining the deceleration in price growth. High-end AI smartphones provide a demand floor. SanDisk's data center bit share rose from 12% in 4Q FY25 to 38% in 4Q FY26.
Absolute Price Increases Remain at Historical Peaks
NAND contract prices have increased more than fivefold over the past year. On this elevated base, a further 18% to 23% increase in C3Q26 adds approximately $0.05 per GB; a further 15% to 20% increase in C4Q26 adds another $0.05 per GB. An absolute increase of $0.05 per GB ranks at the 95th percentile over the past 15 years, second only to the first half of 2026.
The proportion relative to unit costs is even more direct. The absolute price increase in C3Q26 equated to 97% of unit costs, while C4Q26 accounted for 104%, both exceeding the 95th percentile over the past 15 years. Unit costs do not fluctuate in the short term alongside prices.
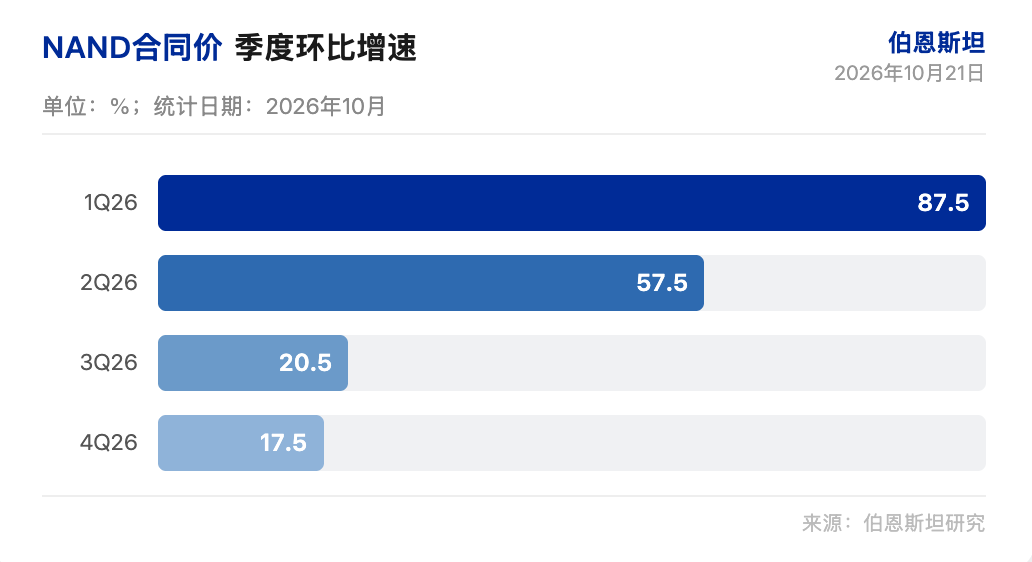
DRAM exhibits a similar dynamic. Both the absolute price increase and its share of unit costs remain at historical highs.
Long-Term Contracts Dilute Apparent Growth
As coverage under long-term contracts rises, the growth rate of the apparent blended average price will mechanically lag behind market contract price growth. Under the new business model, over 50% of SanDisk's FY27 bits and approximately two-thirds of FY28 bits come with price floors and ceilings. For Micron (MU), over one-third of its revenue through 2030 will be covered by supply agreements. Kioxia aims to have half of its shipments covered by agreements by 2028.
Bernstein provides an illustrative example. Assuming market prices have already hit contract ceilings, when long-term contract coverage is at 40%, a 30% surge in market prices translates to only an 18% actual price increase; at 60% coverage, it reflects merely a 12% increase.
SanDisk's long-term contracts provide downside protection. An average of 53% of bits from FY27 to FY30 are covered by agreements, implying a price floor of $0.26 per GB, which is only 19% lower than the recent quarterly blended average price. Data center customers have deposited $16.5 billion in deposits and guarantees, covering 17.6% of SanDisk's $93.9 billion minimum agreement revenue. Customers are willing to lock in price floors for 3 to 5 years and deposit high-coverage cash proportions.
HDDs Face No Deceleration Issues
Nearline HDD prices per exabyte (EB) rose only 13.6% year-over-year, compared to roughly 400% for NAND and DRAM. HDDs are earlier in their upcycle, offering greater room for price increases, and the trend may accelerate in the past two quarters.
Bernstein forecasts SanDisk's FY27 EPS at $238.36, versus consensus of $212.98, a 11.9% upside. Seagate Technology's FY27 EPS is projected at $40.61 versus consensus $36.34, a 11.7% upside. Western Digital's FY27 EPS stands at $23.39 versus consensus $20.82, a 12.3% upside. All three carry Outperform ratings, with target prices of $3,000 for SanDisk, $1,350 for Seagate Technology, and $770 for Western Digital.
Current P/E ratios for storage stocks sit at the lower bound of the cyclical peak range. SanDisk's FY28 P/E stands at 5.2x. Historically, during cyclical peaks, storage stocks traded at low single-digit to low double-digit P/E multiples. Bernstein argues that the long-term contract structure supports a valuation above the historical peak range for SanDisk, as price floors mitigate cyclically depressed earnings assumptions.
The deceleration in storage price increases is a statistical illusion. Whether long-term contract price floors can sustain earnings into 2028 remains the next variable to verify.
Disclaimer
This article compiles and interprets third-party broker research reports (Bernstein, October 21, 2026) by TechFlow Research, integrated with publicly available market information. The ratings, target prices, earnings forecasts, and related assessments cited herein reflect the views of the respective broker's analysts, representing solely their institution's stance. They do not represent the views of TechFlow Research nor constitute any investment advice.
Markets involve risks, and investment decisions require independent judgment. This article should not serve as the basis for buying or selling any securities.
Join TechFlow official community to stay tuned
Telegram:https://t.me/TechFlowDaily
X (Twitter):https://x.com/TechFlowPost
X (Twitter) EN:https://x.com/BlockFlow_News
 @chaoxiangooo