The Life and Death of an Ordinary Meme Coin
Author: Victor Ramirez
Compiled by: TechFlow
TechFlow Summary: Everyone knows Meme coins experience wild swings, but few use data to clearly explain just how short their lifecycles are. Coin Metrics used survival analysis to break down the complete trajectories of 150 Meme coins: a median peak at 17 days and zero value at 370 days. For those still betting on the next thousand-bagger coin, this is a brutal but necessary reference.
Key Takeaways
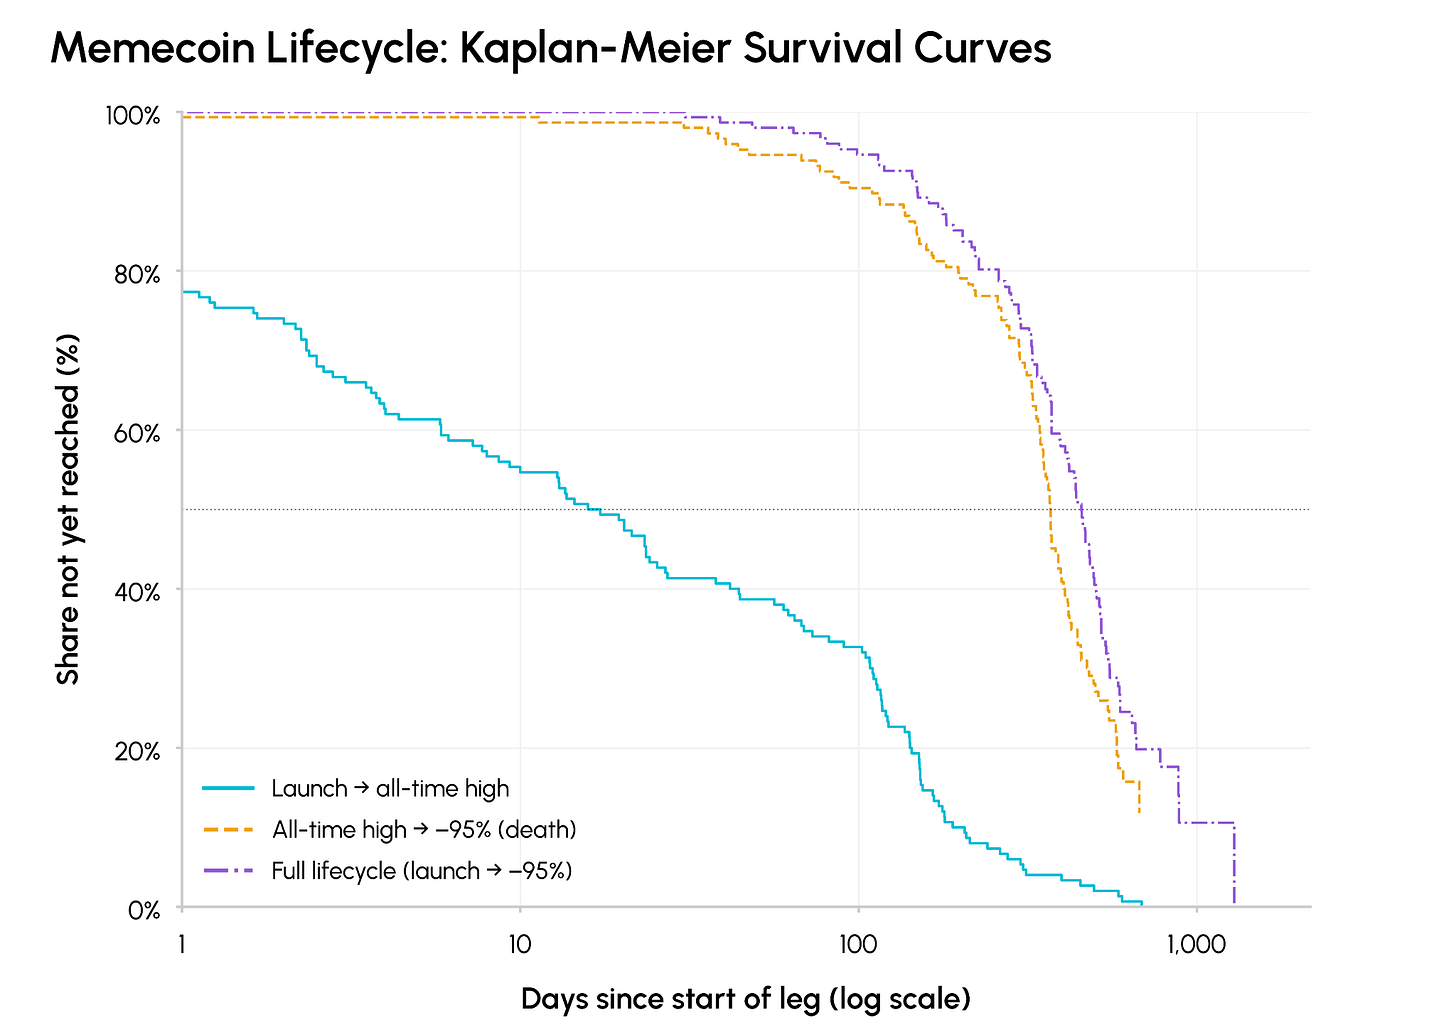
Meme coins peak incredibly fast but perish slowly. The median Meme coin reaches its all-time high (ATH) 17.2 days after its first trade, with one quarter peaking within 1.6 days. From peak to crash (-95%), the median takes 370 days.
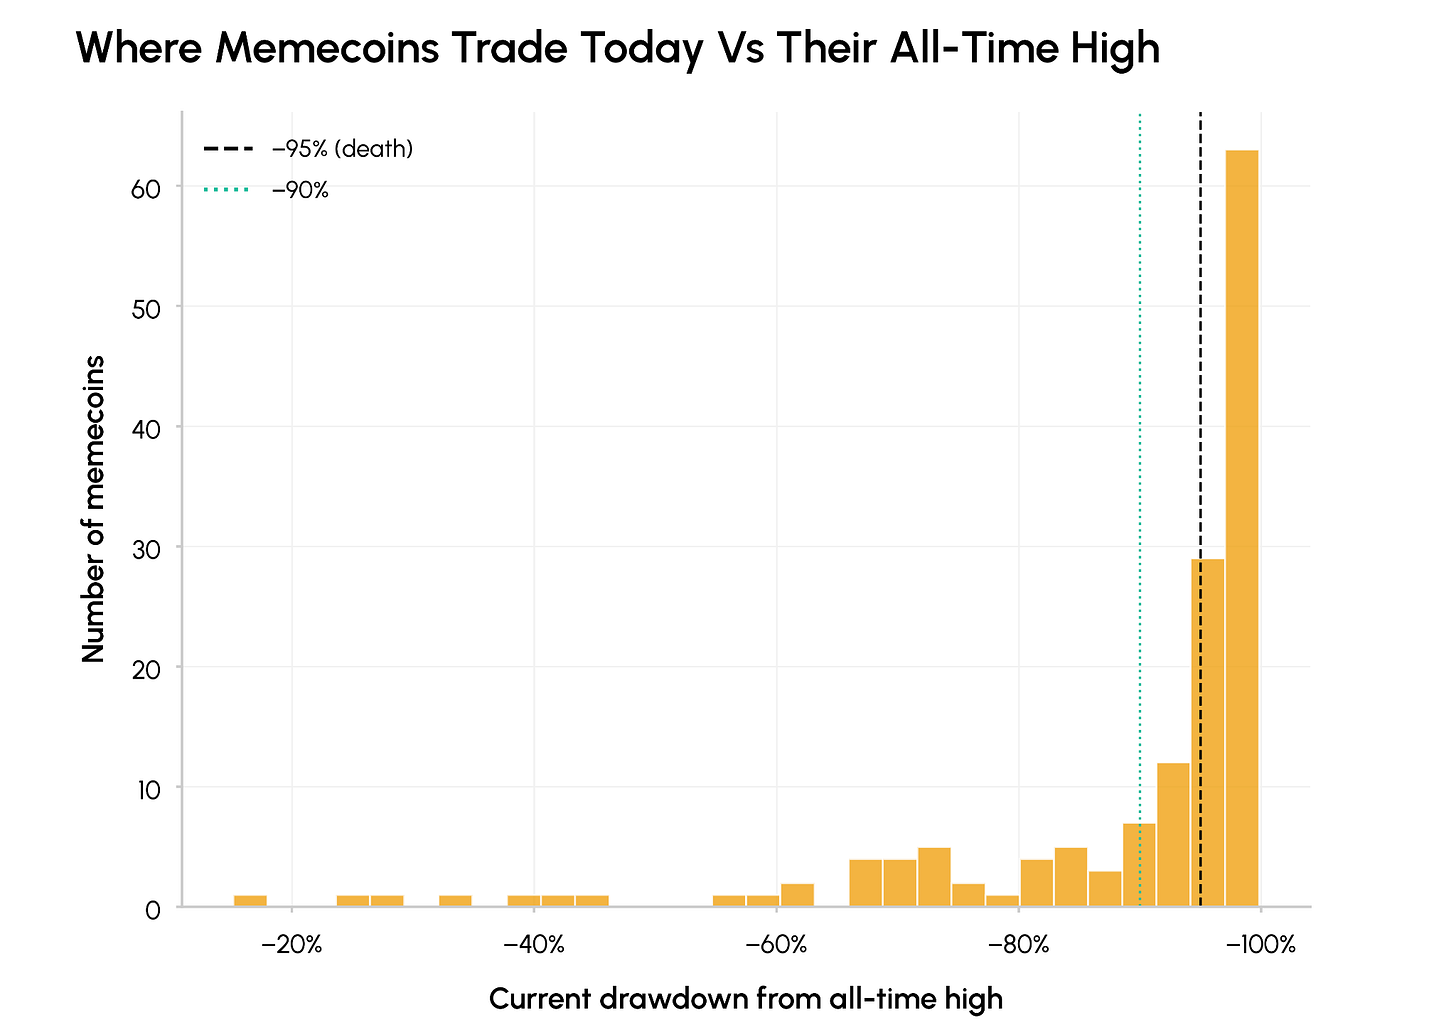
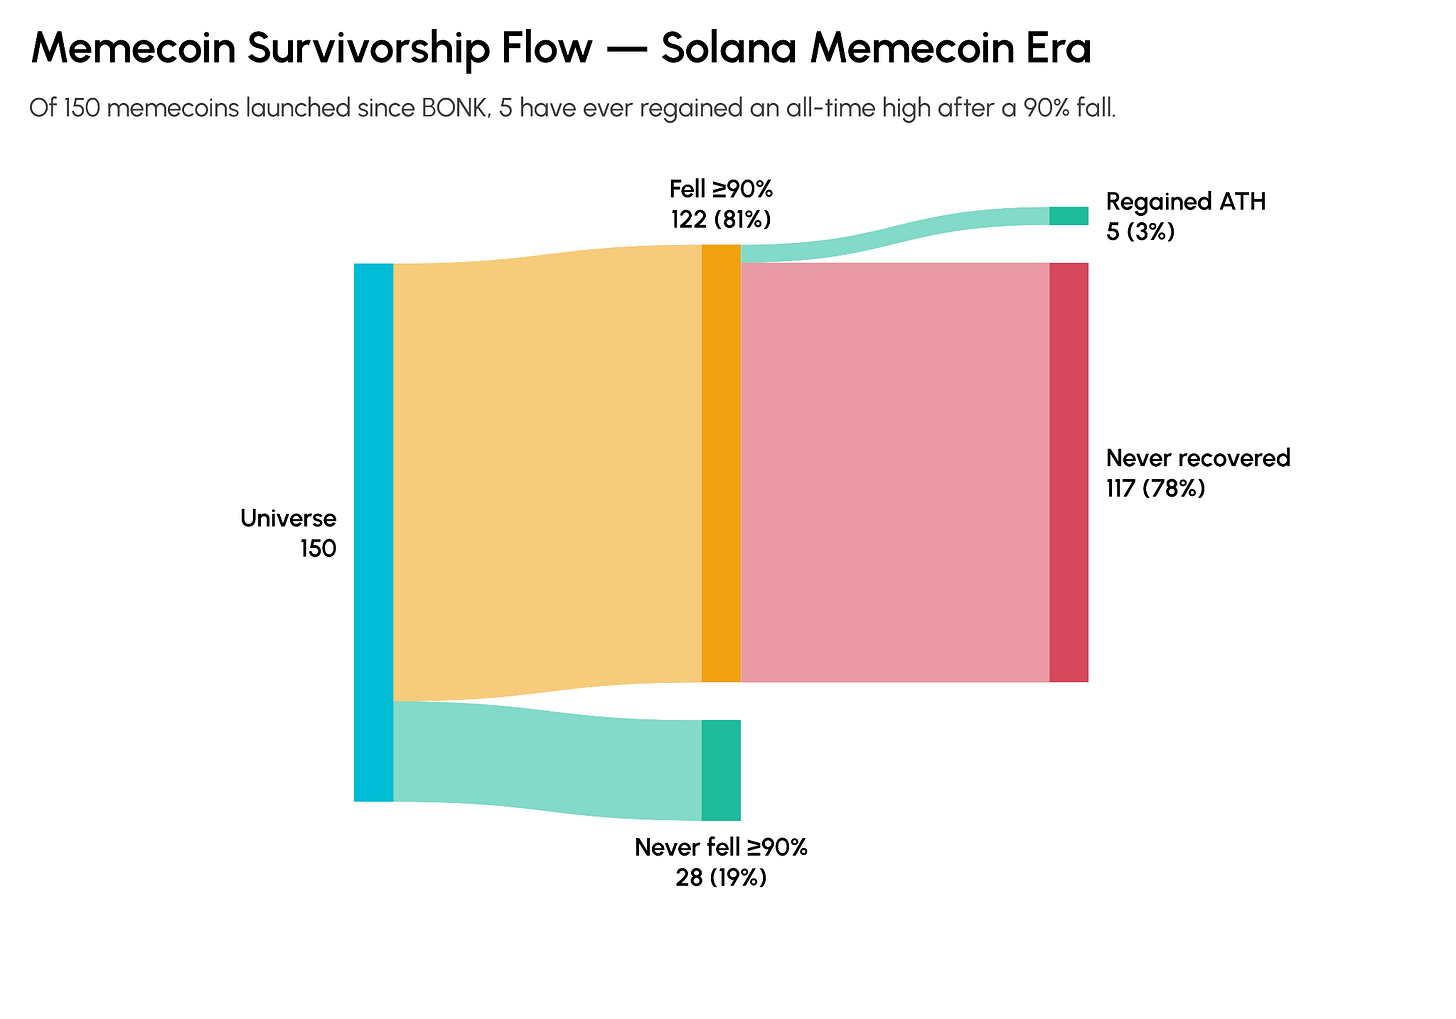
Recovery is virtually nonexistent. 81% of Meme coins have declined more than 90% from their all-time highs. Only five (3.3%) have ever reclaimed their historical peaks.
Introduction
Although Meme coins are often associated with retail speculation and staggering returns, they have proven highly effective at attracting attention and liquidity to new ecosystems. As Solana recovered from the FTX collapse, it saw a surge of Meme coin activity in late 2023; this was followed by Base in 2024, and most recently Robinhood Chain—where Meme coins are being paired and traded against tokenized equities.
But this viral and eye-catching nature also implies an extremely short lifecycle. Launchpad platforms like pump.fun and PONS have lowered the barrier to creating Meme coins, further amplifying this trend. Millions of Meme coins have been created, with only a tiny fraction making it to centralized exchanges, and an even smaller number surviving long-term.
The boom-and-bust cycles of Meme coins are common knowledge, but rarely quantified. How long do their market cycles actually last? And how well (or poorly) do they perform in the long run? This article measures the complete lifecycle of a representative batch of Meme coins—from initial pricing to collapse—to examine the sector through a top-down lens.
Modeling the Meme Coin Market Lifecycle Using Survival Analysis
To define the market lifecycle of these tokens, we first establish the following milestones:
Start: The token’s first trade on an exchange.
Peak: The Meme coin’s all-time high (ATH).
Crash: A 95% drawdown from the ATH.
We use the Kaplan-Meier estimator—a survival analysis technique commonly used in clinical trials to estimate median survival time—to measure the typical market lifecycle of Meme coins. The sample consists of 150 Meme coins from Talos Market Data, specifically those issued after BONK went live in December 2023, marking the full expansion of the Solana Meme coin era.
An important caveat is that this sample pool skews toward relatively successful tokens: to qualify, a token must have price data on at least one centralized exchange. This obviously excludes the vast majority of Meme coins generated on launchpads like pump.fun. Consequently, the data in this article systematically overestimates the lifespan of average launchpad Meme coins. The 95% drawdown threshold is also arbitrarily set, and threshold selection significantly impacts the estimated median lifespan.
Another caveat is that comparing against all-time highs puts the sample at a natural disadvantage. ATHs serve as a useful reference point, even though they can only be confirmed in hindsight, since alternative metrics (like local tops) are subject to unpredictable price discovery paths. Please treat this piece as an illustrative model rather than a precise statistical estimate.
Source: Talos CM Market Data Pro
How to read these curves: The estimator progresses from left to right. Whenever an event occurs, it asks: of the tokens still at risk, what proportion has just "died"? It multiplies these conditional survival rates. Tokens that survive continue to count toward the "risk" denominator throughout the observation period, before exiting, and are never counted as crashes. The curve starts at 100% and gradually declines; the KM median is where the curve crosses the 50% mark.
The conclusion is clear: the median Meme coin hits its ATH just 17.2 days after its first trade, with a quarter peaking within 1.6 days. From ATH to crash (-95%), the median takes 370 days.
Buyer Beware: The Cruel Returns of the Meme Coin Casino
Previously, we tracked the market lifecycle along the time dimension. Now, let’s look at how token price returns are distributed across different assets.
The chart below shows the distribution of Meme coin price levels relative to their ATHs. It reveals that over half of Meme coins are trading at prices more than 95% below their peaks.
Source: Talos CM Market Data Pro
Source: Talos CM Market Data Pro
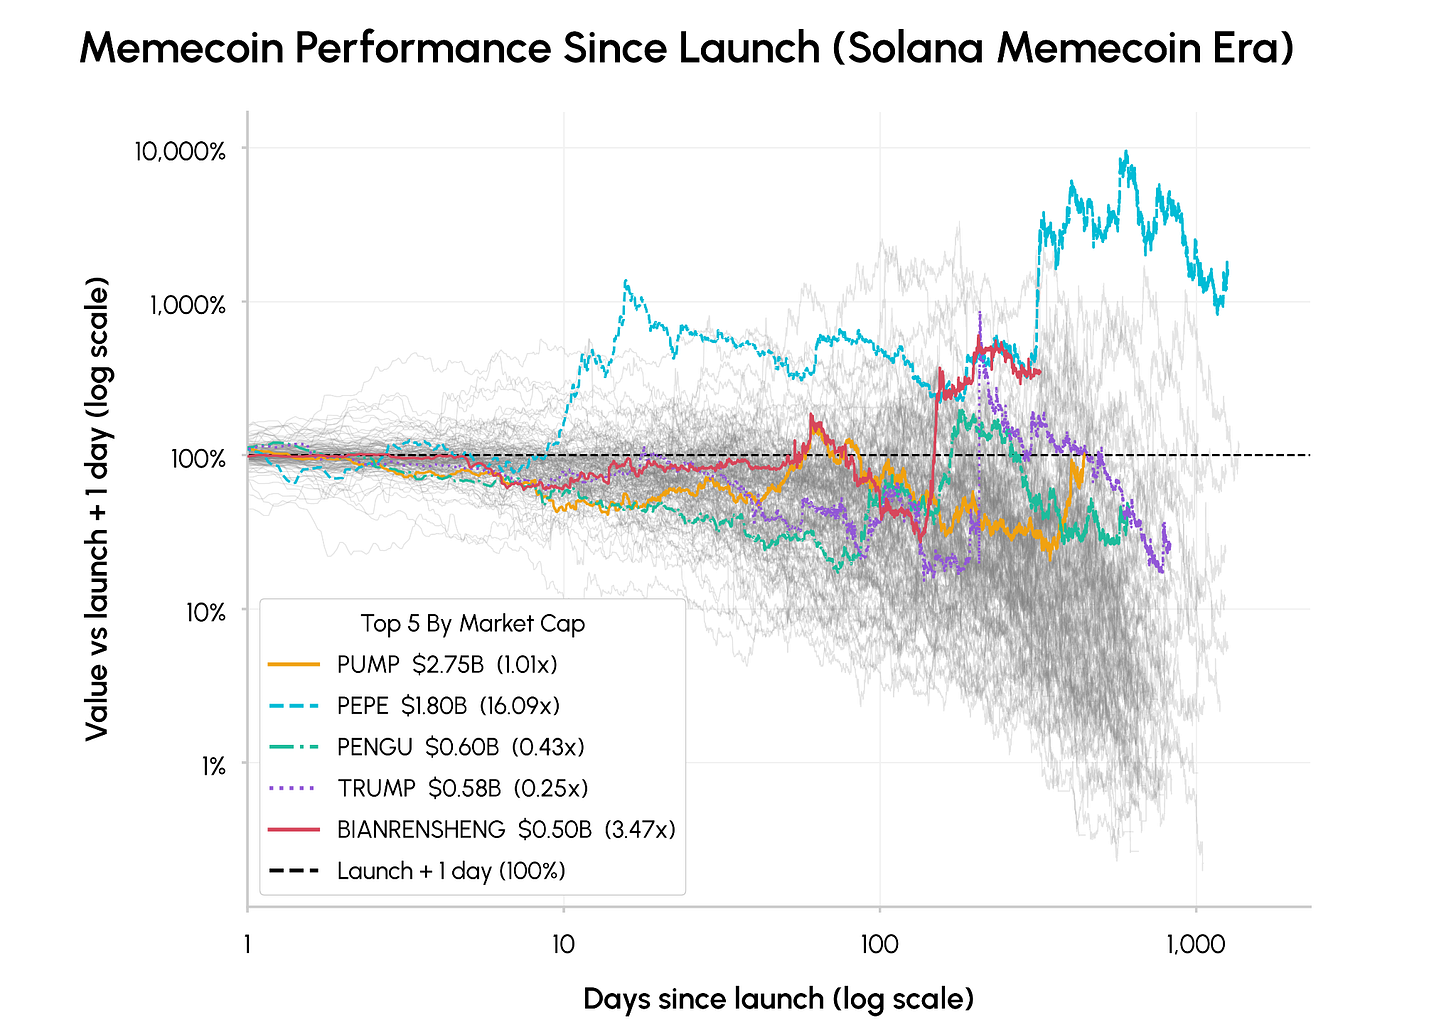
Most Meme coins start with returns clustered in a narrow range before shifting downward—only 5 out of 151 tokens trade above their day-one price. After 300 days, most tokens are worth only 10% of their initial value. Negative returns since issuance affect all Meme coins, regardless of size. Among the top five by market cap launched during the Solana Meme coin era, three (TRUMP, PUMP, and PENGU) currently trade below their issuance prices.
Source: Talos CM Market Data Pro
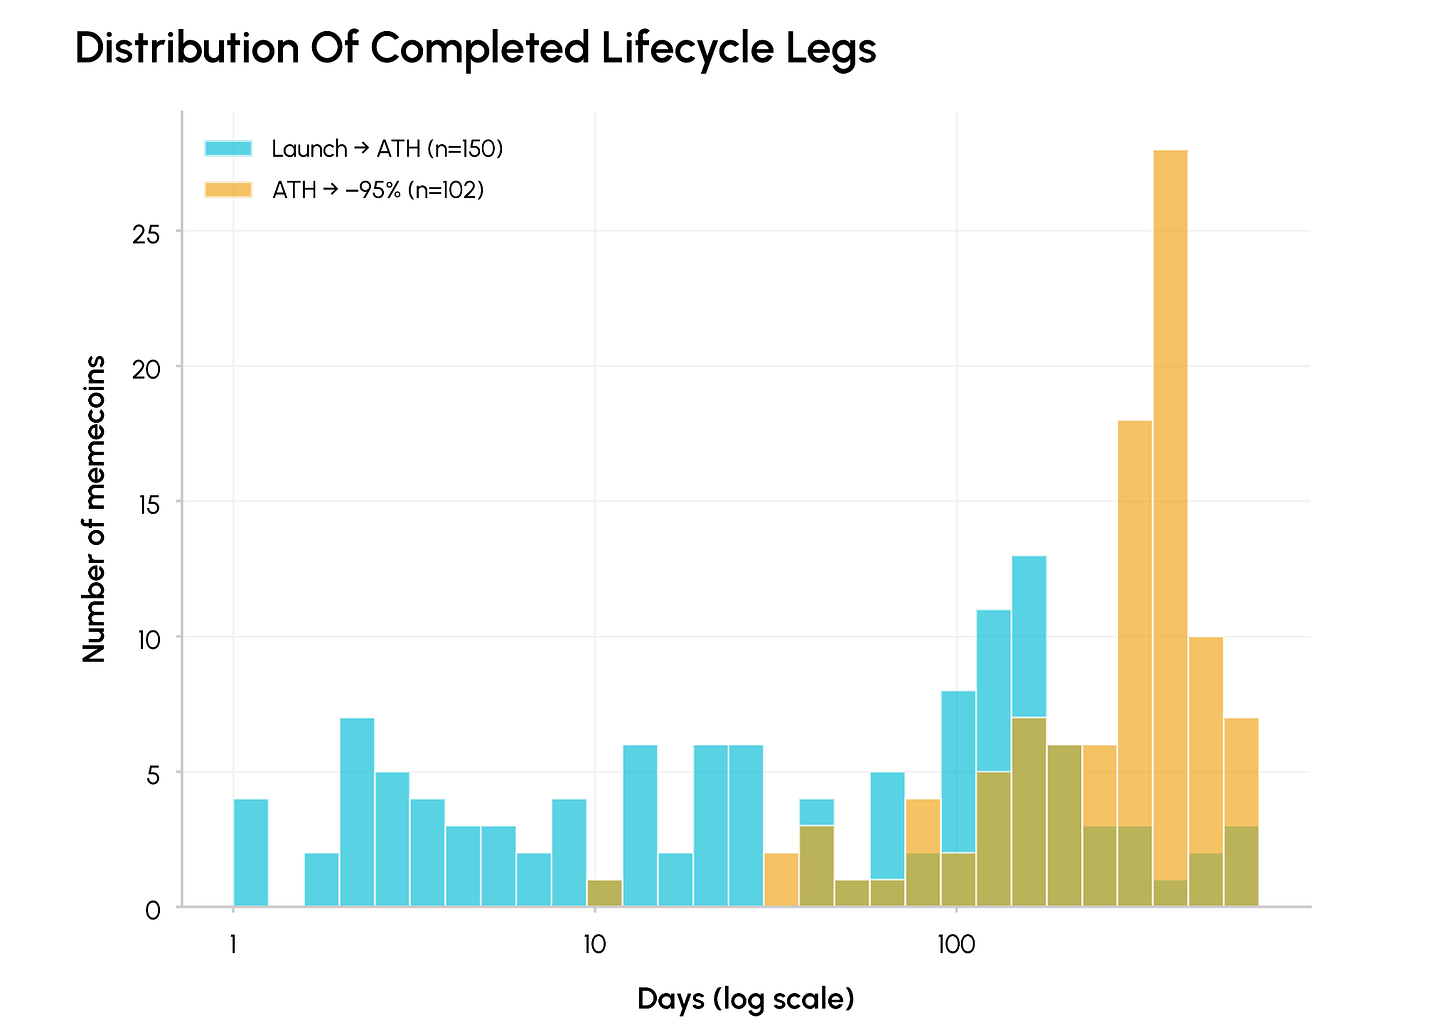
Of Meme coins launched during the Solana Meme coin era, 50% have already completed their full lifecycle from issuance to ATH to a 95% drawdown, averaging 456 days. By day 1,000, roughly 90% of tokens have fallen 95% from their peaks.
The Sankey diagram below illustrates the fate of Meme coins. Only 19% of Meme coins avoid a 90% drawdown from their ATHs. Of the 81% that do drop 90% from their ATHs, only 3% have ever reclaimed their historical peaks.
Is This the Top? Comparing Local Tops vs. ATHs
When the market whipsaws you around, how do you know if you’re facing a local top or the ultimate peak? No one can tell in advance, but historically, Meme coins rarely see more than one "top."
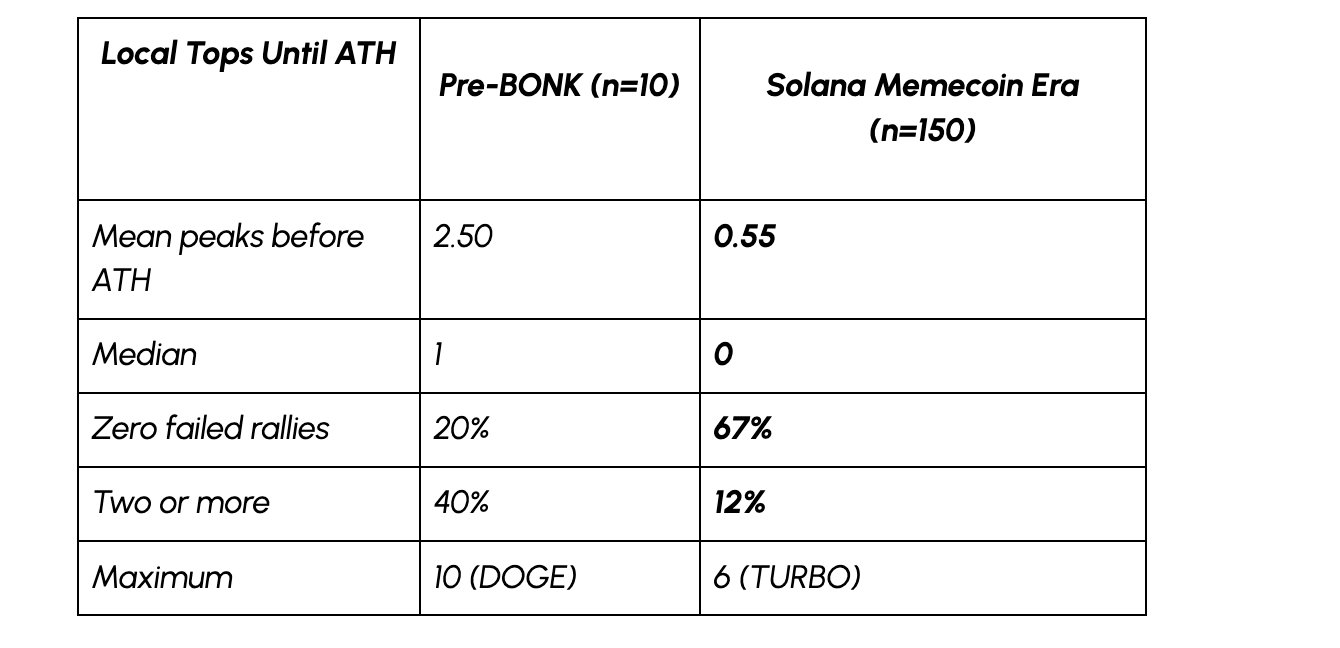
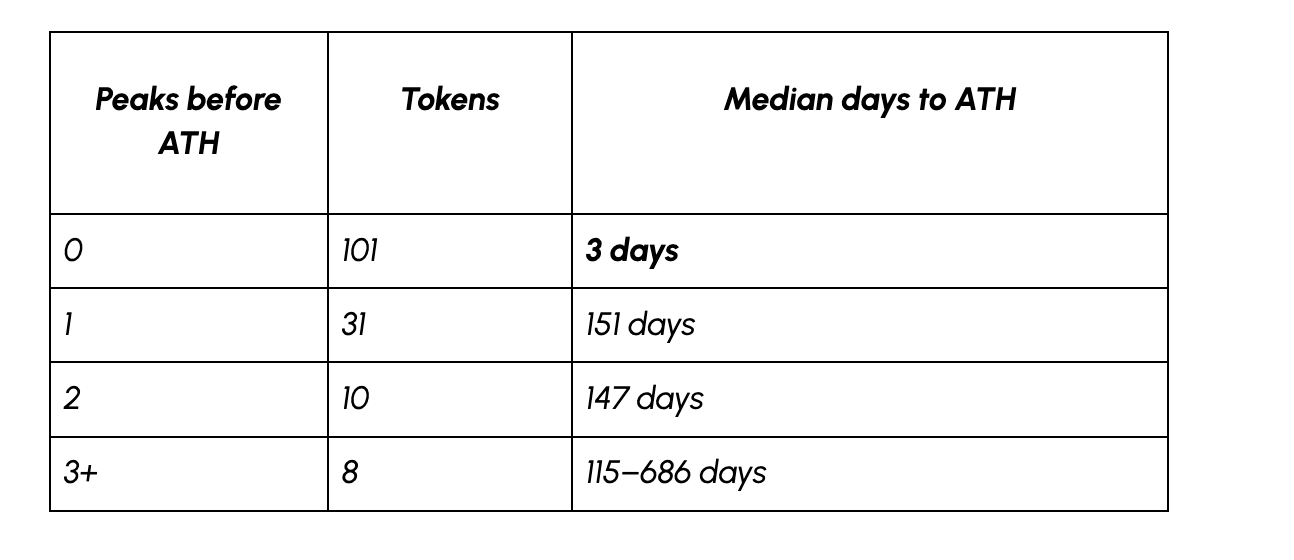
Two-thirds of Solana-era Meme coins have never posted a decent rally. They spike once, peak within days, and never come close to that level again. The remaining third take an average of several months to reach their ATHs.
Beyond Price: An On-Chain Activity Perspective
We can perform a similar analysis using on-chain activity. By tracking active addresses on Solana with balances of at least $1, we can compare activity peaks with current levels. Similar to price discovery frenzies, local tops in on-chain activity are rare before reaching a peak. On-chain activity rarely rebounds after its first peak. Currently, the number of active addresses for major Meme coins is less than 7% of their peak levels.
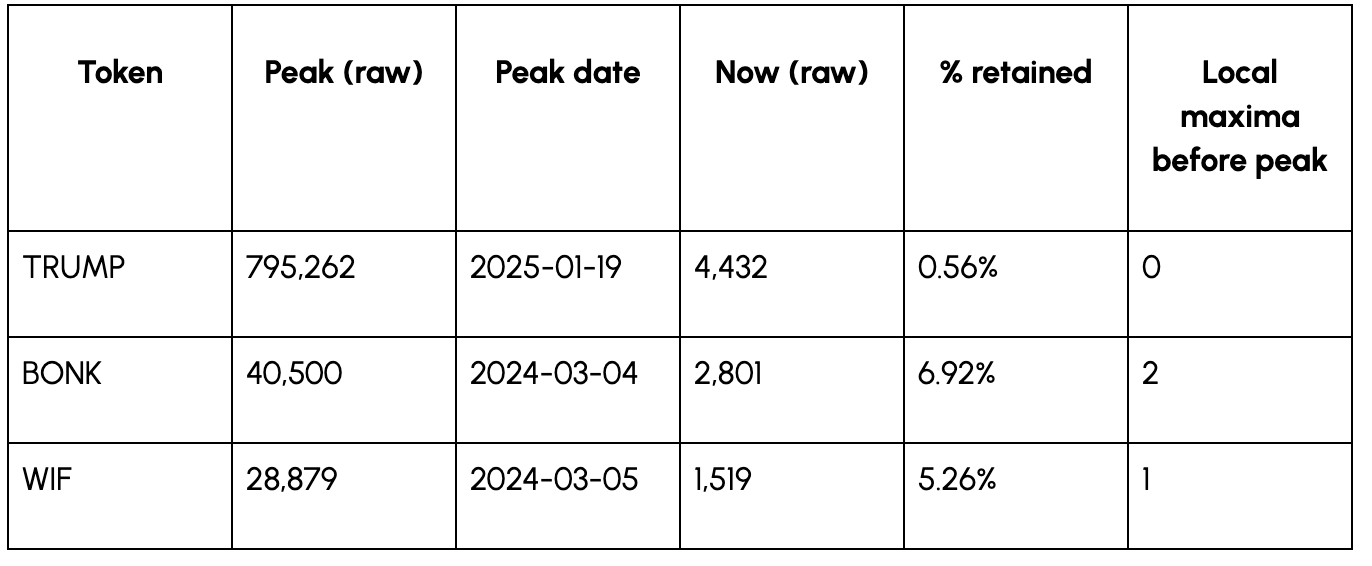
Source: Talos CM Network Data Pro
Outlook: Is the Bonk Era Collapsing?
These data paint a bleak picture for Meme coins overall. Does this signal the end of Meme coin speculation?
The evolution of Meme coin trading migrating to other platforms suggests otherwise. There is little evidence that the asymmetric returns of Meme coins reward bets made with extremely low hit rates. However, assuming Meme coin speculation relies on rational market participants making serious investment decisions is a category error. Although it is widely known that Meme coins are generally poor long-term investments, this hasn’t stopped new players from continuing to dip their toes in the trenches.
Speculation is deeply rooted in market culture, regardless of the underlying rails it builds upon. This isn’t unique to blockchain, although blockchain allows these markets to spread efficiently and permissionlessly. As more assets become financialized and tokenized on-chain, new forms of gambling are likely to continue emerging in entirely novel and unexpected ways.