Behind the 118 Million HKD Police Report: How Did the Coffee Pyramid Scheme with a 278% Annualized Return Come to an End?
Written by: BlockSec
On July 20, 2026, the mobile app of the investment platform Fun Coffee suddenly ceased operations. Investors in Hong Kong and Macau were unable to withdraw their principal or receive the promised returns, and repeated contacts with customer service went unanswered. Subsequently, the Hong Kong Police and Macau's Judicial Police Force identified it as a fraudulent syndicate. As of August 19, a total of 286 cases had been reported, involving an estimated total amount of HKD 118 million.

Fig. · Fun Coffee Victims' Rights Defense (Source: Sing Tao Daily)
The company publicly claimed its headquarters was located on Phu Quoc Island, Vietnam, with business operations focusing on high-tech coffee equipment R&D, coffee gene optimization technology, and smart irrigation and fertilization systems. It self-reported total assets exceeding $1 billion USD and over 5,000 employees. The investment plans disclosed by Hong Kong police are divided into three tiers: Sail, Grow, and Voyage, claiming annual returns of approximately 197% to 278%. Taking the highest tier, Voyage, as an example, an investment of 29,800 USDT (approximately HKD 230,000) for 570 days was said to yield around HKD 1 million in profit.
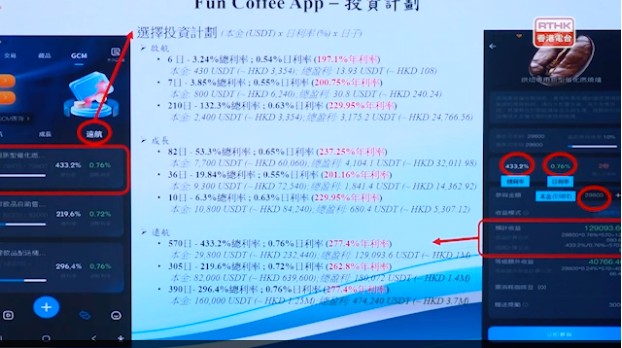
Fig. · Fun Coffee Investment Plans (Source: RTHK)
Our reconstruction began with the transfer records of one victim. This network, comprising 99 addresses, cumulatively received 72,829,035 USDT from external sources. As of this data cutoff, all funds had been fully transferred out. A sequential on-chain query of the current USDT balances across these 99 addresses shows a combined total of only 1.52.
The section regarding the case background draws from public disclosures by the Hong Kong Securities and Futures Commission (SFC), the People's Public Security Department of Khanh Hoa Province, Vietnam, and law enforcement agencies in Hong Kong and Macau, all of which have been cross-checked against original sources. All other data and conclusions stem from our independent analysis of on-chain records, covering only USDT flows on the TRON blockchain. Descriptions of address functions in this article are based on on-chain behavioral patterns and entity attribution records in the BlockSec tagging database, and do not constitute determinations of the holders' identities or legal liabilities. To protect victims' privacy, we do not disclose their wallet addresses, transaction hashes, or individual contribution amounts.
Regulatory Warnings Occurred Before the Platform Ceased Operations
Prior to examining any on-chain data, the timeline of public information itself warrants attention. The People's Public Security Department of Khanh Hoa Province, Vietnam, issued a risk warning as early as May 15, 2026, stating that the model's promised returns "are typically 10% to 30% per month," and encouraging participants to recruit new members through multi-tiered system commissions and team performance rewards, thereby identifying risks of disguised multi-level marketing and Ponzi schemes. The warning was explicit: these returns do not come from selling coffee but depend on funds from later joiners. On July 13, the Hong Kong SFC added "Fun Coffee GCM Project" to its list of suspicious investment products, registered under the category of other investments, and listed both the operator and promoter as Fun Coffee (Hong Kong / Vietnam), effectively treating both regions as a single entity under regulatory terminology.
On July 20, the App ceased operations. The Hong Kong Police's criminal investigation was launched after the shutdown, triggered by reports filed continuously starting in July. From August 1 to 3, law enforcement agencies in Hong Kong and Macau conducted a joint operation codenamed "Operation Junli," arresting 8 individuals in total. Among them, 6 in Hong Kong were arrested for conspiracy to defraud, including company directors, shareholders, secretaries, and core members responsible for promoting the project and recruiting investors. Police froze approximately HKD 610,000 in suspected criminal proceeds.
The platform's operational mechanics were inherently straightforward. Participants could earn bonus payouts by referring friends and family. Vietnamese police noted that presentation sessions explicitly taught recruits how to pull people in to secure system commissions and team performance rewards. All payments were processed entirely via cryptocurrency. According to Hong Kong police disclosures, after investors downloaded the App and registered, customer service would "instruct them to transfer virtual currency to designated cryptocurrency wallets; only after completing the recharge could they invest on the platform." Macau's model differed slightly: victims handed cash directly to store staff, who assisted with the recharge process. The investment funds ultimately reached upstream-designated cryptocurrency accounts, with those upstream contacts also responsible for allocating operational funds to the stores in crypto. Macau branches opened in November 2025.
91 Receiving Addresses Ultimately Converge into a Single Address
These 99 addresses are divided into four functional layers, none of which retain funds, as shown in Figure 1.
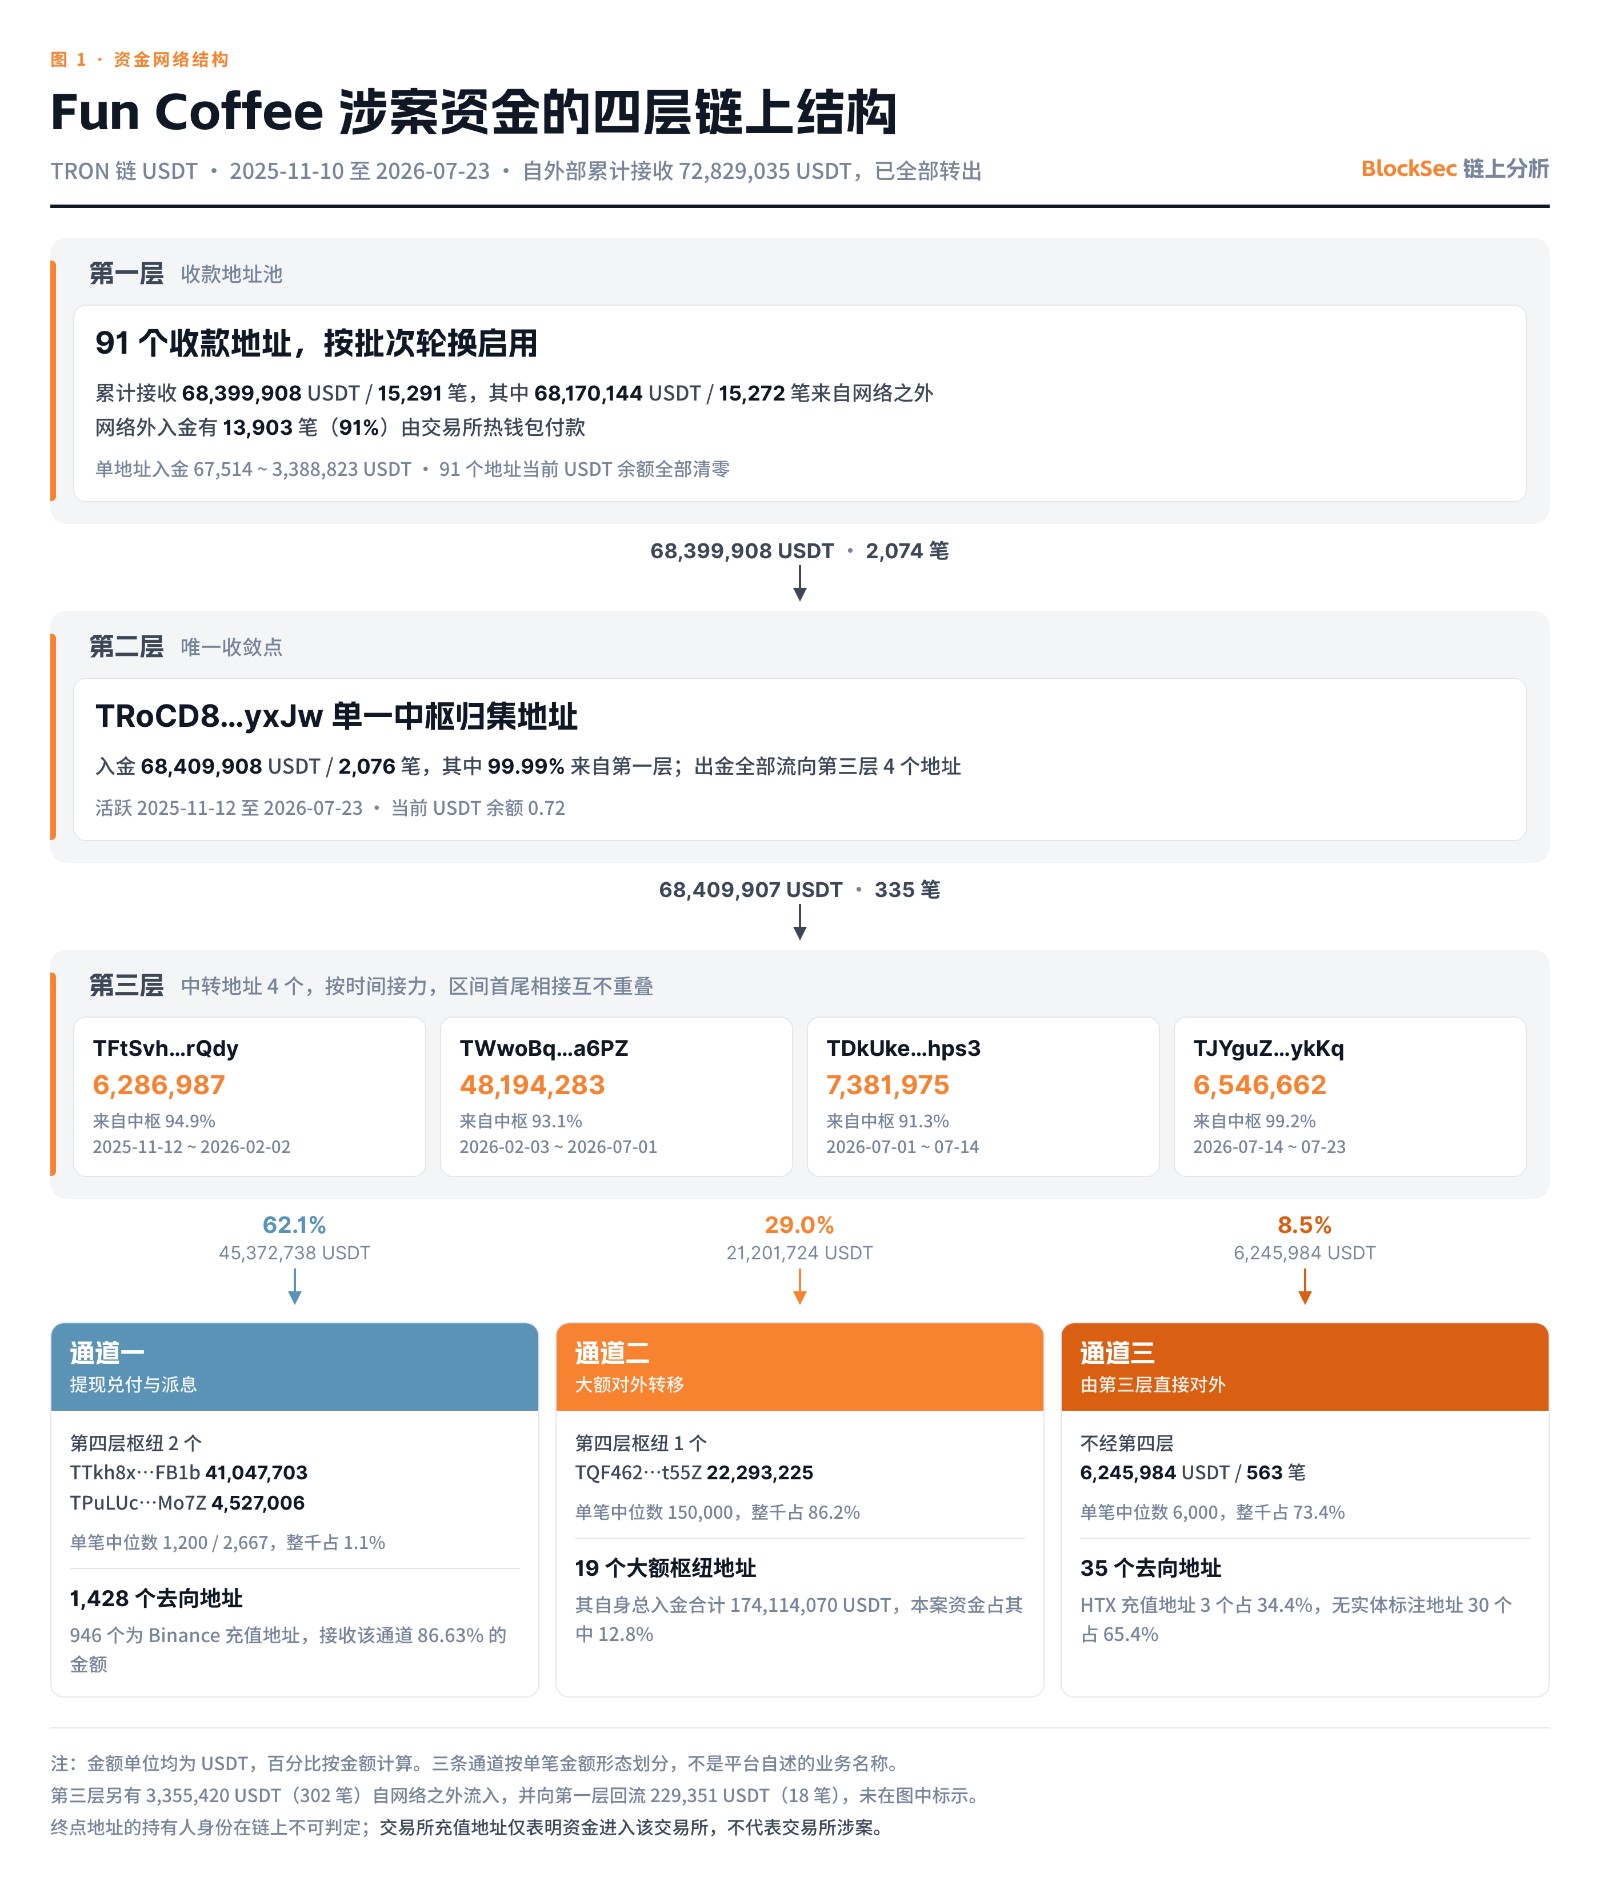
Fig. · Four-Layer On-Chain Structure of Funds Involved in Fun Coffee
Layer 1 consists of 91 receiving addresses. The platform constantly rotated publicly disclosed receiving addresses, operating as a pool activated in batches. Each address received between 67 and 649 deposit transactions. Of the 15,272 incoming deposits received from outside the network, 13,903 (91%) originated from exchange hot wallets—meaning retail users directly withdrew coins from their exchange accounts. This proportion for individual addresses ranged from 78.7% to 98.2%, with none falling below 50%, perfectly aligning with the modus operandi published by Hong Kong police.
Layer 2 comprises a single address where all funds received by Layer 1 converged. 99.99% of inflows came from Layer 1, while all outflows directed entirely to Layer 3's 4 transit addresses, retaining zero balance. This serves as the sole convergence point for the entire network. Precisely because of this centralizing node, we were able to reconstruct the complete structure starting from one victim's transfer record.
Layer 3 contains 4 transit addresses used sequentially over time. The funding intervals from the central node to these four addresses were consecutive and non-overlapping, with all three handovers occurring on specific dates (February 2–3, 2026; July 1; July 14). This pattern suggests not four parallel roles, but rather a single functional wallet reused three times. Layer 4 consists of 3 disposition hubs, absorbing 91.1% of outflows from Layer 3, where funds were subsequently segregated by purpose. One payout hub was active exclusively from July 15 to 23, 2026, perfectly coinciding with the window when the platform shut down and HK/Macau police began receiving reports. It served as the final payout address taking over after the previous hub ceased operations.
Two anomalies deviate from this neat layered architecture and warrant explanation. First, not all funds flowed down to Layer 4; 8.5% of Layer 3's outflows (totaling 6,245,984 USDT) bypassed deeper layers and exited the network directly. Second, not all capital entered through Layer 1; Layer 3 independently received 3,355,420 USDT (302 transactions) directly from external sources. Additionally, two hubs in Layer 4 handled 1,293,472 USDT that never touched the initial receiving addresses at all.
Nine-Month Monotonically Increasing Inflows Contradict Contracting Address Pool
Figure 2 illustrates the monthly inflow volume across Layer 1's 91 receiving addresses. Over nine months, inflows experienced zero decline, climbing steadily from 518,213 USDT to 14,349,354 USDT, making the final month's intake 27.7 times that of the opening month. The peak inflow month coincided precisely with the platform's shutdown in July 2026, indicating that fundraising intensity remained at its zenith prior to cessation. The platform did not fold naturally due to capital depletion.
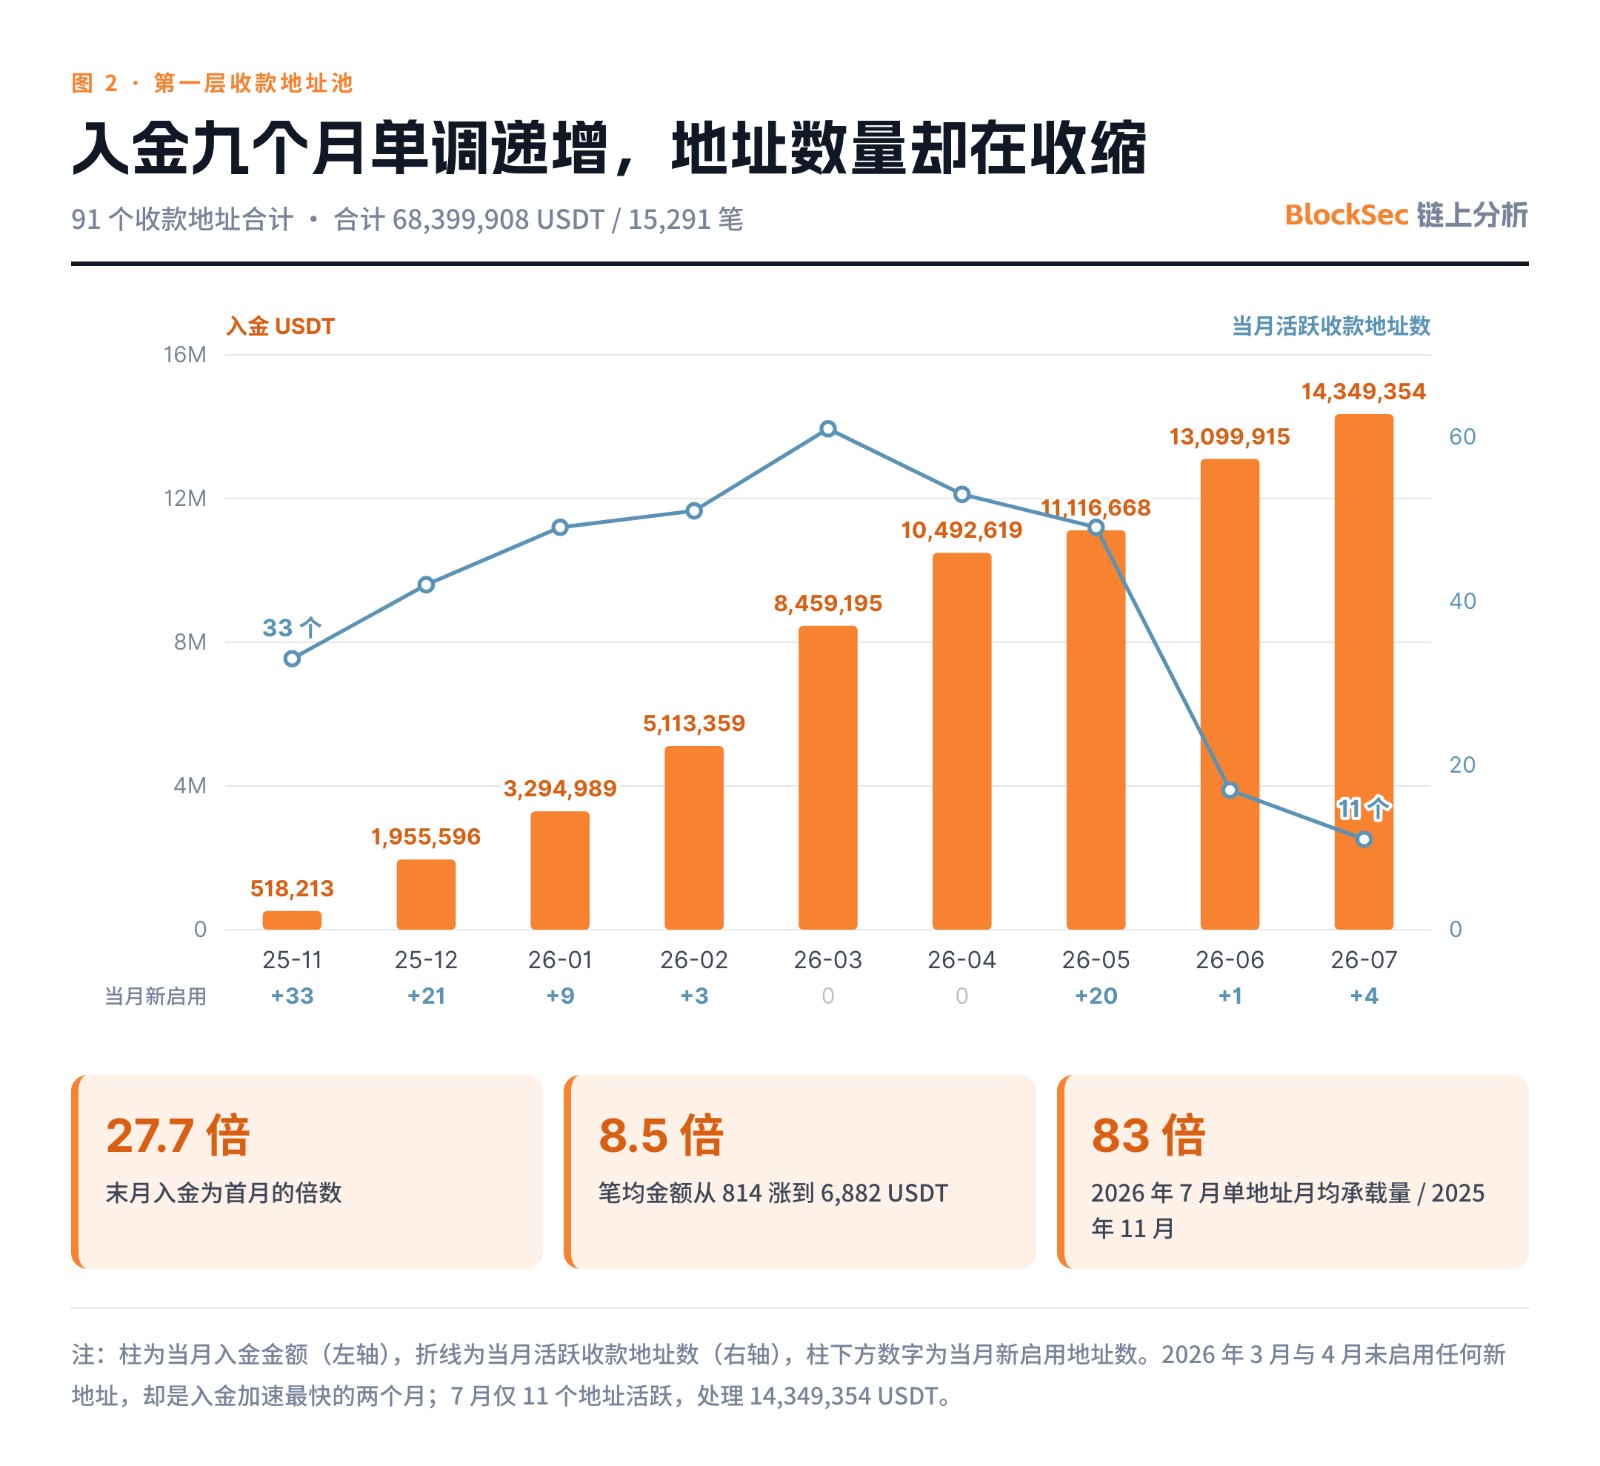
Fig. · Nine-Month Monotonically Increasing Inflows Despite Shrinking Address Count
More telling is the decoupling between address count and inflow scale. No new addresses were activated in March and April 2026, yet those were the two months with the fastest influx acceleration. By July, only 11 addresses were active, processing 14,349,354 USDT—an average of 1,304,487 USDT per address per month, representing an 83-fold increase compared to November 2025. The address pool did not expand gradually alongside capital growth; instead, it rolled out in bulk batches. Thirty-three addresses were deployed simultaneously in November 2025, followed by twenty more in May 2026, with minimal additions in intervening months. Subsequent growth was absorbed by increasing the capacity of existing individual addresses. Notably, the month the first batch of 33 addresses was activated perfectly aligned with the opening of Macau store locations.
Another metric revealing this shift surpasses aggregate totals: the average transaction value surged from 814 USDT to 6,882 USDT, an 8.5x increase. This indicates that beyond rising participant numbers, the single-investment amounts themselves were systematically escalating, with larger individual stakes placed as the scheme progressed.
Distinguishing Payouts to Investors vs. Fund Removal via Transaction Value Patterns
The network featured three distinct external exit channels. To determine the function of each, we analyzed the numerical patterns of individual outgoing transactions.
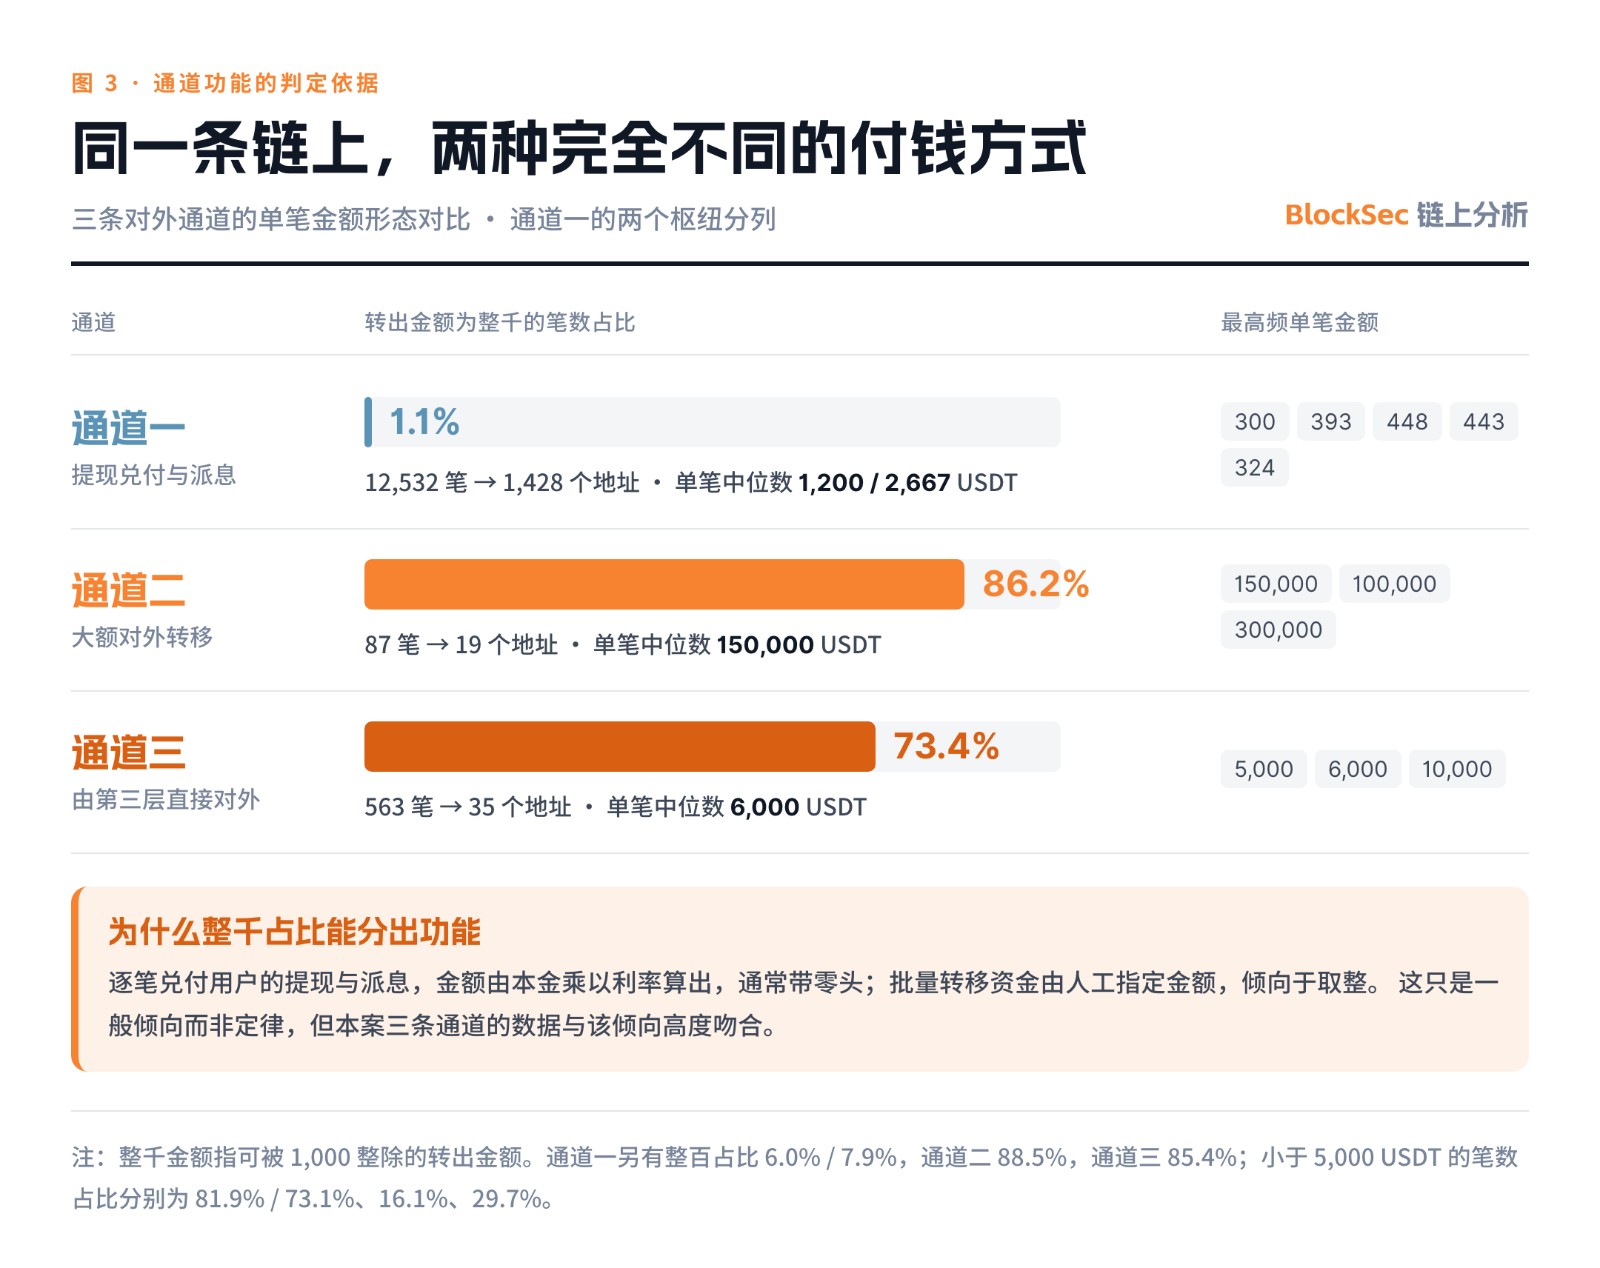
Fig. · Comparison of Individual Transaction Amount Patterns Across Three External Channels
The most striking discrepancy in Figure 3 lies in the proportion of round-thousand transactions. Channel 1 transfers rarely involve round numbers; round-thousand amounts account for merely 1.1%, with the most frequent values being precise figures like 393, 448, and 324. Conversely, Channels 2 and 3 saw 86.2% and 73.4% of transactions respectively consisting of round thousands, with peak frequencies hitting clean numbers like 150,000, 5,000, and 10,000. This divergence stems from how amounts are generated: manual, line-by-line disbursement of user withdrawals and dividends calculates amounts based on principal multiplied by interest rates, inherently producing remainders; bulk fund transfers rely on manually inputted specified amounts, which tend to be integers.
This represents a strong tendency rather than an absolute rule, as platforms can round dividend payouts, and transfer operators can deliberately use non-integer amounts. However, the data in this case aligns exceptionally well with this pattern. Coupled with the fact that Channel 1 executed 12,532 small-value transactions to 1,428 addresses, while Channel 2 routed 87 large-value transactions to 19 addresses, the functional nature of both channels can be reasonably established.
Channel 1 functions as the payout channel, breaking down 45,574,708 USDT into small remittances returning to investors and group leaders, with 86.63% flowing into 946 Binance deposit addresses. Channels 2 and 3 facilitate fund extraction from the network. The 19 downstream addresses linked to Channel 2 operate as independent large-volume hubs, having cumulatively received 174,114,070 USDT internally. Funds from this case comprise only 12.8% of their total intake; the origins of the remainder remain untraced.
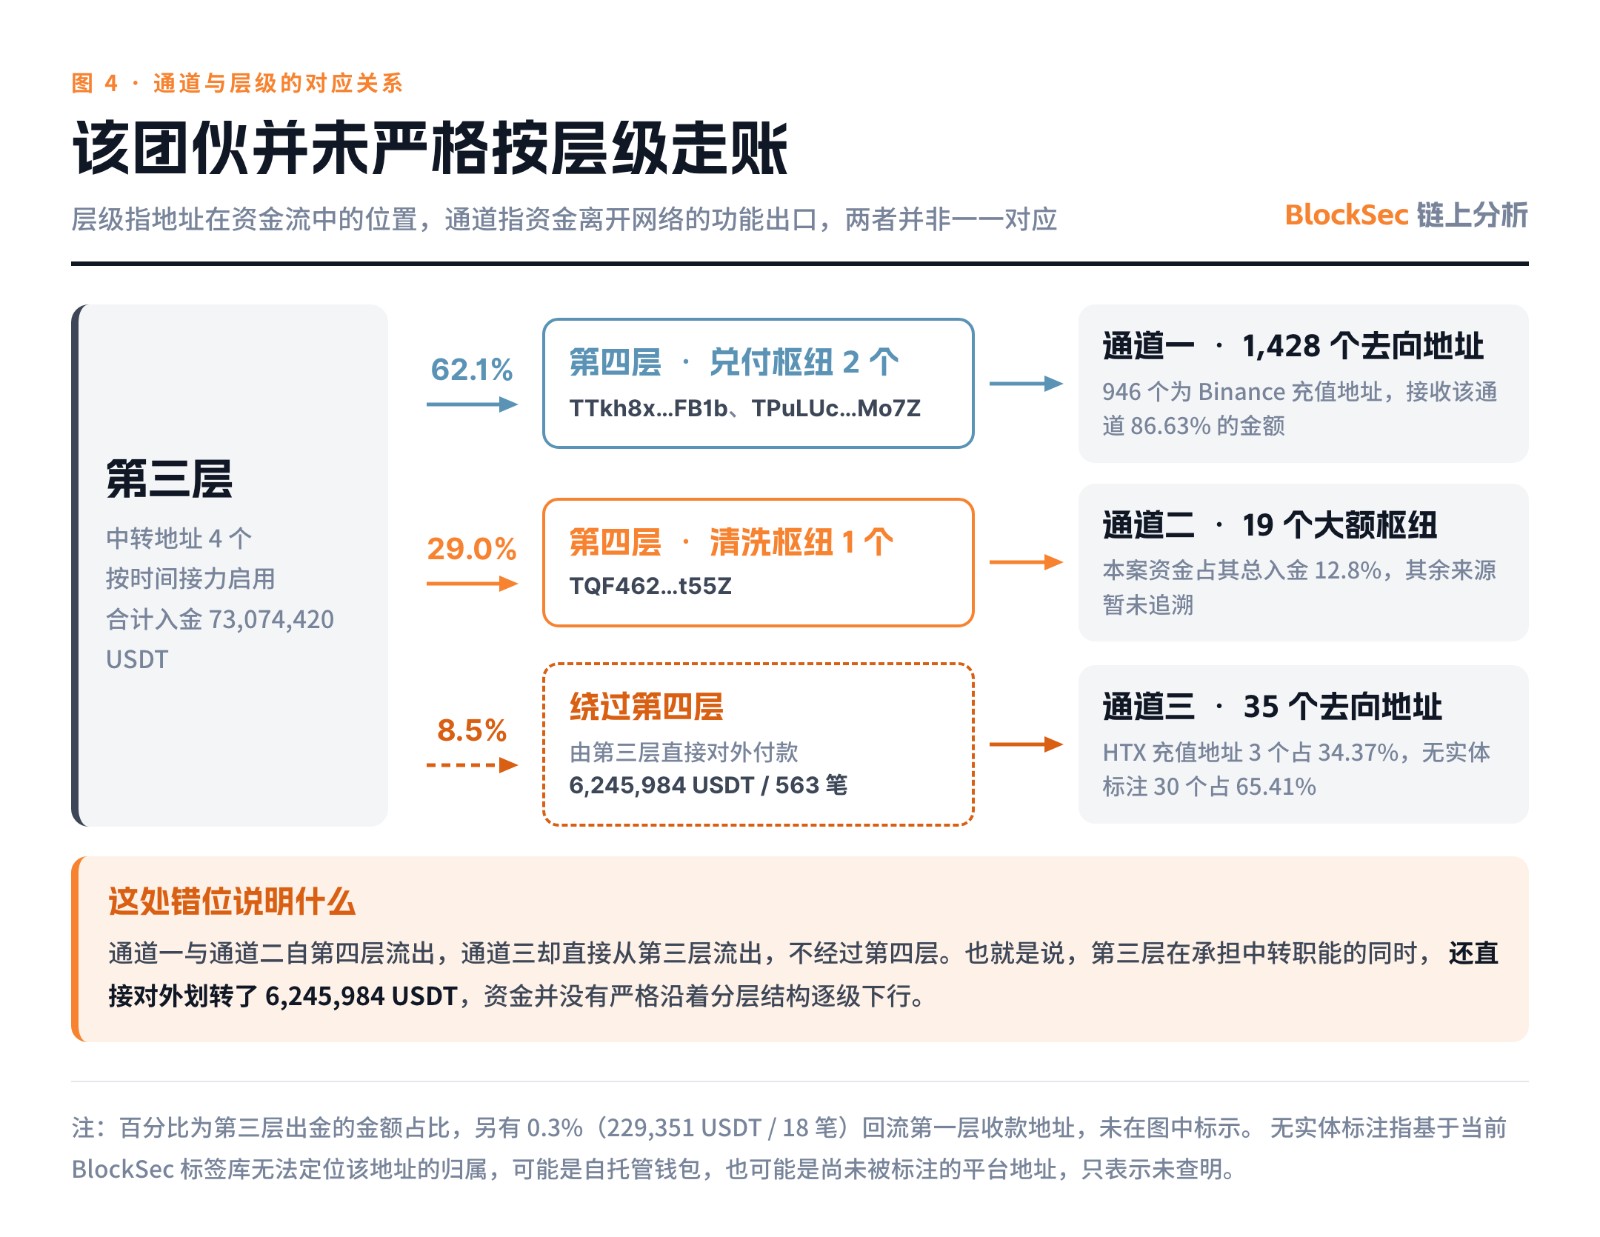
Fig. · Correspondence Between Channels and Layers
Layers and channels do not map one-to-one. Figure 4 reveals that while Channels 1 and 2 originate from Layer 4, Channel 3 exits directly from Layer 3, bypassing Layer 4 entirely. This misalignment indicates the syndicate did not strictly adhere to hierarchical accounting. While fulfilling its transit role, Layer 3 simultaneously executed direct external transfers totaling 6,245,984 USDT. Functionally categorized, of the 72,829,035 USDT exiting the network externally, 45,389,827 USDT flowed through the payout channel, whereas 27,439,208 USDT was diverted outward via Channels 2 and 3—a ratio of approximately 62% to 38%.
Most Outsource Individually Traceable On-Chain Recovered Principal
Conclusions in this section apply exclusively to investors individually identifiable on-chain; the scope must first be clarified. Users sending funds directly from personal wallets to receiving addresses allow chain-level tracking where every transaction maps to a specific address. Conversely, investors funding via exchange accounts remit through exchange hot wallets, where a single hot wallet represents tens of thousands of users, making it impossible to link specific contributions to individuals. After excluding addresses belonging to the network itself and micro-dust addresses contributing under 100 USDT, the former category yielded 175 addresses.
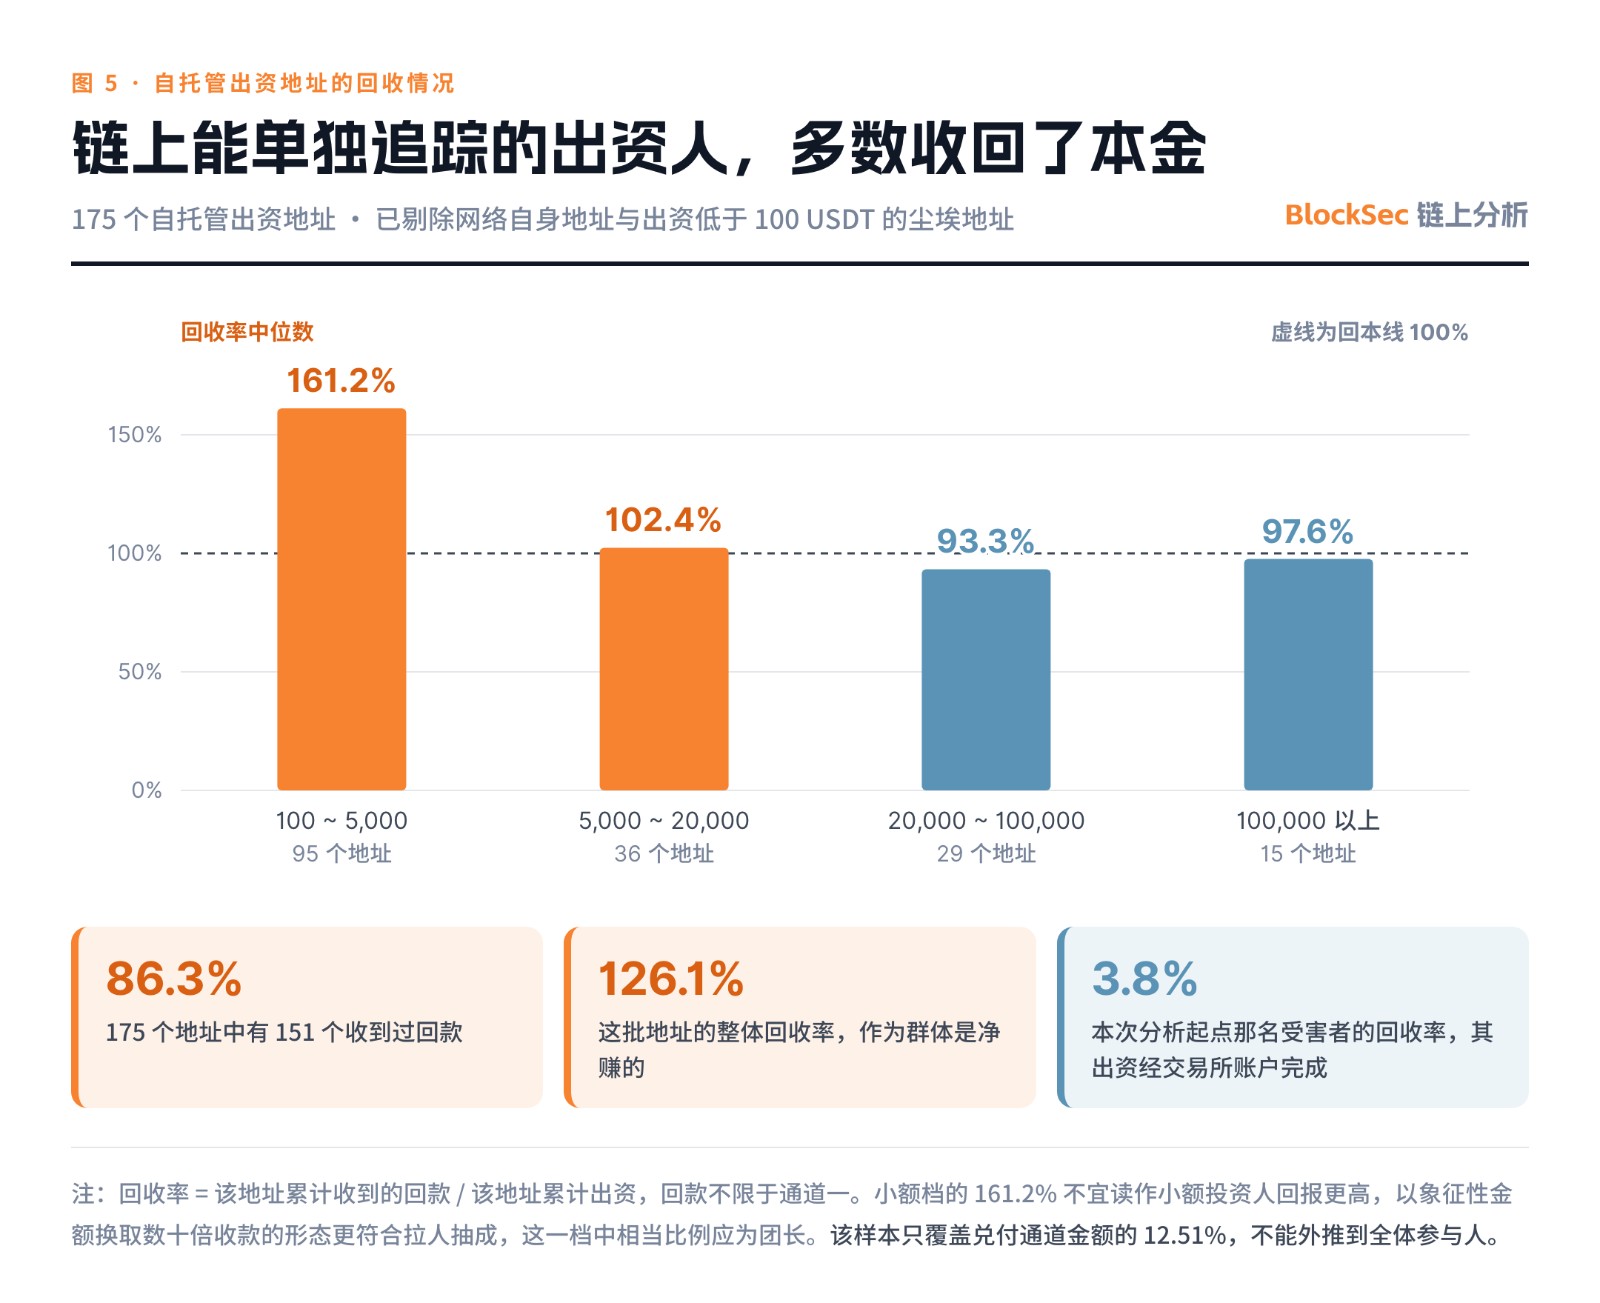
Fig. · Recovery Status of Self-Custodial Funding Addresses
Of these 175 addresses, 151 (86.3%) received repayments. Cumulatively contributing 6,211,277 USDT and receiving 7,830,067 USDT, they achieved an overall recovery rate of 126.1%. Among them, 110 addresses (72.8%) hit or exceeded 100% recovery, functioning as net profilers within the cohort. The remaining 24 addresses contributed without receiving any returns, totaling 466,630 USDT. Figure 5 presents median recovery rates stratified by contribution size, showing a declining trend as investment scales increased.
Grouping by initial contribution month reveals no temporal decline. Median recovery rates fluctuated between 75.0% and 183.2% across months, with the earliest cohort (November 2025) recording 113.4%. Thus, the classic Ponzi narrative of "early entrants profit while latecomers lose everything" did not manifest in this sample set.
This phenomenon is best explained by revisiting the timeline outlined earlier. The pyramid scheme did not collapse due to liquidity exhaustion; its shutdown month actually recorded the highest fundraising volume across the nine-month period. What truly fractured the operation were the May risk warnings from overseas police and the Hong Kong SFC's warning list on July 13. The platform subsequently suspended operations on July 20, with criminal investigations launching only thereafter. A funding pyramid interrupted by external factors while still heavily capitalized had not yet reached its cessation-of-payout phase.
This also elucidates why a project touting a 278% annualized return sustained operations for nearly a year: early participants genuinely received payouts, and their positive experiences became leverage for the platform to attract fresh capital. Hong Kong police characterizations of victim psychology align with this dynamic, noting that participants 「only saw others succeed in investing, and upon realizing their own investments yielded minor returns, believed in the plan's validity, lowered their guard, and further increased investment amounts」.
The 126.1% Recovery Rate Fails to Represent All Participants
This dataset carries two irremovable limitations. First, coverage scope. Comparing inbound versus outbound volumes within a single address only applies to self-custodial wallets. For exchange deposit addresses, investor contributions manifest on-chain as hot wallet debits, making direct comparison impossible. Collectively, these 175 addresses captured only 12.51% of the payout channel's total volume, leaving the 946 Binance deposit addresses (representing 86.63%) entirely outside the applicable range. By transaction volume, exchange-funded participants accounted for 91% of Layer 1 inflows.
The second limitation proves even more critical: this cohort netted profits precisely because on-chain individually traceable investors cannot represent typical victims. Participants using self-custodial wallets for such schemes tend to be more active, deploy larger sums, and enter earlier, with a significant portion acting as group leaders. This behavior pattern is glaringly apparent on-chain; one address contributed 581 USDT yet cumulatively received 100,434 USDT—a 173-fold disparity, with numerous other instances showing 100x and 75x multiples. Any deduction regarding victim losses based on this sample would systematically underestimate actual damages.
Nevertheless, we exercised caution regarding the "group leader" designation. Both invitational commission collectors and early-profit-taking exit investors exhibit on-chain signatures of receipts vastly outweighing contributions, making differentiation solely through this pattern impossible. Consequently, this article refrains from labeling any specific address as such. By analogous logic, the 1,650 to 1,950 individuals we cross-calculated from inflow volumes and payout channel destination counts reflects participant scale rather than victim count. Payout channel recipient addresses inevitably mix ordinary investors, group leaders, and potentially operator cash-out accounts. This range leans conservative; estimating based on actual retail participation frequency could push total participant numbers toward the 7,000 threshold.
The victim whose transfer records initiated this analysis happens to provide a direct counterpoint. His entire contribution routed through exchange accounts, making the exchange hot wallet the payer, thus excluding him from the aforementioned 175 addresses. Yet, he recovered only ~3.8% of his principal, differing by two orders of magnitude from the 126.1% aggregate recovery rate observed in self-custodial samples. While a single case lacks statistical weight, its trajectory mirrors the previously noted bias perfectly: those invisible on-chain may face drastically worse outcomes than their visible counterparts.
Quantifying Actual Participant Losses
Losses are commonly measured via three metrics, only one of which suits formal claims by participants. The platform's bookkeeping metric refers to the cumulative participation value displayed within the App. It includes reinvested book profits and tier-based rewards, significantly overstating actual capital deployed.
The on-chain cumulative receipt metric denotes the total sum received by payment addresses from external sources, yielding a recoverable figure of 68,170,144 USDT in this investigation. While legally evidentiary, it does not equate to actual loss: within Ponzi architectures, identical capital cycles multiple times between contributions and disbursements, ensuring cumulative receipts inherently exceed true net losses. Furthermore, on-chain analysis cannot isolate whether this total includes artificially injected operator funds designed to fabricate trading volume. The third metric is net loss—the actual capital deprivation suffered collectively by participants—which remains the sole appropriate baseline for damage claims.
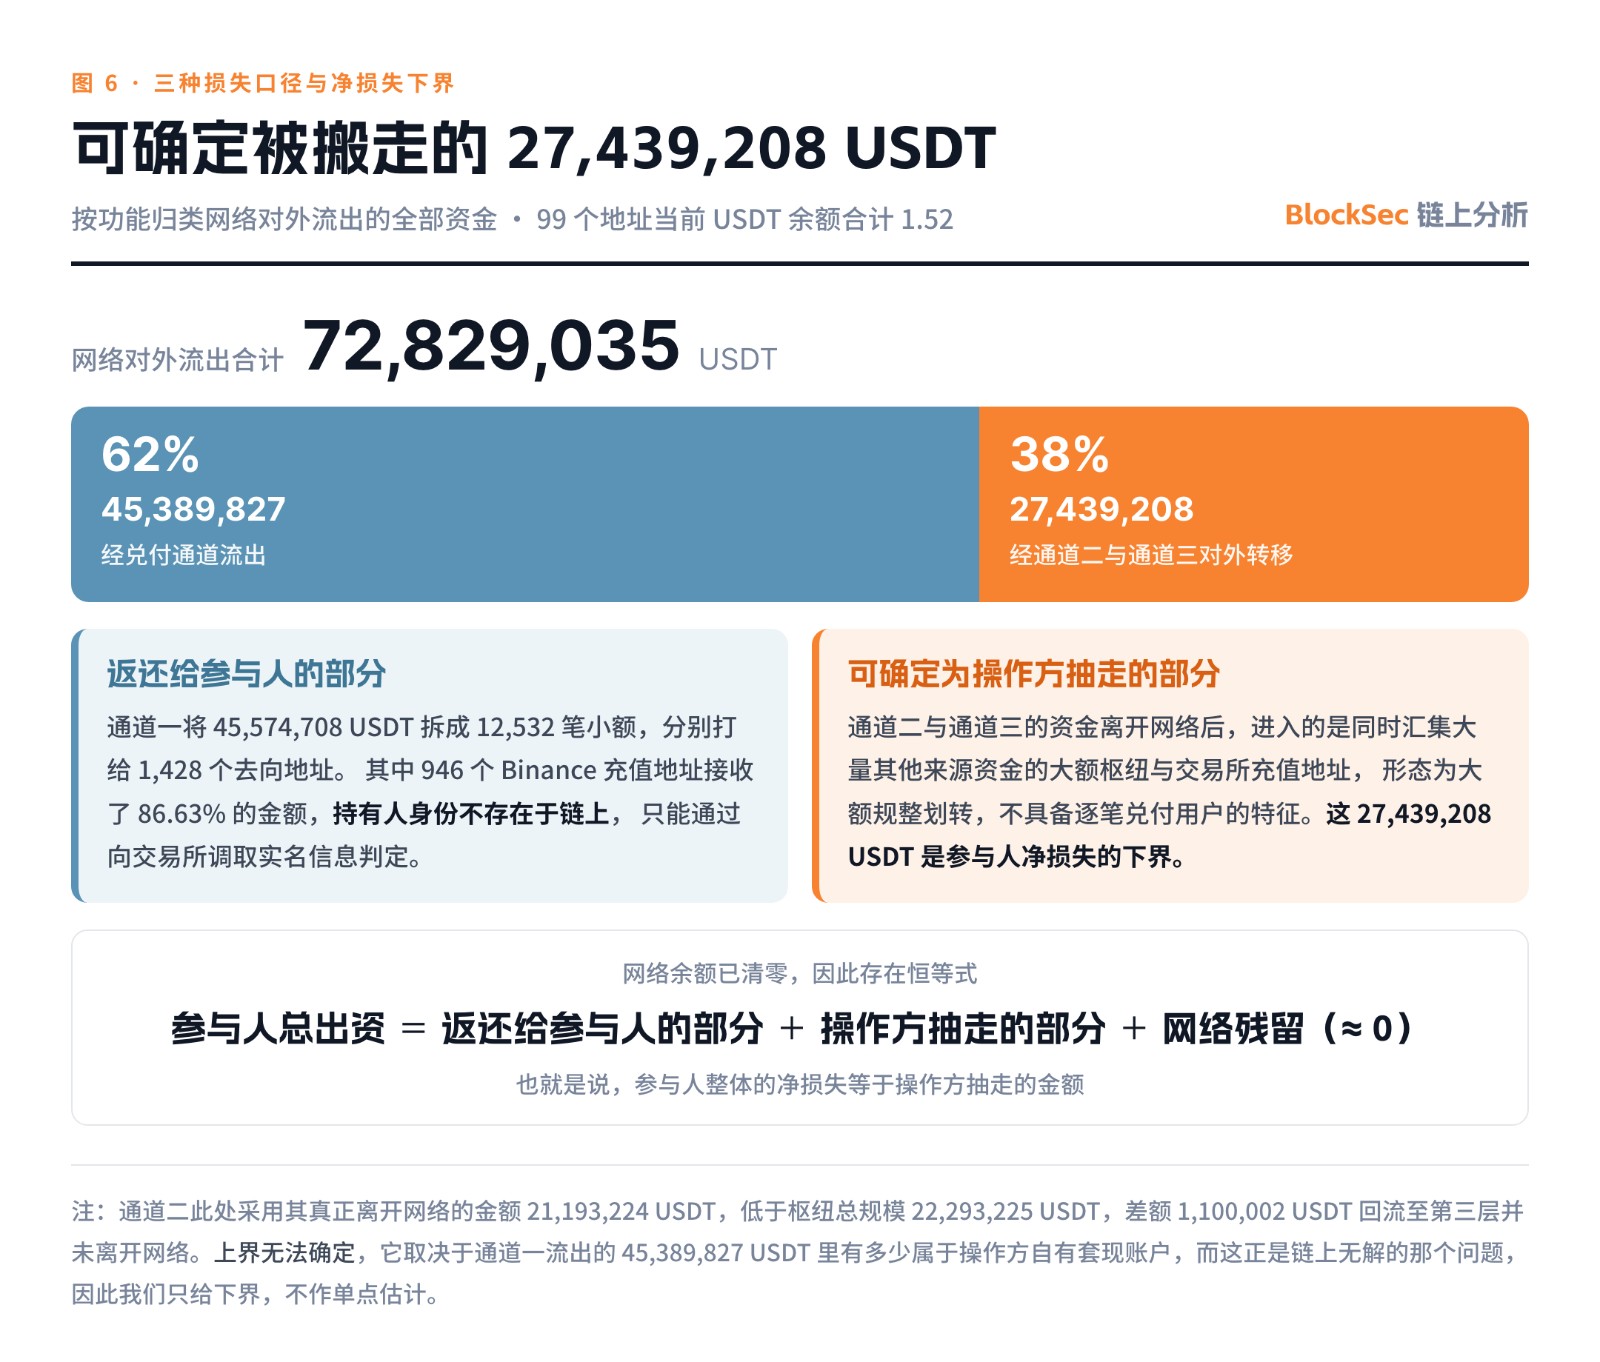
Fig. · Three Loss Metrics and Net Loss Lower Bound
As illustrated in Figure 6, since all funds across these 99 addresses were fully disbursed and zeroed out, a mathematical identity holds: Total Participant Contributions = Amount Returned to Participants + Amount Diverted by Operators + Network Residuals (≈ 0). Consequently, collective net loss equals exactly what operators siphoned off. Among the three channels, once funds exit via Channels 2 and 3, they merge into high-volume hubs and exchange deposit addresses simultaneously aggregating massive unrelated capital. Characterized by bulk, round-number transfers lacking line-by-line user payout features, these routes definitively constitute external relocation. The actual net outflow from the network via Channel 2 totals 21,193,224 USDT, and 6,245,984 USDT via Channel 3, combining for 27,439,208 USDT. This establishes the lower bound for participant net losses.
We cannot determine the upper bound. The theoretical ceiling should equal the lower bound plus the fraction of Channel 1's 45,389,827 USDT outflow that redirected to operator-controlled cash-out accounts. Resolving this hinges on identifying how many of the 946 Binance deposit addresses belong to the syndicate—a question fundamentally unresolvable through on-chain analysis alone. Therefore, this report provides only a lower bound, withholding upper estimates and single-point predictions.
Even this conservative estimate relies on the assumption that Channel 3 destinations lie completely outside the network. Among 1,636 external addresses interacting with this network, 160 exhibited bidirectional flows, simultaneously sending and receiving from the scheme. Such patterns suggest a subset functionally belonged to the same operator but fell outside our initially defined 99-address boundary. If subsequent verification incorporates them, both Channel 3 external outflows and the net loss lower bound require downward adjustments.
On-Chain Analysis: Capabilities and Limitations
Beginning from a single victim's transaction trail, on-chain data successfully mapped the entire fraud ecosystem: 91 rotating receiving addresses, one centralized convergence node, 4 sequentially utilized transit wallets, 3 functionally distinct exit channels, and the verifiable identification of 27,439,208 USDT diverted externally rather than returned to investors.
What on-chain tools cannot yield is identity. Those 946 exchange deposit addresses controlling 86.63% of the payout channel's funds mark the definitive limit of blockchain analysis. While each exchange deposit address corresponds to a centralized exchange account, determining the account holder's identity or verifying whether that individual also contributed directly to the platform requires off-chain intervention. Chain data lacks this metadata; resolution necessitates subpoenaing exchange KYC records alongside supplementary offline evidence. Beyond this threshold, investigative challenges transition from analytical problems to institutional record retrieval issues. The logical next step for such cases invariably forces engagement with exchange compliance departments.
Analytical Scope: USDT on TRON Blockchain. Transaction data cutoff: August 24, 2026. Balance queries conducted: August 25, 2026. Public source verification completed: August 25, 2026. Percentages cited throughout are calculated by volume unless explicitly denoting address counts. Addresses lacking identifiable entity attribution on-chain are uniformly tagged as "No Entity Marked," indicating undetermined status solely, not confirmed personal wallets. Exchange deposit address usage merely signals fund entry into the respective exchange, implying zero association or involvement by the exchange itself.
Join TechFlow official community to stay tuned
Telegram:https://t.me/TechFlowDaily
X (Twitter):https://x.com/TechFlowPost
X (Twitter) EN:https://x.com/BlockFlow_News
 @BlockSecTeam