Technology Stock Investment Methodology: N-Shaped Pattern, Two Market Waves, Four Key Points
Author: Chaoxiang Research
Recently, the strategy team of SDIC Securities released a long report titled "Investment Methodology for the Technology Industry," attempting to answer a question all tech investors ask: how exactly to buy and sell tech stocks.
For a company like Yangtze Power, analysts can calculate how much money it will earn each year over the next ten years; discounting future cash flows back gives the stock price.
Tech stocks cannot be accounted for this way. Because technological evolution is leapfrogging, a single catalytic event can overturn the logic of an entire industry. In 2019, the market believed general artificial intelligence was 80 years away; in 2022, it shrunk to 8 years; in 2023, ChatGPT emerged, and the timeline was rewritten again.
The data from A-shares is more direct: tech stocks that doubled in the previous year fall by an average of 40% the next year. Only 5% of tech stocks can maintain a growth rate of over 30% for five consecutive years.
The conclusion is that tech stocks earn money from swings; passive holding won't achieve this.
N-Shaped Pattern: Two Market Waves, Four Points
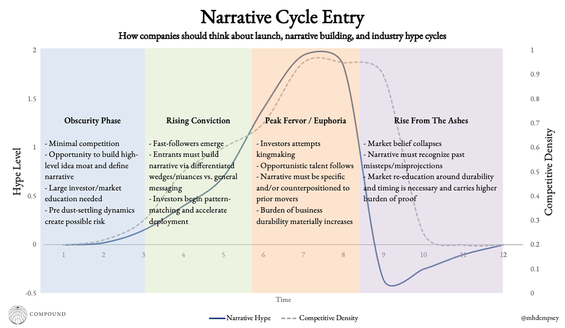
The core framework of this tech stock investment methodology can be compressed into one chart: the N-shaped pattern. Drawing a tech market cycle as an N shape, there are four key positions: A, B, C, D.
A→B is the first wave, from 0 to 1.
This wave earns money from narratives. Companies have no earnings, even products haven't come out yet, but the story is sexy enough. The valuation method is very rough: estimate the entire industry's output value space, allocate market cap ceilings by segment, with a market cap/output value ratio capping at about 3 to 3.5 times.
Directions currently in the A→B stage: Embodied AI, Low-altitude Economy, Commercial Aerospace, AI Applications.
B→C is the correction period.
The first wave is done, the story is told, stock prices fall. Most tech stocks die here, never having a second wave.
C→D is the second wave, from 1 to 100.
This wave earns money from earnings. Companies start showing performance, penetration rates climb rapidly, stock prices go up again, but P/E ratios actually decline because profit growth is faster than stock price growth.
Examples that have already gone through C→D: Optical Modules, PCB, AI Compute Chips, Data Centers.
Point C is the Most Important
Point C is the true decisive move for institutional investors.
Characteristics of Point C: Stock prices have fallen from Point B, market sentiment is poor, the ceiling is unclear, and most people have light positions. But precisely at this position, earnings start to appear, orders start to land, and industrial fundamentals truly explode.
How to judge when Point C has arrived? Three elements, missing one is not acceptable:
Giant Capital Expenditures. Are large companies pouring money into this direction. Capital expenditure's significance to the industry is equivalent to credit's significance to the economy; without funding sources, the industry cannot take off. The rhythm of the AI industry follows this line: 2023 to 2024 overseas cloud vendors started capital expenditures, buying overseas chains (Zhongji Innolight started); second half of 2024 ByteDance started capital expenditures, buying domestic compute (Cambricon started).
Blockbuster Products. Is there a product that breaks through the penetration rate. iPhone 4, AirPods, Model 3, ChatGPT, DeepSeek, every blockbuster marks the starting point of a round of C→D.
Industry Chain Implementation. Have companies received orders? After giant capital expenditures and blockbusters form a closed loop, companies on the industry chain start generating revenue, and the positive cycle kicks in.
The report summarizes in one sentence: As long as the three elements are complete, one should intervene quickly; this is the most critical action for making a super market wave.
How to Judge Point D (When to Sell)?
This part of the report introduces the "M-top" framework, M is two tops, the first top is the trading top (sentiment peaks), the second top is the fundamental top.
Three observation signals for the fundamental top: Whether there is a macroeconomic recession, whether price wars have appeared on the supply side, whether capital expenditures on the demand side have started to be adjusted down. If more than two of the three appear, this round of industrial market trend is basically over.
If leaders fall due to macroeconomic or external factors, directions with industrial trends are instead the best buy points.
For example, in 2010 when the Nasdaq fell, Apple was a buy point; in 2020 when the pandemic caused falls, Tesla was a buy point; the trade war also provided buy points for the AI tech direction. Nvidia's sell points mainly depend on two conditions: first, whether the US economy hard lands, if it hard lands then sell, because the cash flow of the five major cloud vendors is highly tied to consumption, if cash flow sources have problems, the whole logic fails; second, whether the competitive landscape deteriorates, if the landscape deteriorates should also sell.
Regarding US stock mapping, historically it is an important investment methodology. From the 90s to 2000 the Japanese stock market fell 67%, but Tokyo Electron, Advantest, Toshiba, etc. performed well. The quantitative logic of US stock mapping is not highly correlated with performance, but is highly correlated with the gain of corresponding US stock targets. The most effective is industry chain mapping, such as Zhongji Innolight, Luxshare Precision, capable of producing major bull stocks during the process of upward industrial trends and continuous earnings realization.
Join TechFlow official community to stay tuned
Telegram:https://t.me/TechFlowDaily
X (Twitter):https://x.com/TechFlowPost
X (Twitter) EN:https://x.com/BlockFlow_News
 @chaoxiangooo