Three Consecutive Quarters of Decline: 2026 Q2 Total Crypto Market Cap Evaporates 12.6%, Falling to $2.1 Trillion
TechFlow Selected TechFlow Selected
Three Consecutive Quarters of Decline: 2026 Q2 Total Crypto Market Cap Evaporates 12.6%, Falling to $2.1 Trillion
On one side is the sluggishness of mainstream coins, while on the other is the frenzy of speculative hotspots such as prediction markets and tokenized collectibles.
 Navigating Web3 tides with focused insights
Author: CoinGecko
Compiled by: TechFlow
TechFlow Editor's Note: The crypto market in Q2 2026 can be described as an "avalanche." The total market cap evaporated 12.6% in a single quarter, falling to $2.1 trillion, halved from the all-time high last October. June was an even heavier blow—the Fed's hawkish stance, fluctuating US-Iran tensions, and Strategy's symbolic Bitcoin sell-off combined to trigger the deepest drawdown of the year. But the real story lies not in Bitcoin and Ethereum (which continued to underperform US stocks), but in the market's "fragmentation": while major coins languished, speculative hotspots like prediction markets and tokenized collectibles celebrated. This report uses six sets of hard data to dissect this quarter of fire and ice.

I. Total Market Cap Shrinks 12.6% in a Single Quarter, June Sees "Cliff-like" Drop
In Q2 2026, the total crypto market cap fell from $2.4 trillion to $2.1 trillion, a quarter-over-quarter decline of 12.6%. Unlike Q1's "plunge from the start," Q2 started relatively strong—April was even one of the best-performing months of the year—until momentum suddenly reversed. Alongside falling asset prices, the stablecoin market cap also contracted, the first time since Q3 2023, clearly pointing to capital fleeing the industry.
The sharpest correction of the quarter occurred in June: intensified ETF outflows, a hawkish Fed stance, fluctuating US-Iran tensions, plus a symbolic Bitcoin sale by Strategy, jointly triggered the deepest decline of the year. By the end of Q2, the total market cap was about 52% lower than the peak in October 2025.
Trading activity cooled significantly for the second consecutive quarter, with daily average trading volume dropping to $93.1 billion, a quarter-over-quarter decline of 20.9%.
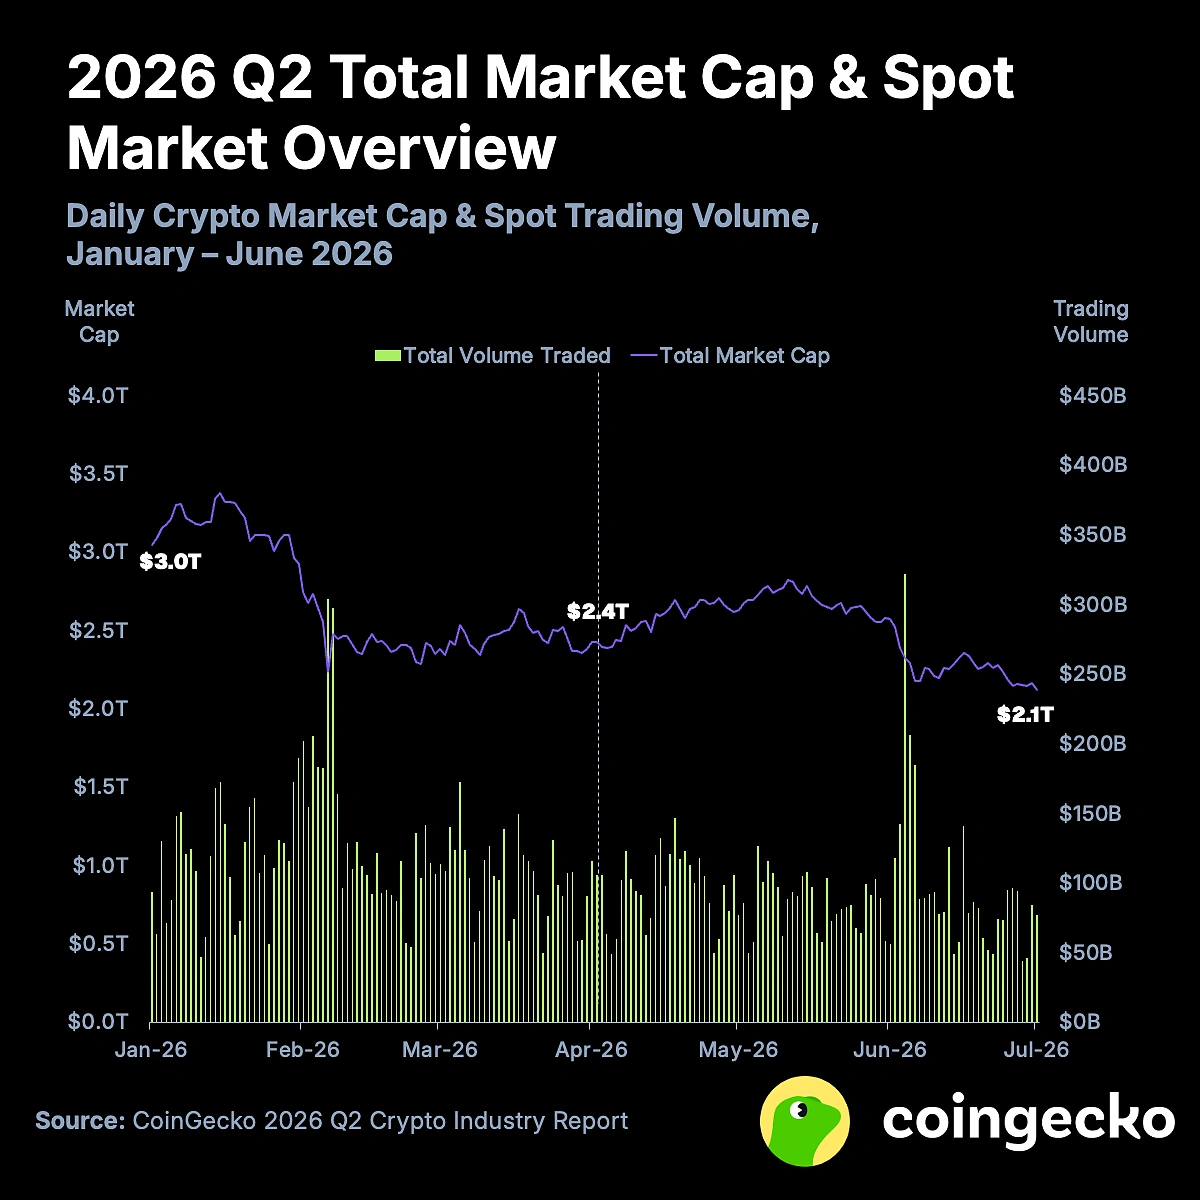
Chart: Total Market Cap Trend in Q2 2026. Source: CoinGecko
II. Stablecoin Market Cap Rarely Drops 1.6%, First Time Since Q3 2023
In Q2 2026, the entire stablecoin sector shrank by $4.8 billion (-1.6%), closing at $305.1 billion, reversing the slight growth trend of Q1—although relative to the overall market drawdown, this decline was not significant.
Circle's USDC (-4.8%, i.e., -$3.7 billion) recorded the absolute largest net outflow in the sector, falling to $73.5 billion. In contrast, Tether's USDT (+0.2%, i.e., +$300 million) remained basically stable, staying at $184.4 billion, recovering from Q1 outflows, and increasing its market share to 60%.
Sky's USDS (-16.4%, i.e., -$2 billion) sharply reversed last quarter's momentum, falling to $10 billion; Ethena's USDe (-24.4%, i.e., -$1.4 billion) contracted again after briefly stabilizing in Q1, reporting $4.4 billion at quarter-end. The main reason for the decline was yields being compressed below risk-free rates, prompting stakers of sUSDS and sUSDe to unstake.
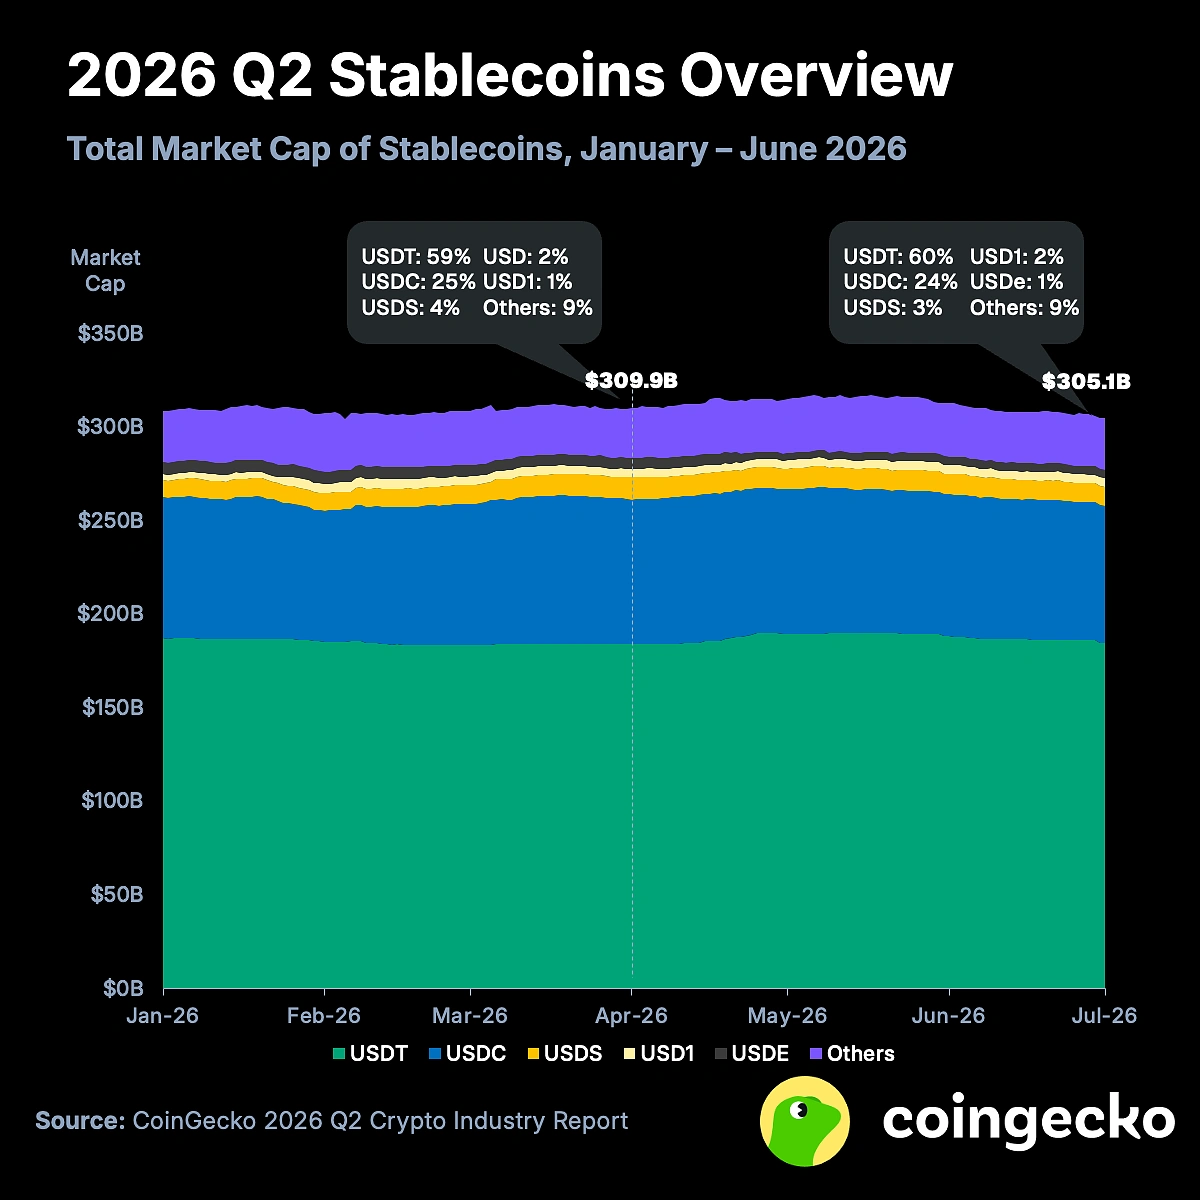
Chart: Stablecoin Market Cap Overview. Source: CoinGecko
WLFI's USD1 (+5.5%, i.e., +$200 million) continued to grow, but the pace slowed significantly compared to Q1's explosion; the "Others" category (+6.2%, i.e., +$1.7 billion) rebounded slightly.
III. Prediction Market Notional Volume Surges 48.7% QoQ, June Hits All-Time High
In Q2 2026, the notional volume of prediction markets reached $113.8 billion, a quarter-over-quarter growth of 48.7%. June's single-month notional volume was $52.8 billion, 91.9% higher than the average of the previous five months ($27.5 billion), setting a new all-time high. This was mainly due to intensive sports events since late May (Champions League Final, Stanley Cup, NBA Finals, World Cup, Wimbledon, etc.).
Growth was most evident on Polymarket: sports contracts now dominate trading volume (81% in June, only 40% in January). In terms of market share, Kalshi expanded from 42.4% in Q1 to 58.9% in Q2, further pulling ahead; Polymarket slipped from 35.8% to 30.2% QoQ.
Meanwhile, Rothera, jointly established by Robinhood and Susquehanna International Group (SIG) in May, quickly climbed to fourth place in June, with notional volume reaching $2.1 billion.
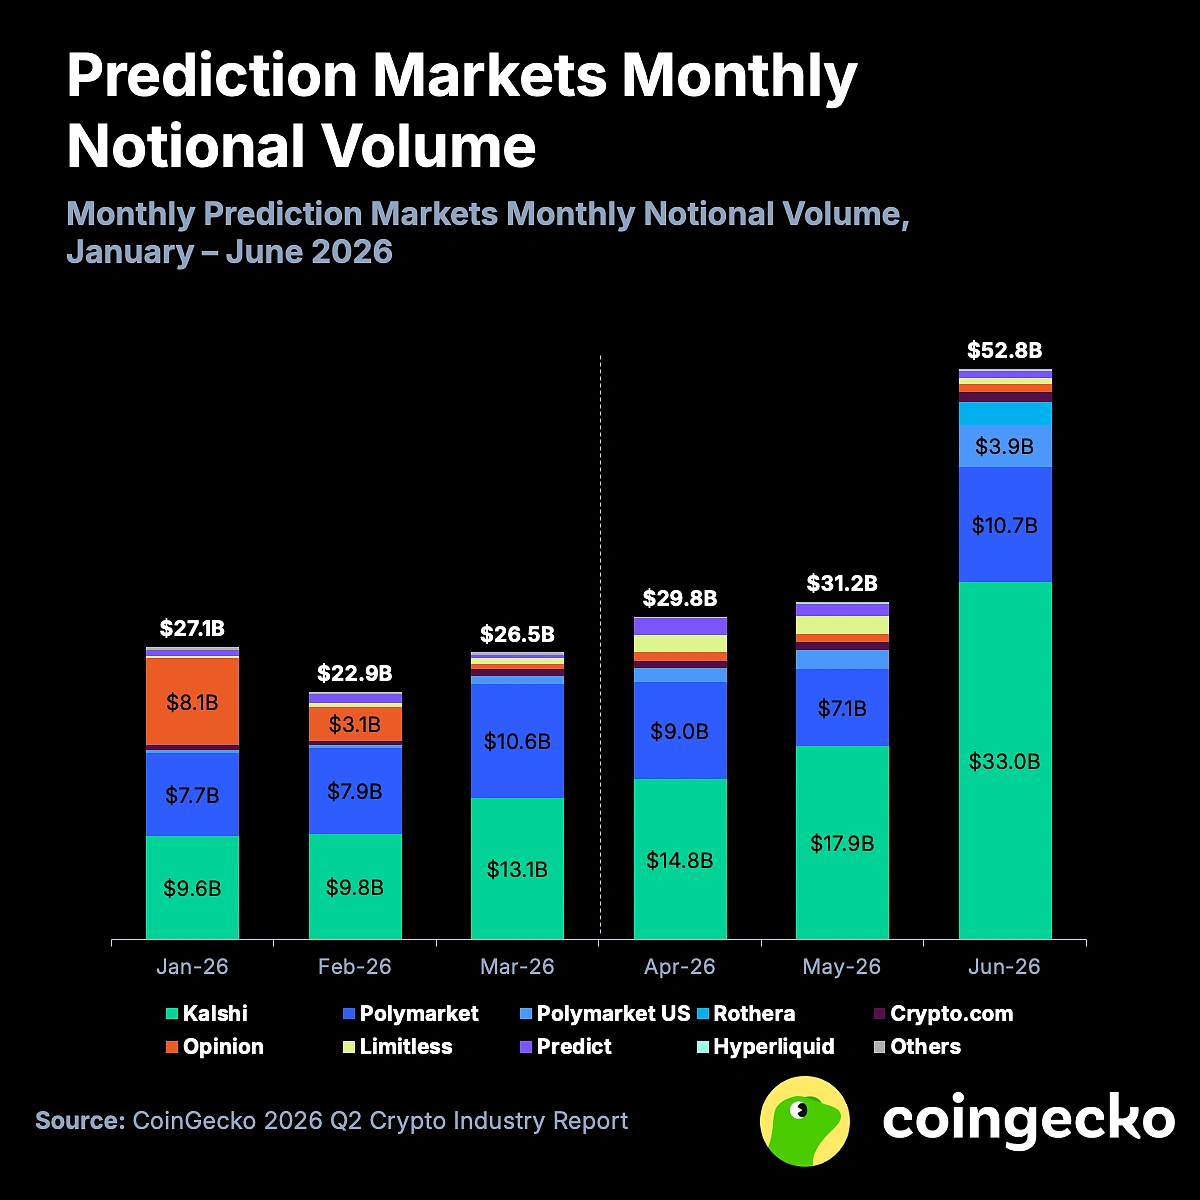
Chart: Prediction Market Notional Volume in Q2 2026. Source: CoinGecko
IV. Collector Crypt Monopolizes Tokenized Collectibles, June Market Share Hits 62.8%
In the first half of 2025, the tokenized TCG (Trading Card Game) sector was basically monopolized by Courtyard; but entering 2026, Collector Crypt has overtaken it to become the top platform—monthly trading volume surged from $97 million in January 2026 to $406 million in June, an increase of up to 317.0%. In June, Collector Crypt led the industry with a volume share of 62.8%.
For comparison, OpenSea's NFT sales volume in June 2026 was only $32.7 million, making Collector Crypt, Courtyard, and Phygitals the largest NFT trading markets by volume.
However, most of the trading volume on these platforms does not come from secondary resales, but from "gacha" mechanisms. On average, over 98% of a platform's trading volume is generated by this function—users purchase random NFTs of different tiers, each with a chance to draw rare cards.
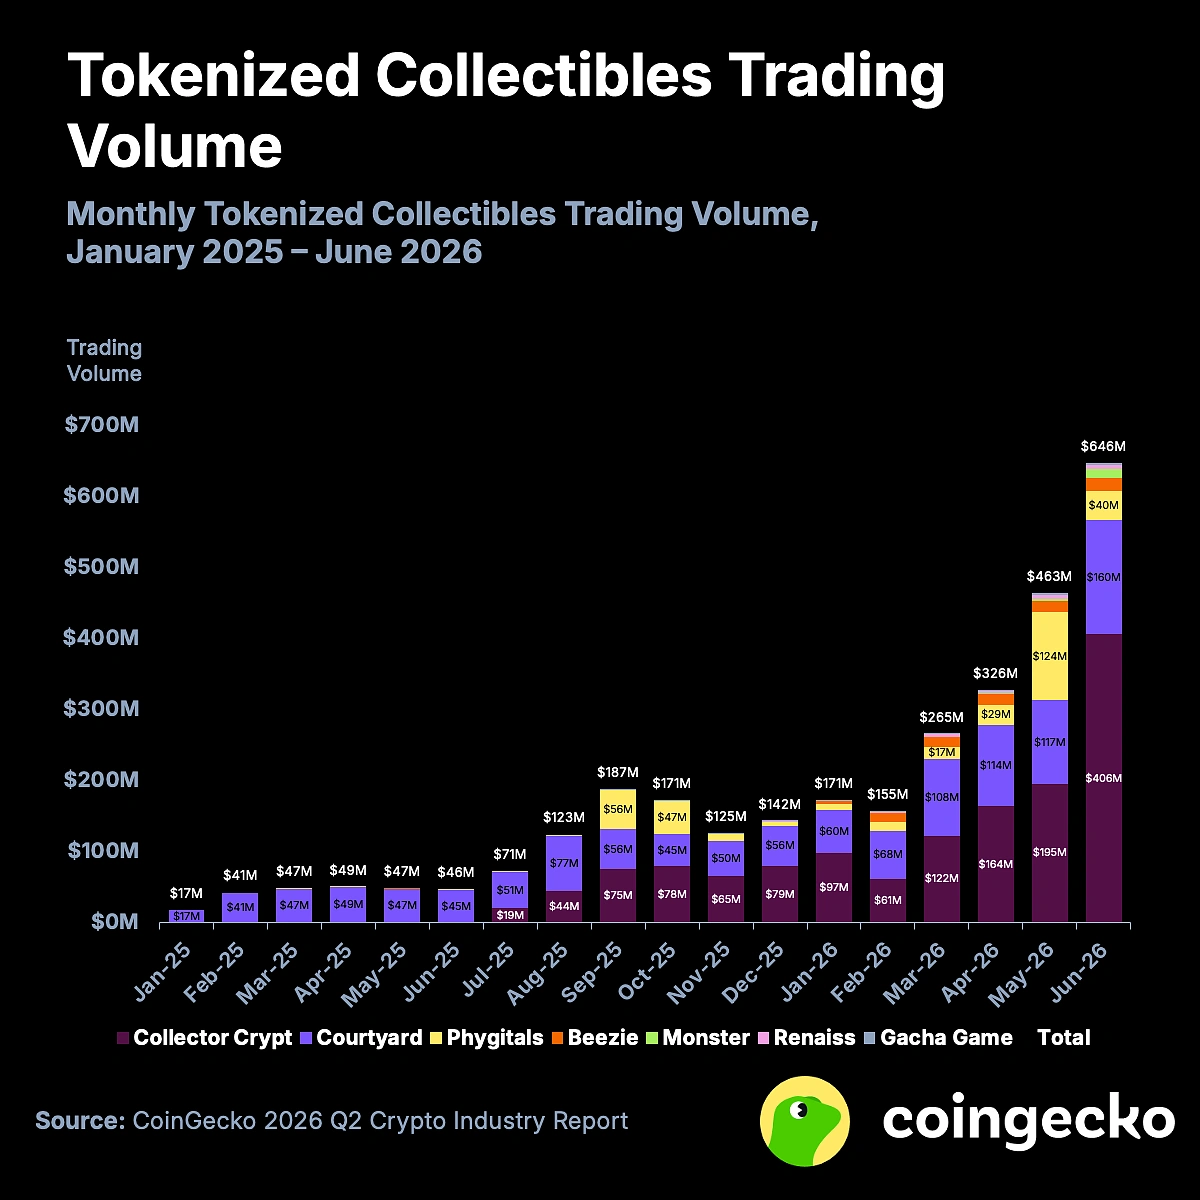
Chart: Tokenized Collectibles Trading Volume. Source: CoinGecko
V. Centralized Exchange Spot Trading Volume Drops 27.9%, May Hits Monthly Low
In Q2 2026, the Top 10 Spot Centralized Exchanges (Spot CEX) recorded $1.95 trillion in trading volume, a 27.9% decrease from Q1's $2.70 trillion.
Trading volume fell to a monthly low of $619 billion in May, recovering slightly to $695 billion in June.
Despite being in a bear market, Binance still expanded its dominance, reaching a market share of 38.7% in Q2. The other exchange with a double-digit market share is Bybit (10.0%), which squeezed out MEXC's position.
Declines were widespread but uneven, ranging between -5% and -56%. MEXC slid the most, with trading volume more than halved compared to Q1, shrinking from $275.2 billion to $121.2 billion, ranking falling from second to seventh; Crypto.com and KuCoin also fell sharply, down 40.9% and 38.5% respectively.
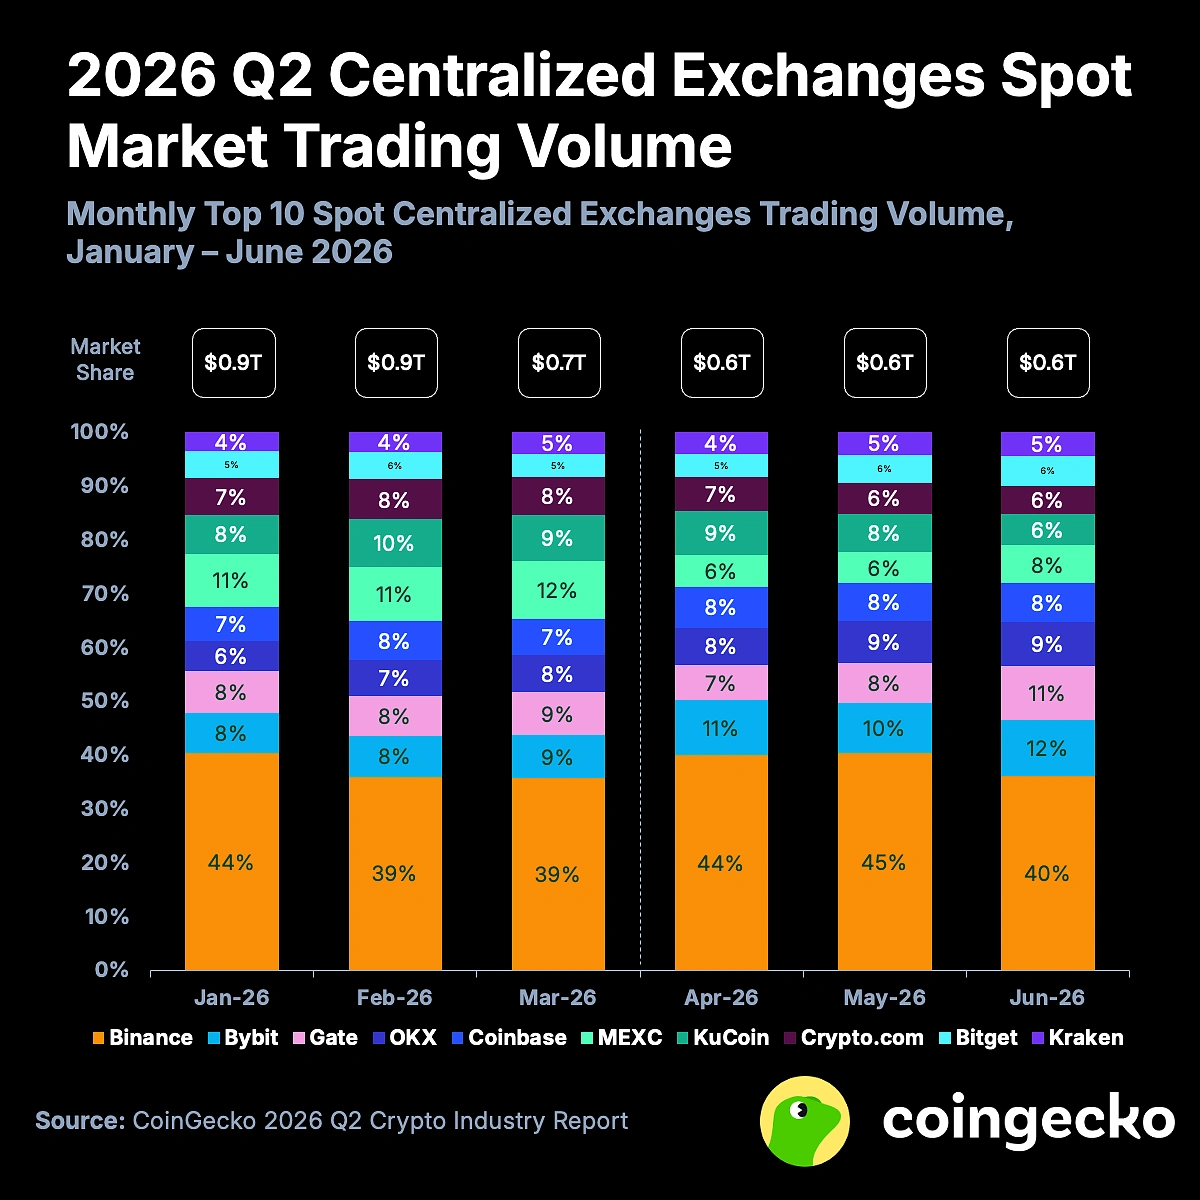
Chart: Centralized Exchange Spot Trading Volume. Source: CoinGecko
VI. Centralized Exchange Perpetual Contract Trading Volume Drops 10.0%, More Resilient Than Spot
In Q2 2026, the Top 10 Perpetual Centralized Exchanges (Perp CEX) recorded $12.7 trillion in trading volume, a 10.0% decrease from Q1's $14.1 trillion. Despite the overall decline, monthly trading volume remained steadily above $4.0 trillion, higher than the average of the first three quarters of 2024.
The QoQ decline in perpetual contracts (-10.0%) was significantly smaller than spot (-27.9%), reflecting traders' preference for perpetual contract speculation, while the growth of RWA perpetual contracts also helped maintain attention.
Trading volume also signaled broader market weakness: when prices rebounded in May, volume fell to a yearly low; but when BTC fell below $60,000, May trading volume actually rebounded.
The relative market share among the Top 10 perpetual exchanges remained basically unchanged. MEXC saw a brief surge in April and early May, but its gains faded in June.
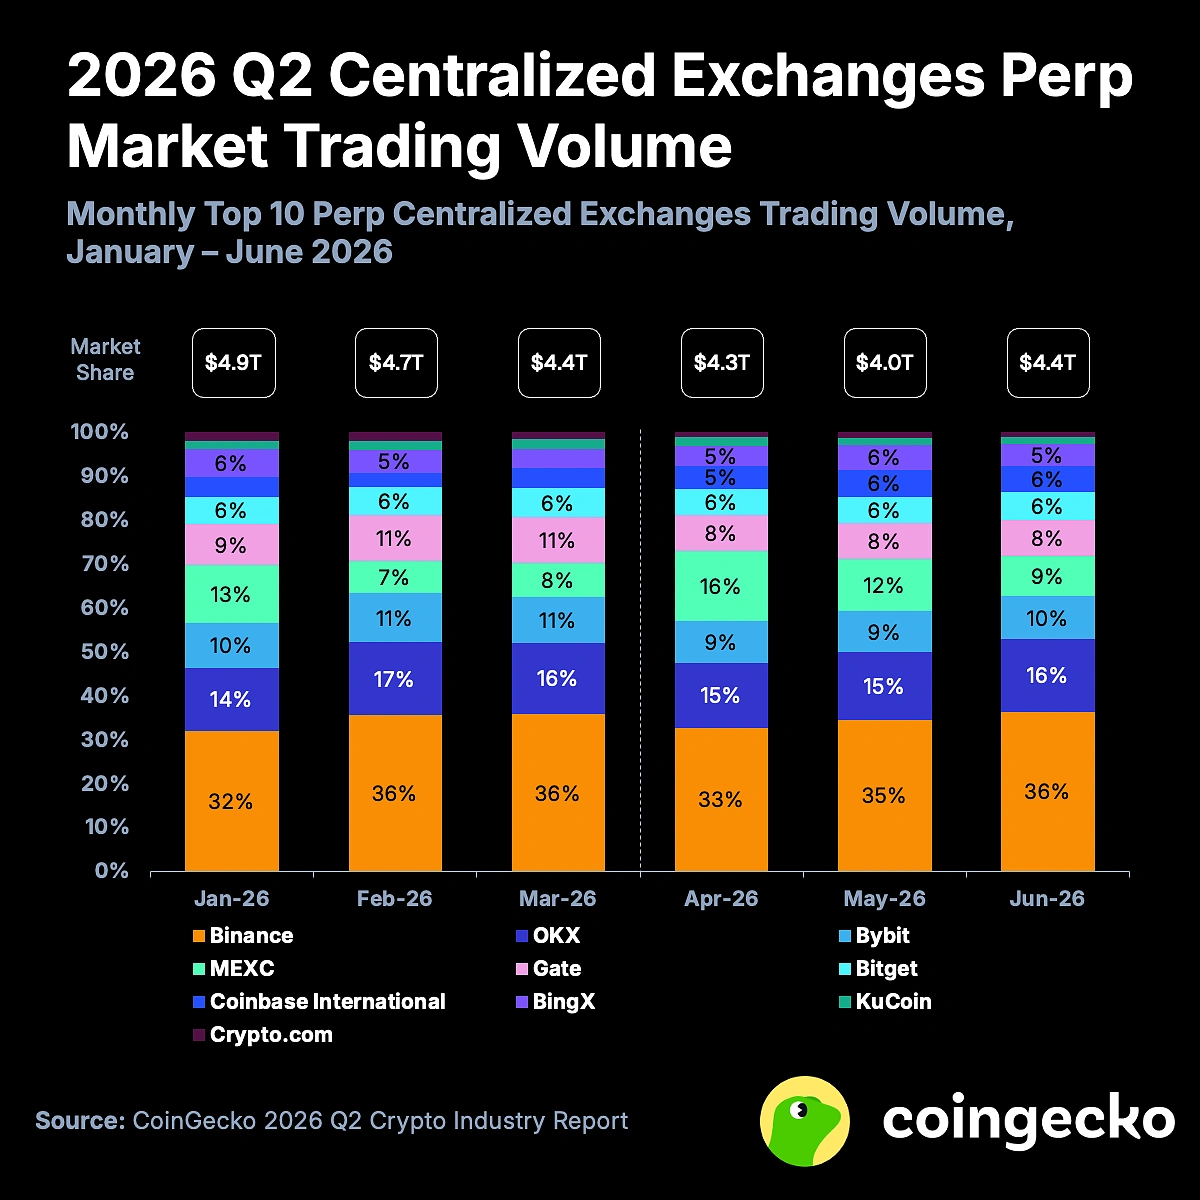
Chart: Centralized Exchange Perpetual Contract Trading Volume. Source: CoinGecko
Conclusion: A Fragmented Quarter, A Divergent Future
The crypto market in Q2 2026 was written with the word "divergence." The total market cap fell below previous lows for the first time in a year and a half, and stablecoins also rarely bled, suggesting the industry is entering a growing pain period of capital withdrawal; but just as the mainstream narrative was bleak, prediction markets exploded thanks to sports events, Collector Crypt turned tokenized collectibles into a monopolistic business with gacha mechanisms, and Hyperliquid's HYPE even broke into the top 10 market cap via ETFs, prediction markets, and a landmark cooperation with Coinbase.
When Bitcoin and Ethereum are no longer the best story, capital attention is being redistributed—this may not be the end of the bull or bear market, but a prelude to the crypto market structure being quietly rewritten.
Join TechFlow official community to stay tuned
Telegram:https://t.me/TechFlowDaily
X (Twitter):https://x.com/TechFlowPost
X (Twitter) EN:https://x.com/BlockFlow_News
 CoinGecko