The Super IPO Wave Has Arrived—Will It Drain and Crash the U.S. Stock Market?
TechFlow Selected TechFlow Selected
The Super IPO Wave Has Arrived—Will It Drain and Crash the U.S. Stock Market?
SpaceX, OpenAI, and Anthropic’s “mega IPOs” are flooding the U.S. stock market.
 Navigating Web3 tides with focused insights
By: Ying Zhao
Source: WallStreetCN
U.S. equity financing has rebounded steadily from its 2023 lows—and could accelerate markedly over the coming months: a wave of mega IPOs is lining up, with individual offerings potentially reaching tens of billions of dollars. The most immediate market concern is that these new listings will “drain capital” from existing U.S. equities—especially at a time when index-driven allocations and large-cap positions are already elevated.
A cluster of “super IPOs”—by SpaceX, OpenAI, and Anthropic—is poised to hit U.S. markets. SpaceX’s S-1 registration statement was officially filed last week, with its listing expected in the second week of June—making it the first of the three to complete its public offering. OpenAI aims to go public as early as September this year—significantly ahead of prior market expectations—while Anthropic may seek a listing as soon as October.
According to Foresight Trading Desk, Deutsche Bank Securities strategist Parag Thatte wrote in a report dated May 22: “Within our demand–supply framework, the rebound in issuance itself may indeed exert modestly negative pressure on equities—but the impact is mild. Past academic literature and empirical evidence from prior issuance waves clearly show that such waves typically coincide with strong equity returns, because they occur during periods of robust equity demand.”
The core conclusion of this research is not that “issuance is harmless,” but rather that “issuance is not the primary driver.” Increased supply introduces short-term volatility: modeling the largest IPO alone suggests it could weigh on the market by roughly 1%; if listings are highly concentrated and crowd out other stocks within index benchmarks, the impact could be greater. Yet even then, it functions more as a trigger for a typical market pullback—not a sufficient condition for ending a bull market. On average, the U.S. equity market experiences a >3% pullback every one to two months, with many possible catalysts—of which IPOs are just one.
What truly underpins this view is that demand remains intact. Households still hold high cash balances; corporate earnings growth remains strong; equity fund inflows continue; and share buyback announcements remain elevated. The issue is not whether “there’s enough money to buy new issues,” but whether demand can continue to outpace supply. Another critical constraint is that large-cap—and especially large-cap tech—positions are already relatively elevated, making that segment far more sensitive.
This issuance wave looks big—but is unremarkable in context of the entire U.S. equity market
U.S. quarterly equity issuance has risen from a low of ~$30 billion in early 2023 to ~$120 billion today. Over the next few months, a wave of mega IPOs could push that figure even higher.
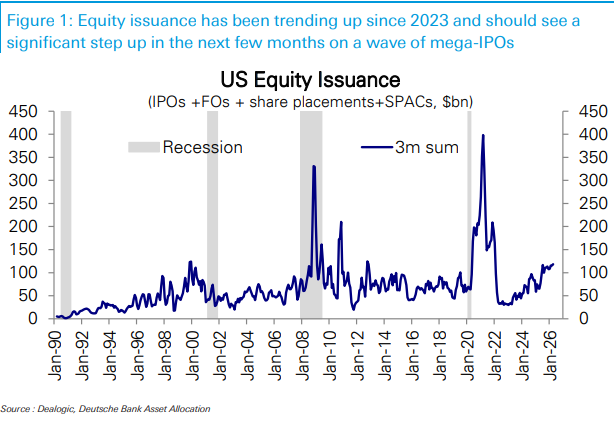
Looking solely at IPOs, some upcoming mega-deals could raise as much capital as the total U.S. IPO proceeds over the past nine months combined. Expanding the scope to include all U.S. equity issuance—including follow-on offerings—this volume equals roughly two months’ worth of issuance.
But viewed through a different lens, the pressure appears far less acute. Even the largest anticipated IPO would raise only slightly more than 0.1% of the current S&P 500’s total market capitalization. This is why “increased supply” alone does not justify concluding that “U.S. equities must fall”: while the absolute dollar amount appears eye-catching, it is not extreme relative to overall market size.
Historically, issuance waves have been companions—not causes—of bull markets
Over the past three decades, U.S. equities have experienced several equity issuance upcycles. Historically, equity markets have performed strongly during these periods: the median S&P 500 return in the first three months after an issuance wave begins is ~8%; over 12 months, returns exceed 20%.
Exceptions are clear-cut: during the 2008–2009 global financial crisis, forced financing by financial institutions and others drove issuance higher amid massive sell-offs. Such “capital replenishment under duress” differs fundamentally from normal-market issuances, where companies seize favorable valuation and demand windows to raise capital.
Academic literature also supports this causal direction: stronger equity markets and higher expected profitability tend to appear first—and then drive issuance waves; issuance itself exerts only limited negative feedback on contemporaneous markets. What’s trickier is the latter phase: equity returns eventually weaken after issuance waves—but “eventually” can take a long time, making it unreliable as a short-term sell signal.
Model-estimated impact: ~1%, but concentration amplifies perceived pressure
The demand–supply framework aggregates multiple forces: investor positioning shifts, equity fund flows, buybacks, and issuance. Issuance represents increased supply—and thus, ceteris paribus, a negative factor.
Estimates suggest the largest IPO alone could depress the market by ~1%. If listings are highly concentrated in timing—or if newly listed stocks enter index benchmarks and displace other constituents—the actual pressure could be somewhat larger.
But it’s vital to distinguish between “downside risk” and “systemic selling pressure.” Pullbacks exceeding 3% occur in U.S. equities roughly once every one to two months. An IPO wave may catalyze one such pullback—but it won’t necessarily alter the broader market trend. Unless demand simultaneously weakens, supply pressure alone is unlikely to overwhelm the index.
Demand remains resilient: cash, earnings, and buybacks are holding up
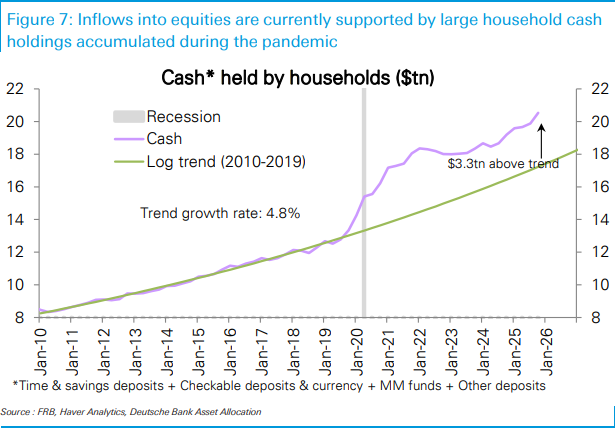
Households remain a key buffer. Pandemic-era accumulated cash balances remain elevated: household cash holdings stand ~$3.3 trillion above their 2010–2019 trend level. As a share of personal income, cash holdings also remain high—giving households capacity to allocate a larger portion of new savings to financial assets, including equities.
Earnings provide another pillar of support. Since 2003, the correlation between equity fund flows and S&P 500 earnings growth has averaged ~54%. First-quarter earnings growth has been described as among the strongest in over two decades—helping explain why capital continues flowing into equities.
Buybacks are also a critical component of demand. S&P 500 buyback announcements remain robust—meaning corporations themselves continue providing bid-side liquidity. While rising issuance adds supply, buybacks and fund inflows absorb it; the current balance has not yet tilted decisively toward supply.
Positioning isn’t broadly overheated—crowding is concentrated in large-cap tech
Overall equity positioning is only modestly overweight, sitting at the 53rd percentile since 2010. Active managers’ positioning is lower—at the 47th percentile, near neutral—while systematic strategies sit higher, at the 64th percentile.
True crowding lies in large caps—especially large-cap tech. Large-cap positioning stands at the 85th percentile; large-cap tech reaches the 93rd percentile. This means that if an IPO wave triggers portfolio rebalancing, the segment most likely to draw market attention isn’t “equities broadly,” but rather those already heavily held.
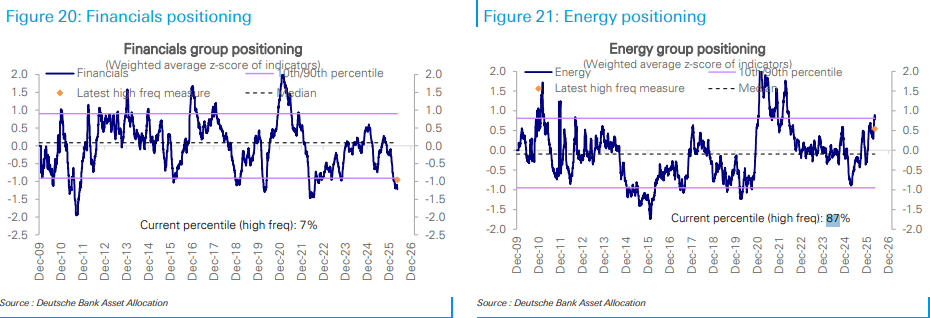
Sector positioning is also uneven. Energy is overweight (87th percentile); large-cap growth and tech are modestly overweight overall. Financials are significantly underweight (7th percentile); materials are even more extreme (0th percentile). The U.S. equity market is not uniformly positioned—and supply shocks will therefore land unevenly across sectors.
Flows aren’t universally positive—strength is concentrated in U.S. and tech
In the most recent week, equity fund inflows slowed sharply to $2.4 billion. U.S. equity funds still attracted $9.5 billion, and broad global funds drew $10.3 billion—but non-U.S. regions saw sizable outflows.
Japanese equity funds saw $4.4 billion in outflows—the largest in five weeks; European funds posted $2.3 billion in outflows—for six consecutive weeks; emerging markets saw $7.9 billion in outflows—also for six straight weeks. Within EMs, China-related funds recorded $9.7 billion in outflows, while Korea and Taiwan posted inflows of $3.0 billion and $1.7 billion, respectively.
Sector flows are even more concentrated. Tech funds attracted $9.0 billion—the highest in seven months. Meanwhile, bond funds drew $30.5 billion—reaching a five-month high. Capital is not flooding into risk assets uniformly; instead, it’s diverging across U.S. equities, tech, and bonds.
This divergence is what matters most amid the IPO wave: not the number of new listings per se, but whether demand continues concentrating in a narrow set of strong-performing assets. So long as earnings, buybacks, and U.S. equity inflows hold up, the IPO wave remains little more than short-term noise. But if tech crowding unwinds and equity inflows cool, supply pressure could escalate—from a ~1% model perturbation into a far harder-to-digest challenge.
Join TechFlow official community to stay tuned
Telegram:https://t.me/TechFlowDaily
X (Twitter):https://x.com/TechFlowPost
X (Twitter) EN:https://x.com/BlockFlow_News