
Deconstructing the Manipulation Tactics Behind $RAVE and $SIREN—From Chip Control to Contract-Based Bear Traps: The Full Market Manipulation Chain
TechFlow Selected TechFlow Selected
Deconstructing the Manipulation Tactics Behind $RAVE and $SIREN—From Chip Control to Contract-Based Bear Traps: The Full Market Manipulation Chain
Mechanism Breakdown: Helping You Understand Why You Keep Getting Liquidated on These Tokens
Author: au_call
Compiled by: TechFlow
TechFlow Intro: Recently, “crime coins” such as RAVE and SIREN have repeatedly emerged, with single-cycle manipulators routinely pocketing over $30 million. This article dissects the entire operational chain from the manipulator’s perspective: how projects source manipulators, how tokens are controlled, how spot and derivatives markets coordinate to liquidate traders, and the mechanics behind open interest (OI) and funding rates. This is the first piece in au_call’s Telegram channel series (@au_call), focused on mechanism breakdown—helping you understand why you keep getting liquidated on these tokens.
This article explains how crime coins are manufactured, how they are manipulated across spot and derivatives markets, how to identify and trade them, and the hidden mechanics and common traps behind open interest (OI) and funding rates. Due to space constraints, many details are simplified here. Further deep dives will follow if engagement is strong.
How Crime Coins Are Manufactured
In recent cases—including MYX, COAI, AIA, and SIREN—manipulators routinely earned over $30 million per cycle, depending on market conditions. The typical revenue split allocates over 70% to the manipulator and roughly 30% to the project team; in some cases, the manipulator’s share is even higher. Consequently, profit-driven project teams proactively seek experienced crime coin manipulators, while manipulators also actively scout for projects where token concentration has already advanced significantly.
Crime coins are not driven by fundamentals. Initial pricing hinges on two factors: degree of token control and “shell value.”
Shell value operates similarly to shell-company listings in China’s A-share market—and listing on Binance requires such a shell. Once the project team and manipulator agree on profit-sharing terms and financing conditions, operations commence.
The “manipulators” discussed here are “active market makers,” not traditional passive ones. Active market makers align interests tightly with the project team via arrangements including token lending revenue sharing, capital support, and API-level execution. They wield substantial control—sometimes even independently managing trades without the project team’s knowledge. When a project team seeks price appreciation but lacks sufficient capital—or faces heavy short pressure—it often brings in external capital via the manipulator. The core objective is price guidance, manipulation, and profit sharing.
Funding sources fall into three categories: proprietary capital, project tokens, and external financing. Typical tactics include aggressive long/short pushes, one-sided liquidity provision, and coordinated spot-derivatives trading. Profits derive from trading spreads and liquidations.
Step One of Manipulation: Controlling Token Supply
Prior to launch, the project team typically accumulates over 90% of circulating supply on-chain. These tokens are held in multi-signature wallets and entrusted to the manipulator for execution. On-chain holdings form the foundation—but are neither decisive nor directly revealing of actual distribution.
How do you identify a potential crime coin? Watch for three signals.
1. Multiple related addresses collectively hold over 90% of supply, many via multi-sig wallets.
2. On-chain evidence of bot-driven market making, identifiable via volume patterns and candlestick formations.
3. Large transfers from exchange cold wallets to on-chain addresses—a frequent precursor to manipulation.
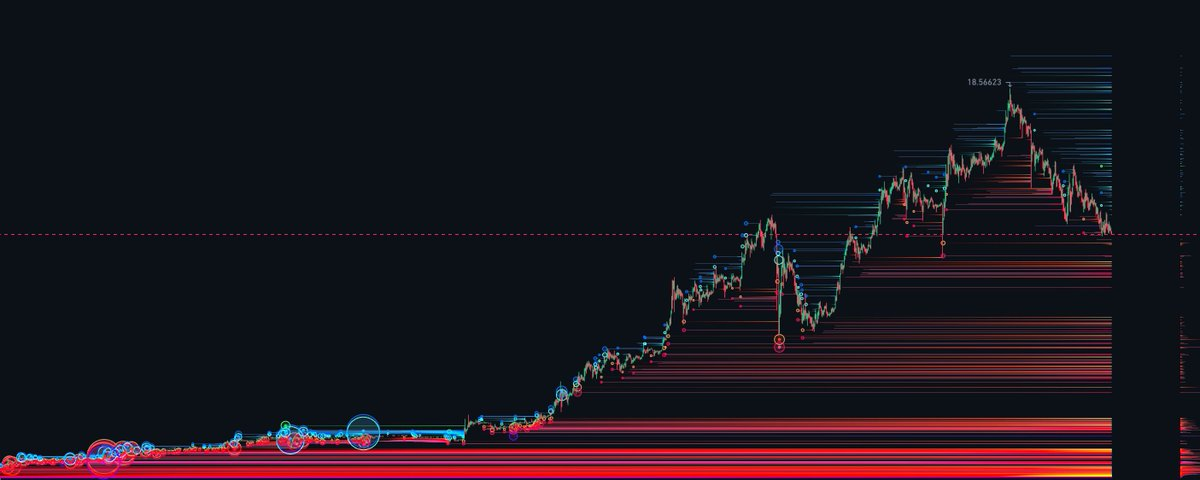
Another critical factor is the distribution between exchange cold and hot wallets. Identifying which exchange holds the largest share across both cold and hot wallets reveals where spot control is concentrated. In some cases, hot wallet balances remain extremely low—meaning minimal capital suffices to lift spot prices and thereby influence derivatives pricing.
Crime coin spot manipulation predominantly occurs on Bitget, Gate, and Aster—exchanges with comparatively weaker risk controls and thinner order books. Attempting similar manipulation on Binance may trigger position limits or withdrawal restrictions.
From an on-chain perspective, monitor inflows/outflows between exchange cold and hot wallets most closely. Cold wallet outflows frequently signal imminent manipulation. However, depositing tokens into exchanges does not necessarily indicate distribution—often it merely entices traders to open short positions.
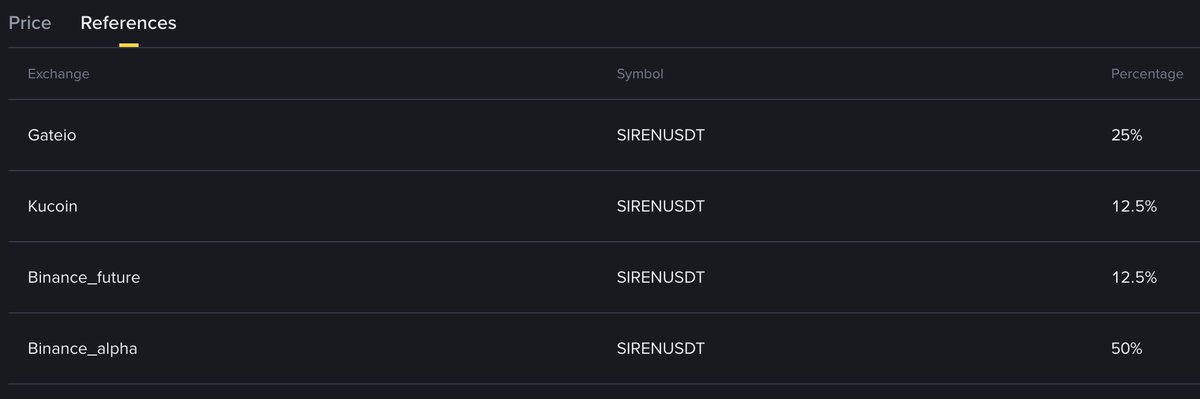
Derivatives Deep Dive: Mark Price and the OI Trap
First, a foundational concept: liquidation prices for perpetual contracts are calculated using mark price—an index derived from weighted average prices across multiple exchanges. To prevent manipulation, exchanges use weighted averages. If exchanges like Bitget and Gate carry high weight in that index, the entire index becomes easier to influence. At times, manipulators induce certain exchanges to suspend deposits/withdrawals—effectively “isolating” that market—and then use its isolated price to move Binance’s contract quotes.
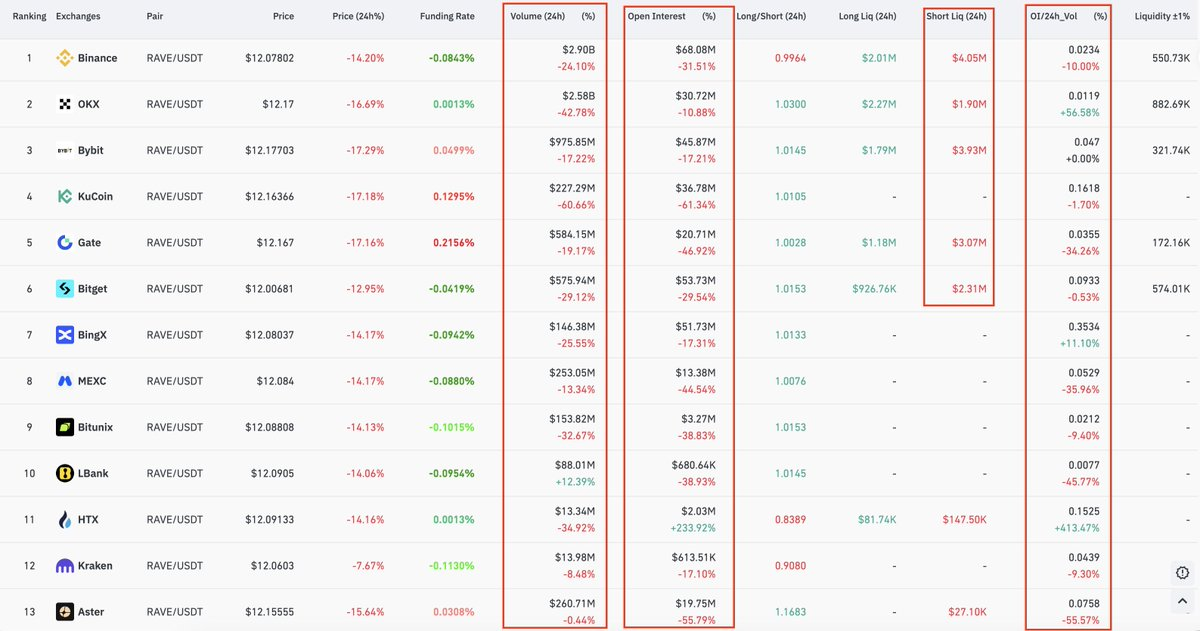
Next, open interest (OI). Generally, the higher the ratio of OI to market cap, the more likely the asset is a crime coin. Here, OI refers to one-sided open interest. Manipulators can artificially inflate OI via hedging. High reported OI attracts retail traders—but how do you distinguish genuine OI from hedged (i.e., artificial) OI?
Check the long/short ratio. If OI changes significantly while the long/short ratio remains nearly flat, it strongly suggests manipulator-driven bilateral hedging. In such cases, declining OI cannot be naively interpreted as an imminent dump signal.
OI Determines the Crime Coin Lifecycle
Phase One: Rising OI + Rising Price
Longs push price upward easily, encountering minimal resistance. The goal is to lure shorts into the market. If insufficient shorts enter, manipulators may simply crash spot prices to liquidate longs.
Phase Two: Four Combinations
Long entry → rising OI + rising price.
Short entry → rising OI + falling price.
Short liquidation → falling OI + rising price.
Long liquidation → falling OI + falling price.
OI shifts reflect multiple drivers—including manipulator hedging. OI only gains meaning when analyzed alongside price direction.
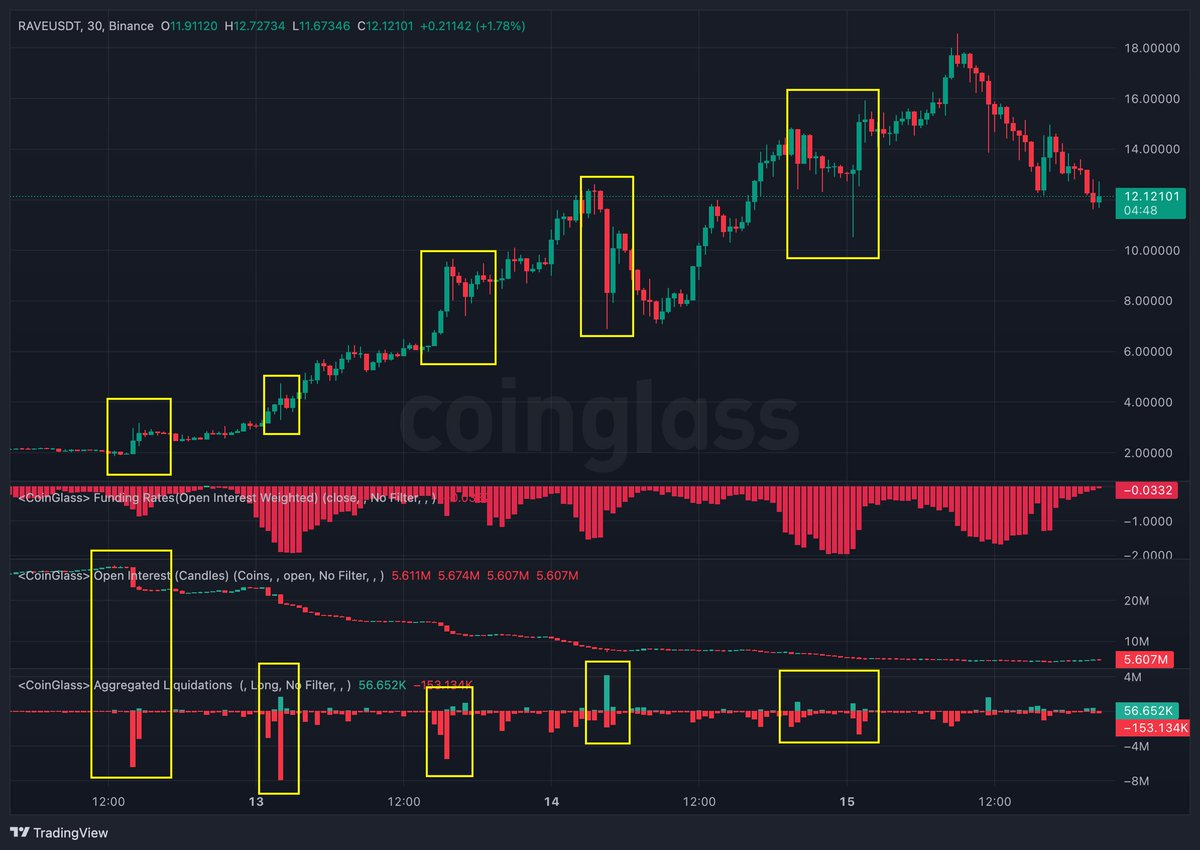
Phase Three: Short-Squeeze Induction During Uptrend
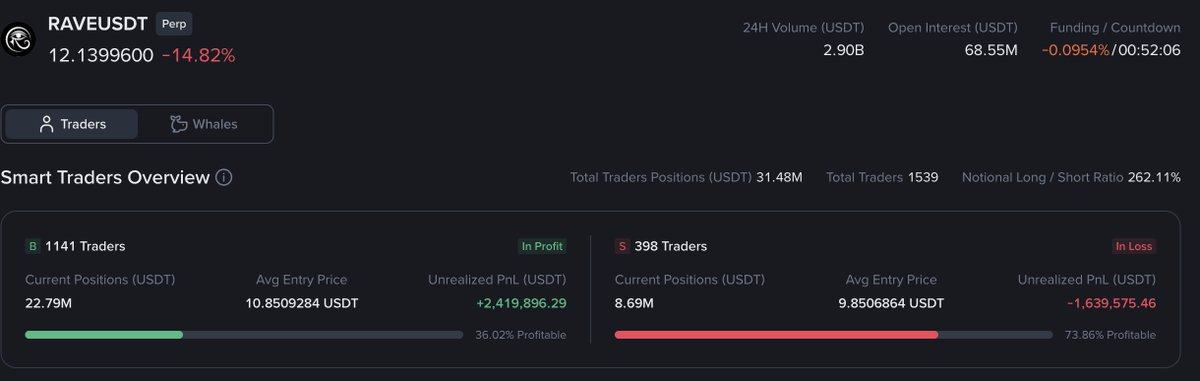
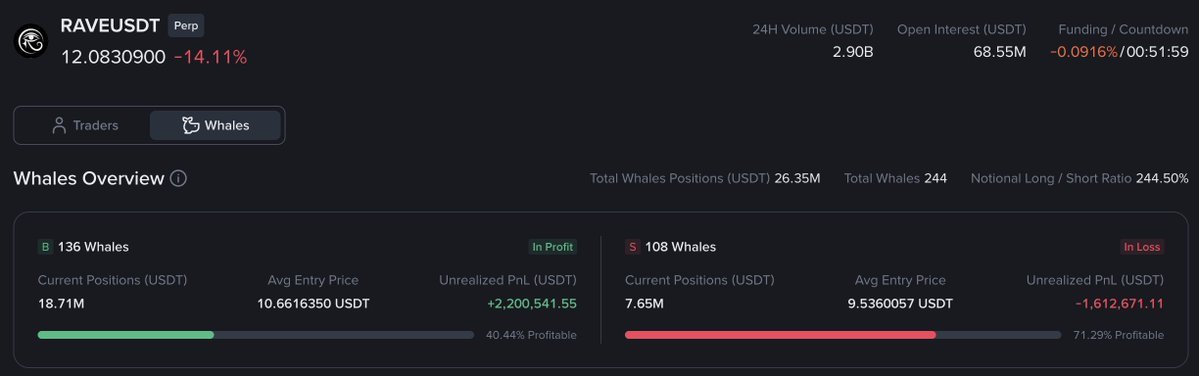
Manipulators combine news, price action, and OI data to bait shorts. Take RAVE as an example: at key levels, manipulators close their own short positions or unwind hedges—creating a false impression of OI decline + price drop + surging volume, suggesting trend exhaustion. Once shorts enter, price reverses sharply upward—trapping them.
Phase Four: Reversal to Shorts + Token Distribution
At this stage, manipulators initiate short positions, close longs, and distribute spot tokens. Key indicators include funding rates approaching −2%, sharp OI decline, and large token deposits into exchanges. Monitor OI across multiple exchanges—especially Aster, whose relatively weak risk controls and lack of asset freezing make it a manipulator-preferred venue.
Q&A: How Manipulators Lure Shorts
Common tactics include:
- Distributing tokens to KOLs who hedge (simultaneously distributing tokens).
- Releasing unlock-related bearish news to encourage hedging.
- Launching high-APR staking pools, prompting users to earn yield while hedging.
- Creating arbitrage opportunities via inter-exchange price discrepancies.
- Coordinating with KOL communities to amplify bearish narratives.
- Exchange internal market makers opening massive short positions using near-infinite margin.
Funding Rate Mechanics
If someone holds near-infinite margin, how do manipulators profit?
They pump spot on the exchange carrying the highest weight in the index—pushing funding rates negative. A negative funding rate means shorts pay longs. With four-hour settlement cycles, a −2% rate translates to ~12% daily payout by shorts.
Negative funding arises from three sources: retail shorting, manipulators shorting while distributing tokens, and manipulators pumping spot to force shorts to pay.
Spot Markets and Order Books
When exchange inventory is limited, spot manipulation becomes extremely cheap. During pump phases, manipulators deliberately withdraw liquidity from order books—making price movement easier.
Other Critical Data to Monitor
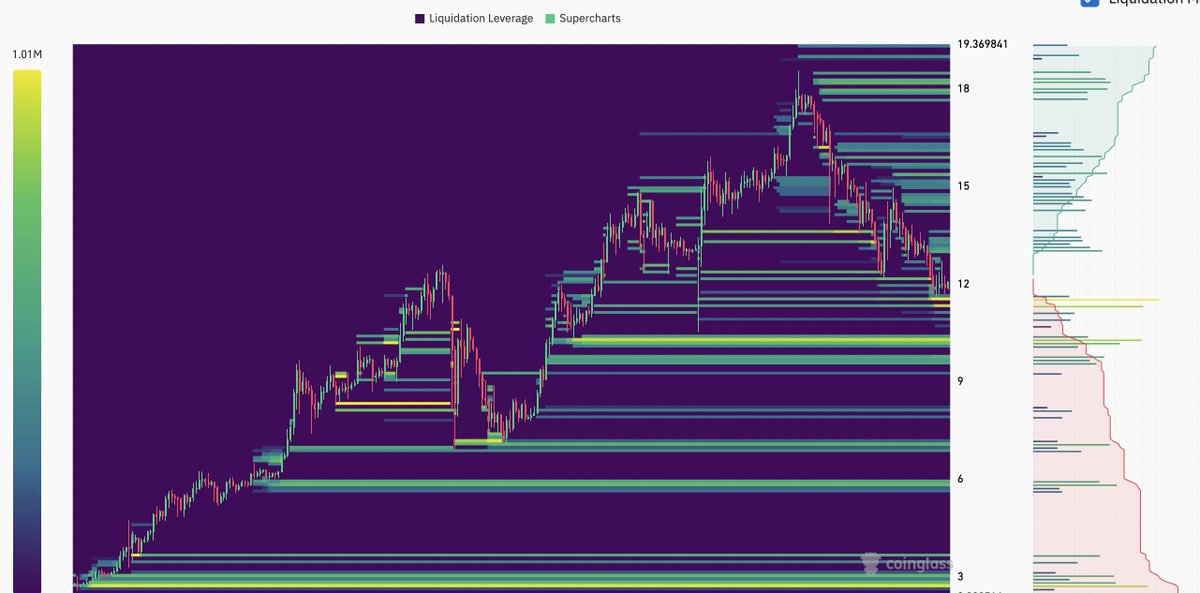
Liquidation heatmaps.
Order book behavior—including spoof orders.
Liquidation data.
Inter-exchange volume, OI, and price discrepancies.
Brief $SIREN Manipulation Analysis
The above outlines only the framework; numerous details were omitted due to length. Further breakdowns will follow.
See the author’s original thread: Original Thread
Join TechFlow official community to stay tuned
Telegram:https://t.me/TechFlowDaily
X (Twitter):https://x.com/TechFlowPost
X (Twitter) EN:https://x.com/BlockFlow_News