Reviewing Bitcoin’s bear market cycles: At what price can you bottom-fish?
TechFlow Selected TechFlow Selected
Reviewing Bitcoin’s bear market cycles: At what price can you bottom-fish?
A bear market is actually the underdog’s chance to turn things around.
 Navigating Web3 tides with focused insights
Author: TechFlow
In the early hours of February 6, as Bitcoin dipped below $60,000, the entire crypto community plunged into panic. From its all-time high of $126,000 in October 2025, Bitcoin has already fallen by 52%.
Yet if you examine Bitcoin’s 15-year price history, you’ll uncover a harsh truth: a 52% drawdown is nothing more than “light drizzle” by historical standards.
The “Drawdown Code” of Bitcoin Bear Markets
Let’s begin with a set of data:
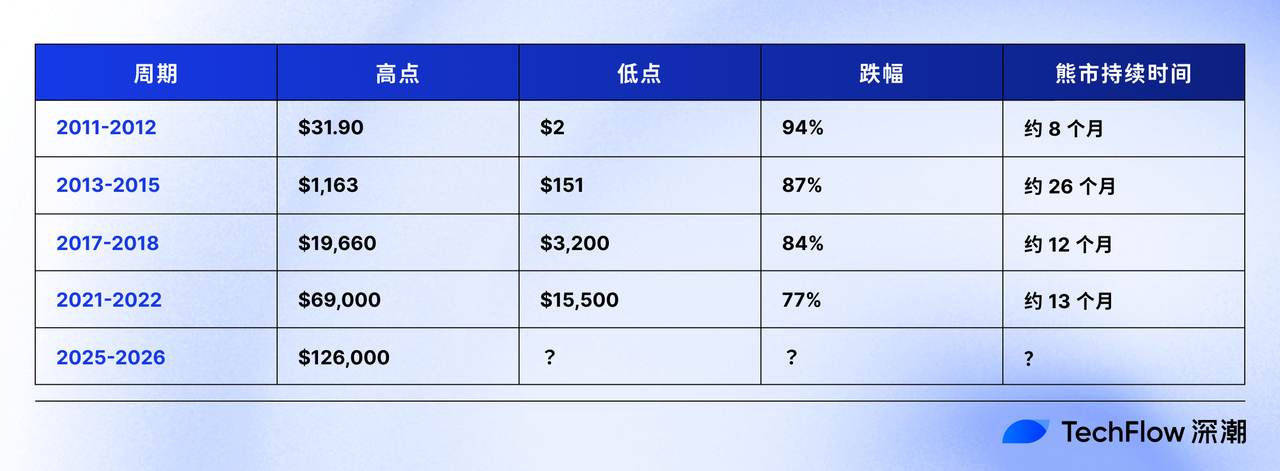
This table reveals a clear pattern: the maximum drawdown in each bear market has been progressively shrinking.
From 94% to 87%, then to 84% and 77%, Bitcoin’s “bear-market benchmark” has narrowed by roughly 5–10 percentage points per cycle.
A more precise look at this declining trend:
- 2011→2013: Down 7 percentage points (94% → 87%)
- 2013→2017: Down 3 percentage points (87% → 84%)
- 2017→2021: Down 7 percentage points (84% → 77%)
Average decline per cycle: ~5–7 percentage points.
Why?
Larger market capitalization naturally dampens volatility.
In 2011, Bitcoin’s market cap was only in the tens of millions of dollars; a single “whale” selling could trigger a 94% crash.
By 2026, even after Bitcoin halved from its peak to $60,000, its market cap still exceeds $1 trillion. To drive such a trillion-dollar asset down another 30–40%, the required selling volume would be thousands of times greater than in 2011.
Institutional entry provides a “liquidity cushion.”
Before 2018, Bitcoin holders were primarily retail investors and early miners. During panics, everyone rushed for the exits simultaneously—there was no “bid-side support.”
Since 2022, institutions like BlackRock, Fidelity, and Grayscale have accumulated hundreds of thousands of BTC through ETFs. These institutions won’t panic-sell on a single sharp drop—their presence effectively functions as a “safety net” in the market.
According to Bloomberg data, as of end-January 2026, total holdings across U.S. spot Bitcoin ETFs exceeded 900,000 BTC—worth over $70 billion. This “locking effect” directly reduces the amount of sell-side supply available in the market.
Bitcoin’s evolution from “speculative asset” to “asset class.”
From 2011–2013, Bitcoin remained a geek’s toy, its price driven entirely by sentiment.
From 2017–2021, Bitcoin began being viewed as “digital gold,” yet still lacked a clear valuation anchor.
After 2025, with Bitcoin ETF approval, the GENIUS Act advancing stablecoin legislation, and Trump proposing a “Strategic Reserve” plan—even if these policies haven’t yet materialized—Bitcoin has transitioned from a “fringe asset” to an integral part of the mainstream financial system.
This evolution directly contributes to reduced volatility.
Diminishing supply shock from halving cycles.
Historically, Bitcoin’s price was primarily driven by its four-year halving cycle, where newly minted supply drops by 50% every four years.
During the first halving in 2012, daily new issuance fell from 7,200 BTC to 3,600 BTC—a massive supply shock.
After the fourth halving in 2024, daily new issuance dropped from 900 BTC to 450 BTC. Though the percentage reduction remains identical, the absolute reduction is now far smaller—and thus its market impact continues to weaken.
The “deflationary effect” on the supply side is waning, while speculative frenzy on the demand side is also cooling—both jointly contribute to narrowing volatility.
If History Repeats, Where Is This Cycle’s “Bottom”?
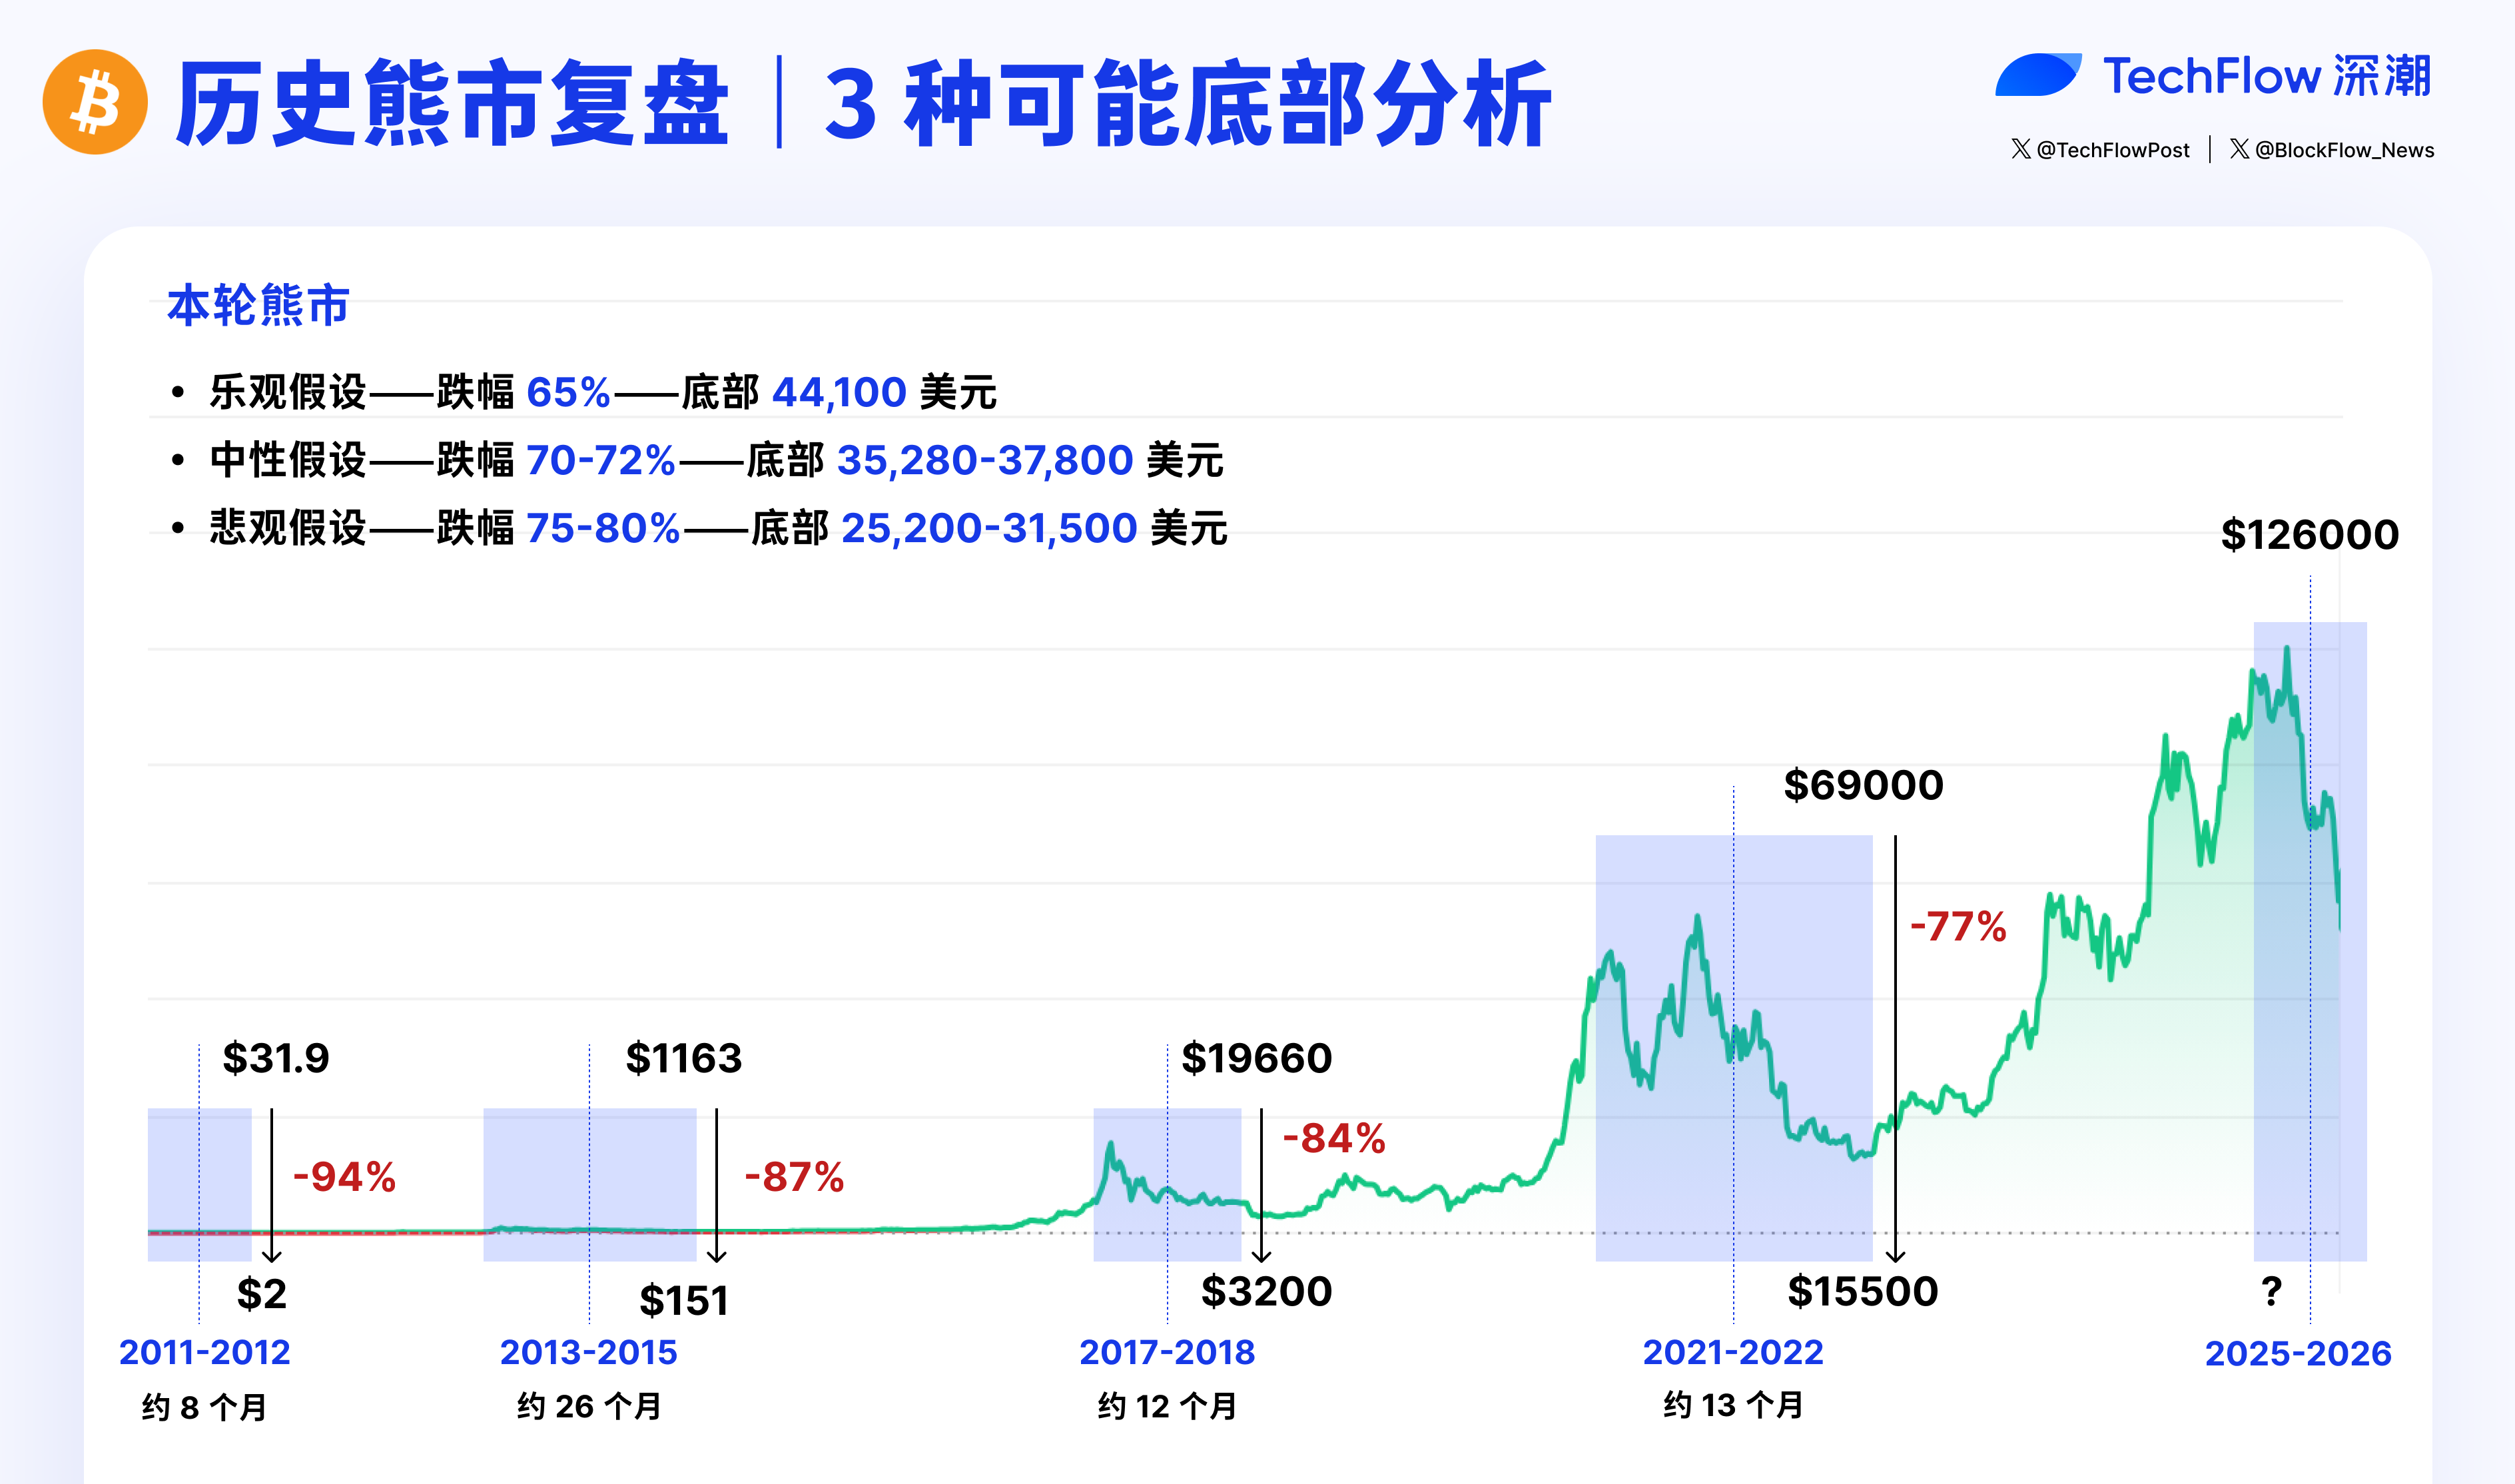
Basing our analysis on the historical pattern of “progressive drawdown reduction,” we can model three scenarios:
Scenario 1: Optimistic assumption—drawdown narrows to 65%
If the maximum drawdown this cycle reaches 65% (a 12-percentage-point drop from the prior cycle’s 77%, slightly exceeding the historical average decline):
Bottom price = $126,000 × (1 − 65%) = $44,100
From $60,000 down to $44,100 implies another 26% downside potential.
Supporting factors:
Institutional holdings have reached an all-time high; ETFs provide robust “buy-side support.”
Although the Fed remains hawkish, market expectations for rate cuts in 2026 have shifted forward—from July to June.
Trump’s White House Crypto Summit on March 7 may deliver policy tailwinds.
Stablecoins are experiencing negative growth, yet their TVL (total value locked) remains stable above $230 billion.
Risk factors:
High-leverage players like Strategy, if forced to liquidate, could trigger cascading effects.
Trump’s “Strategic Reserve” pledge remains unfulfilled—market patience may wear thin.
If you believe this scenario: Begin accumulating gradually below $50,000, and increase position size near $45,000.
Scenario 2: Neutral assumption—drawdown of 70–72%
If the maximum drawdown this cycle lands at 70–72% (strictly following the historical 5–7 percentage point decline per cycle):
Bottom price (70%) = $126,000 × (1 − 70%) = $37,800
Bottom price (72%) = $126,000 × (1 − 72%) = $35,280
From $60,000 down to $35,000–$37,800 implies 37–41% further downside.
Supporting factors:
Fully aligns with historical precedent—neither overly optimistic nor pessimistic.
The current macro environment (rate-cut expectations + quantitative tightening concerns) mirrors conditions seen in 2018.
The $35,000–$38,000 range corresponds to Bitcoin’s “200-week moving average”—a historically strong support level.
Risk factors:
If the U.S. economy enters recession, all risk assets—including Bitcoin—could face indiscriminate selloffs.
If the AI bubble bursts, tech stock crashes could drag Bitcoin down alongside them.
If you believe this scenario: Preserve most of your capital for deployment below $40,000; $35,000–$45,000 becomes your “core accumulation zone.”
Scenario 3: Pessimistic assumption—drawdown reverts to 75–80%
If “this time really is different,” and structural market collapse drives drawdowns back toward the 2017–2022 average:
Bottom price (75%) = $126,000 × (1 − 75%) = $31,500
Bottom price (80%) = $126,000 × (1 − 80%) = $25,200
From the current $70,000 down to $25,000–$31,500 would represent a brutal 50% further collapse.
Supporting factors:
The February 6 “triple crash” (U.S. equities, gold, and Bitcoin all plunging simultaneously) confirms Bitcoin’s “safe-haven” property is fully discredited.
ETFs absorb large volumes—but also mean institutions can “sell with one click.”
Trump administration tariff policies could ignite global trade wars, triggering worldwide recession.
Talent drain across the crypto industry and VC retreat (e.g., Multicoin co-founder Kyle Samani announcing his exit) signal collapsing sector confidence.
If you believe this scenario: Exit the market entirely now—and wait until prices fall decisively below $30,000 before re-entering. Alternatively, hold only 10–20% exposure as a speculative bet, allocating the rest to cash or safe-haven assets.
Don’t Fear Missing Out
Some people constantly worry: “What if I miss buying at this bear-market bottom?”
The answer is simple: chase the next rally—or wait for the next cycle.
Cryptocurrency isn’t your sole shot at turning things around. If you think it is, you’ve already lost.
In 2015, those who missed $150 Bitcoin still had ample opportunity at $3,200 in 2018.
In 2018, those who missed $3,200 still had room to enter at $15,000 in 2022.
But only if you survive to the next cycle.
Don’t abandon the market permanently after one failed all-in bet.
Moreover, most people obsess over “at what price should I buy?” while ignoring “when should I sell?”
Consider three case studies:
Case 1:
Zhang bought heavily at $3,200 in December 2018. By June 2019, Bitcoin hit $13,000—he assumed “bull market confirmed” and held. When it fell back to $7,000 by December 2019, he panicked and sold at a loss.
Final outcome: Less than 1x return—and he exited prematurely, missing the $69,000 peak in 2021.
Case 2:
Li also bought at $3,200—but set a firm rule: “I won’t sell until Bitcoin hits $50,000.” He ignored all volatility between 2019–2020. In April 2021, Bitcoin surged to $63,000; Li sold 50%, locking in 15x profit. He held the remaining 50% until November 2021’s $69,000 peak, then sold out fully.
Outcome: Average return of 18x.
Case 3:
Wang started dollar-cost averaging (DCA) $1,000 monthly from December 2018—regardless of price—continuing for three years until December 2021.
His average cost landed around $12,000 (lower purchases early, higher ones later). At Bitcoin’s $69,000 peak in November 2021, he sold everything—netting ~4.7x return.
Outcome: Slightly lower than Li’s—but required zero timing skill and was the simplest to execute.
These three cases teach us: catching the exact bottom matters less than holding through volatility.
If you don’t intend to HODL forever, setting a clear profit-taking plan upfront is essential. DCA may lack glamour—but it’s ideal for ordinary investors. Very few can perfectly buy at the bottom and sell at the top. Staggered buying and selling remain the most consistently effective approach.
Final Thought: Bear Markets Are the Poor Man’s Opportunity
In 2011, those who bought Bitcoin at $2 have achieved a 30,000x return—even using today’s $60,000 low as the benchmark.
In 2015, buyers at $150 enjoy a 400x gain today.
In 2018, buyers at $3,200 sit on an 18.75x return.
In 2022, buyers at $15,000 have seen a 4x return.
Every bear market represents a redistribution of wealth.
Those who chased euphoric highs get wiped out during the bear market; those who panic-sell at lows hand their chips to others.
The real winners are always those who dare to accumulate gradually when everyone else is despairing.
As long as you believe Bitcoin’s price will rise again—and reach even greater heights.
In 2018, when Bitcoin fell to $3,200, many declared: “Bitcoin is dead.”
In 2022, when Bitcoin sank to $15,000, cries of “crypto’s apocalypse” echoed widely.
In February 2026, as Bitcoin broke below $60,000, the world asks: “Is this time truly different?”
If you believe “history repeats,” then the next 6–12 months represent one of the rare windows in your life to buy “the future” at a relatively low price.
Whether you believe it—or not—is entirely your choice.
Disclaimer: This article is for historical data reference only and does not constitute investment advice. Cryptocurrency investments carry extremely high risk—please make decisions carefully based on your personal circumstances. Neither the author nor TechFlow assumes responsibility for any investment losses.
Join TechFlow official community to stay tuned
Telegram:https://t.me/TechFlowDaily
X (Twitter):https://x.com/TechFlowPost
X (Twitter) EN:https://x.com/BlockFlow_News
 深潮TechFlow