Analyze 10 Major BTC Top Indicators: Why This Bull Market Is Different From Previous Ones?
TechFlow Selected TechFlow Selected
Analyze 10 Major BTC Top Indicators: Why This Bull Market Is Different From Previous Ones?
By examining 10 classic indicators, assessing their characteristics and limitations, and梳理ing the underlying evolutionary trajectory of Bitcoin and the broader cryptocurrency market.
 Navigating Web3 tides with focused insights
Author: WEEX Labs
In previous Bitcoin bull market cycles, price peaks often exhibited clear signs of overheating. However, this bull market appears to have undergone significant changes—many previously reliable indicators have yet to signal a top, while Bitcoin's price has been steadily declining since hitting a new high on October 6, driving many metrics toward bearish readings.
Below, we examine 10 classic indicators, assess their characteristics and limitations, and trace the underlying shifts in Bitcoin and the broader crypto market.
1. Pi Cycle Top Indicator: Has the cycle peak been reached?
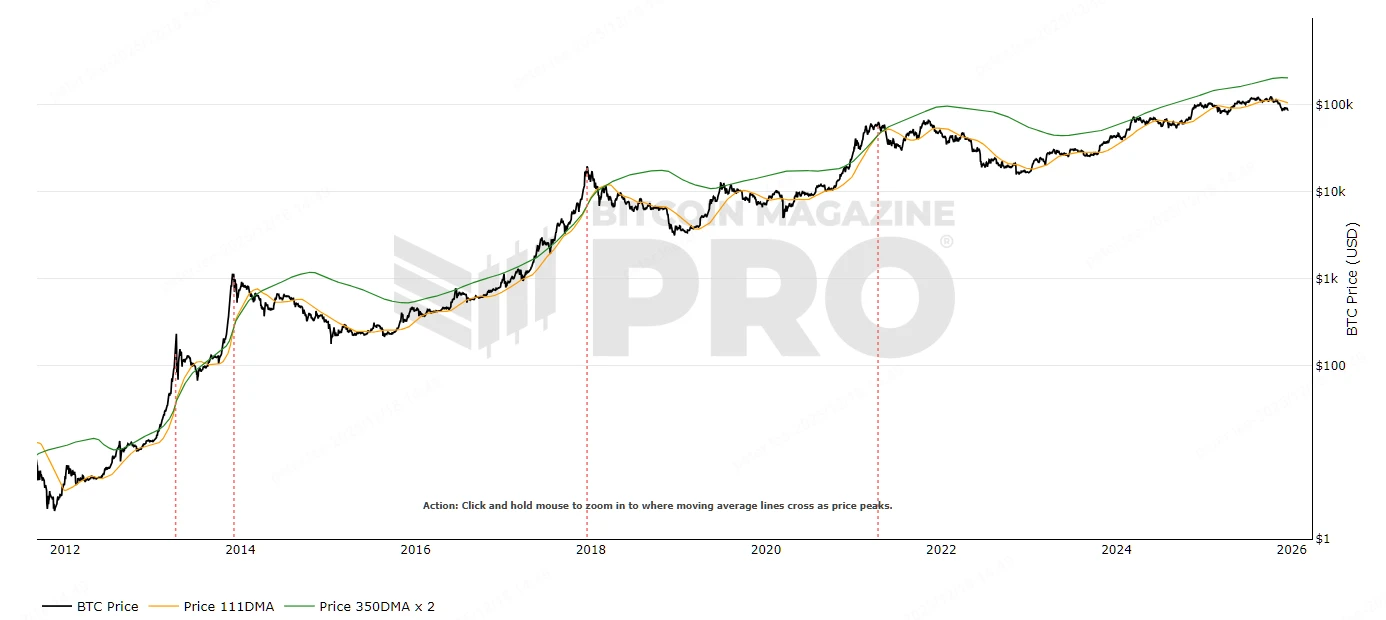
The PI Cycle Top Indicator is a classic tool that uses the 111-day moving average (111DMA) and double the 350-day moving average (350DMA x 2) to identify Bitcoin price tops.
Typically, when the short-term line crosses above the long-term line, it signals a potential market peak, indicating prices are rising too fast relative to fundamental support.
Historically, the Pi Cycle Top Indicator has shown crossovers before each bull market peak:
2017 peak: 111DMA crossed above 350DMA x 2, signaling the subsequent bubble burst;
2021 double top: Similar crossover preceded the first peak, followed by a sharp correction;
Currently (Q4 2025), as shown below, the two lines have not yet crossed.
Source: https://www.bitcoinmagazinepro.com/charts/pi-cycle-top-indicator
2. Puell Multiple: Are miners excessively profitable?
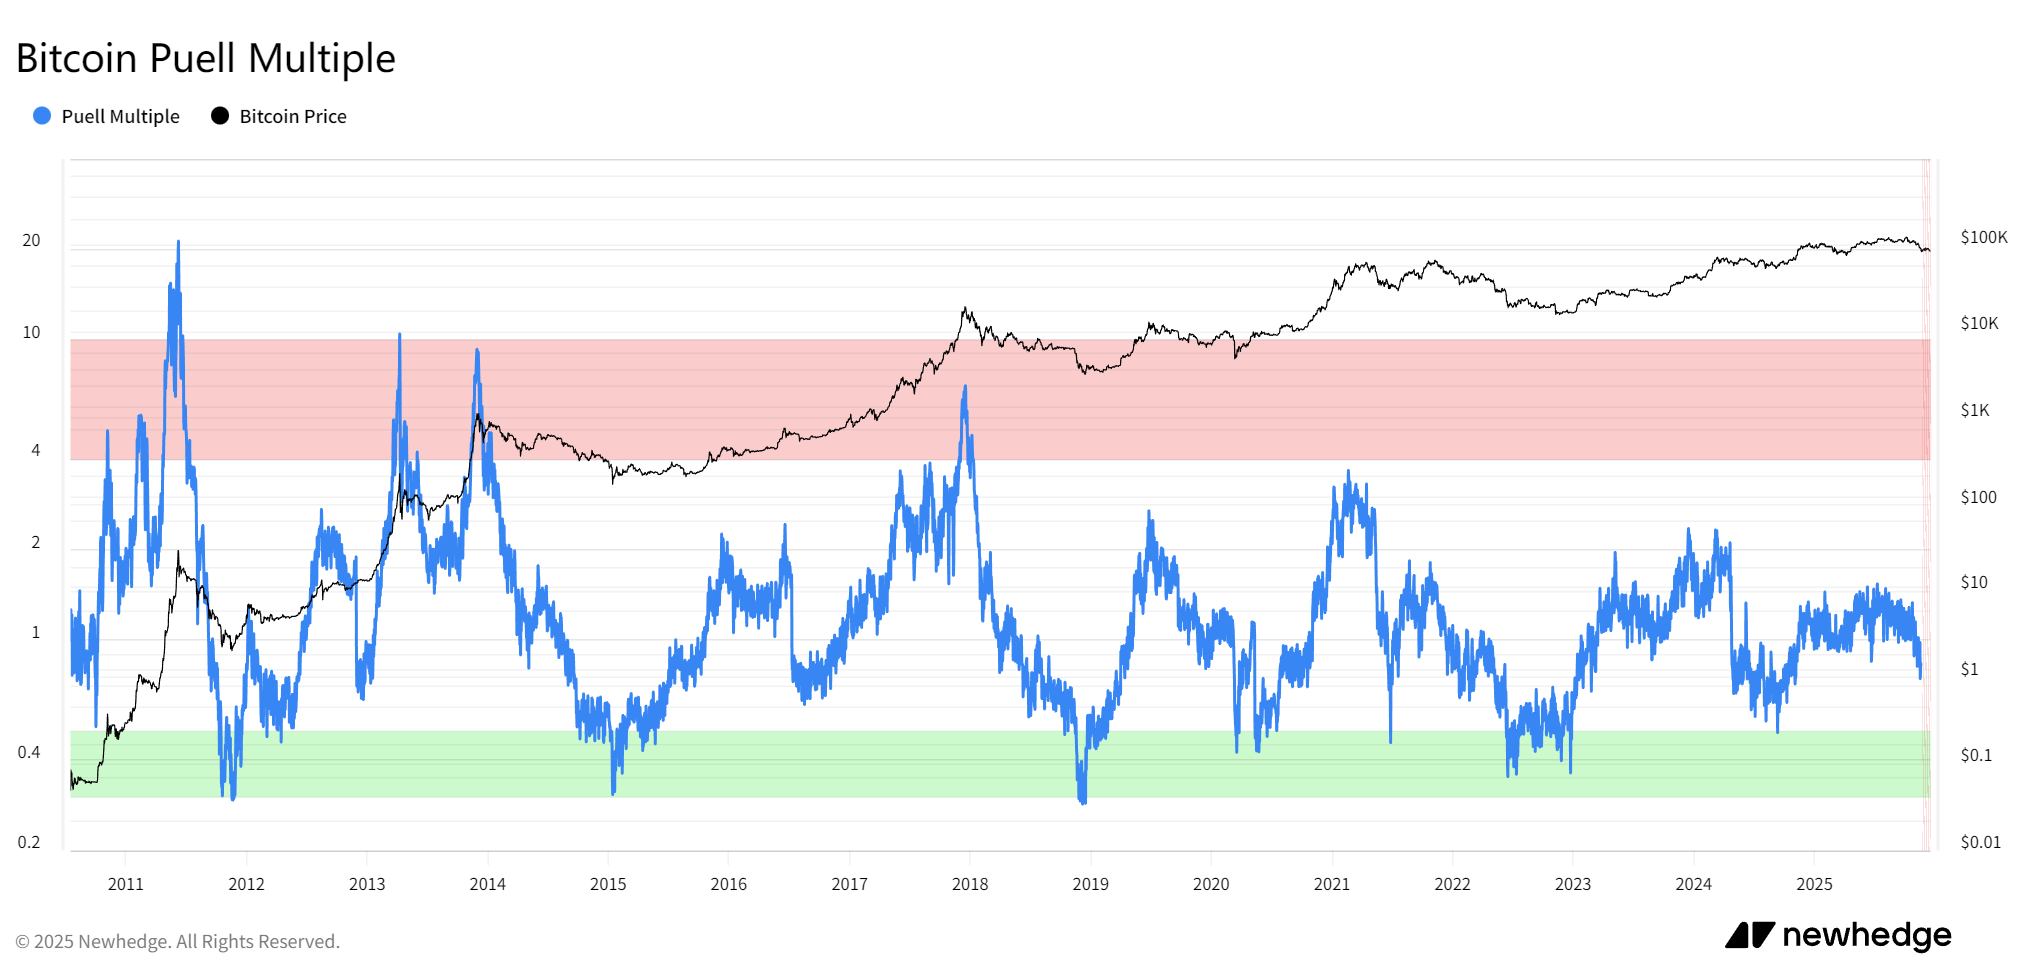
The Puell Multiple measures the ratio of daily miner revenue to its 365-day moving average, used to evaluate miner profitability and market cycles.
It is based on miner behavior: extremely high ratios suggest miners are highly profitable and may increase selling pressure, forming a top; low ratios indicate miner capitulation, signaling a bottom. In other words, a high Puell Multiple reflects a market where "miners are making too much money," accumulating supply pressure.
Historically, the Puell Multiple has shown extreme spikes before each bull market peak:
2017 peak: Surpassed 7, a historical high;
2021 double top: Exceeded 3, followed by collapse;
Currently (Q4 2025), the Puell Multiple is in the 1–2 range, indicating moderate miner stress.
Source: https://newhedge.io/bitcoin/puell-multiple
3. Bitcoin Rainbow Chart: Has price entered the "sell" zone?
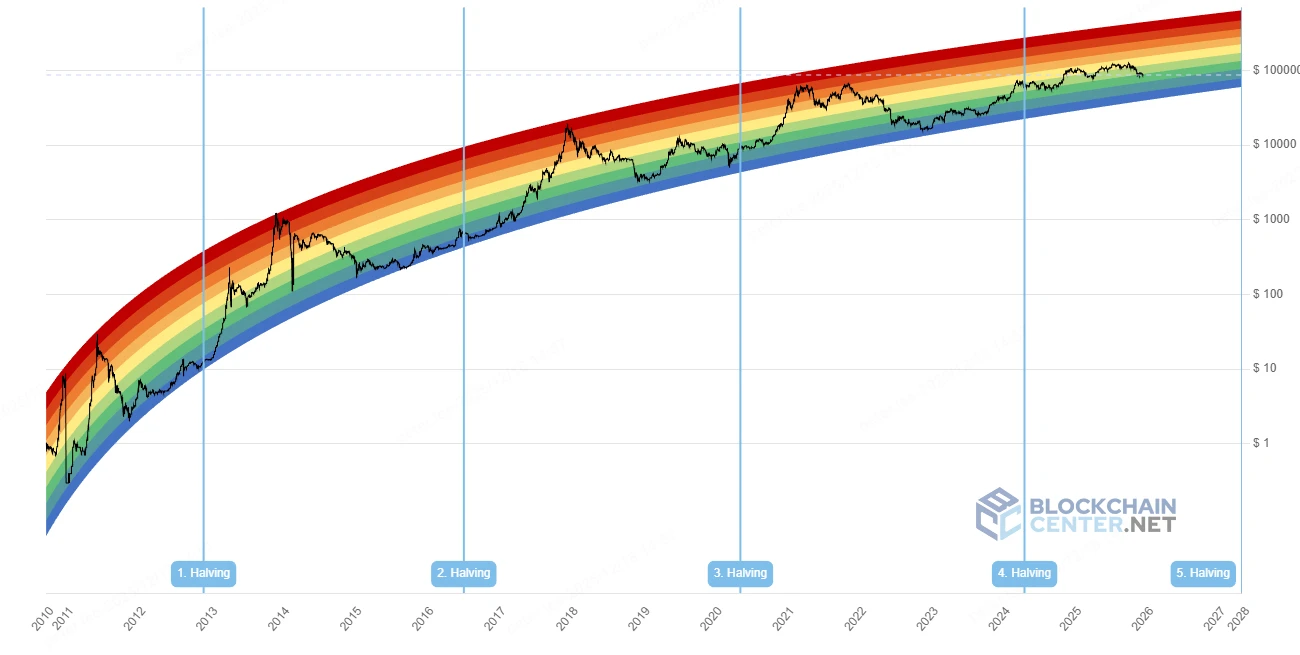
The Bitcoin Rainbow Chart overlays logarithmic growth curves with color bands to assess Bitcoin’s long-term valuation level.
It maps price to color zones: blue indicates undervaluation (buy), red indicates overvaluation (sell). The bands, based on historical growth trends, help identify emotional extremes in the market.
Historically, the Bitcoin Rainbow Chart has entered the red zone before each bull market peak:
2017 peak: Deep red zone, bubble peak;
2021 double top: Orange-red zone, followed by correction;
Currently (Q4 2025), price remains in the yellow to orange range, not yet reaching the red bubble zone. Many analysts have revised this indicator, but regardless of adjustments, current price has clearly not reached the historical red bubble levels.
Source: https://www.blockchaincenter.net/en/bitcoin-rainbow-chart/
4. 2-Year MA Multiplier: Has the multiplier peaked?
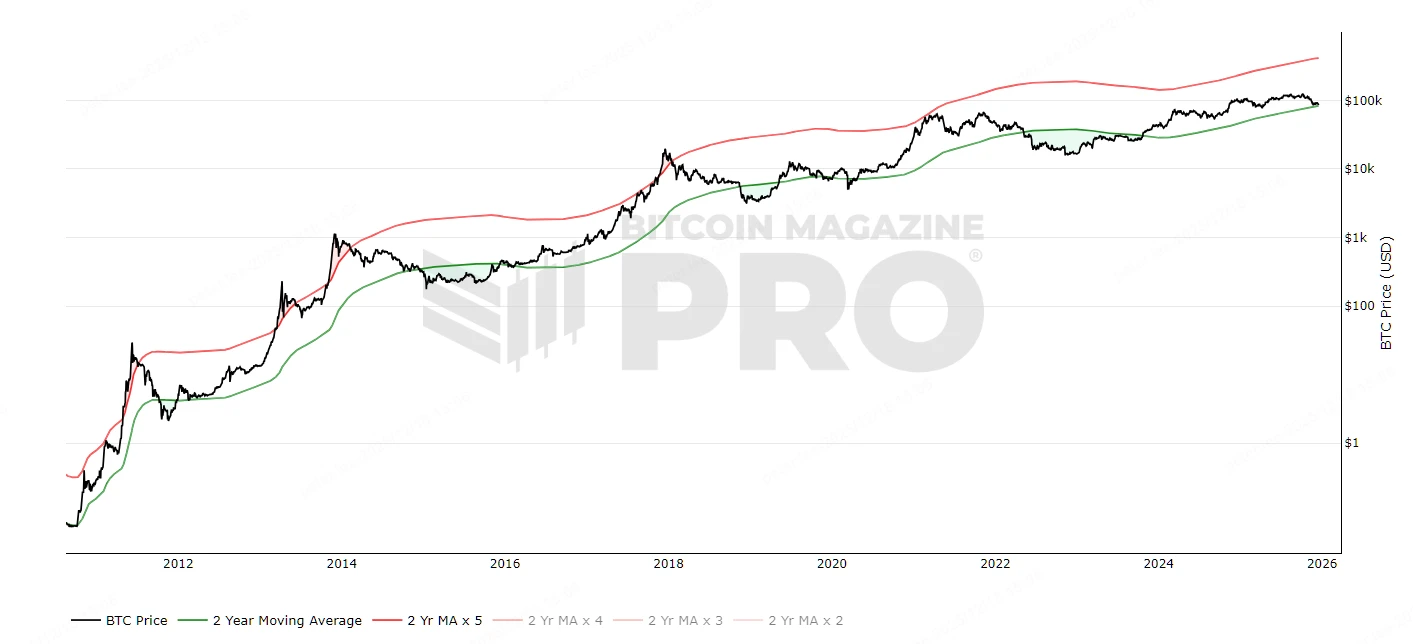
The 2-Year MA Multiplier (also known as Golden Ratio Multiplier) identifies price resistance levels by multiplying the 2-year moving average by Fibonacci ratios.
It combines the golden ratio (1.6) and Fibonacci sequences to assess how many times the price exceeds its long-term average: high multiples indicate overheating and potential pullback. In other words, high multiples mean the price has "deviated too far from the long-term trend," accumulating risk.
Historically, the 2-Year MA Multiplier showed extreme values before each bull market peak:
2017 peak: Price diverged up to 10x from the indicator; price topped one month after breaking above 2 Yr MA *5;
2021 double top: Exceeded 5x, with the first peak occurring right after touching 2 Yr MA *5;
Currently (Q4 2025), the multiplier is in the 2–3 range, not yet entering the high-multiple zone.
Source: https://www.bitcoinmagazinepro.com/charts/bitcoin-investor-tool/
5. Bitcoin 4-Year Moving Average: Is price far above the long-term MA?
The Bitcoin 4-Year Moving Average calculates the average price over four years to assess Bitcoin’s macro trend.
Its purpose is to smooth out cyclical volatility: prices far above the average indicate overheating; prices near the average indicate equilibrium. In other words, large deviations suggest "cyclical bubbles," accumulating risk.
Historically, extreme price deviations from the 4-Year MA preceded each bull market peak:
2017 peak: Reached 16x;
2021 double top: First peak at 6x, followed by collapse;
Currently (Q4 2025), price peaked at 2.3x, showing a pattern of declining peaks.
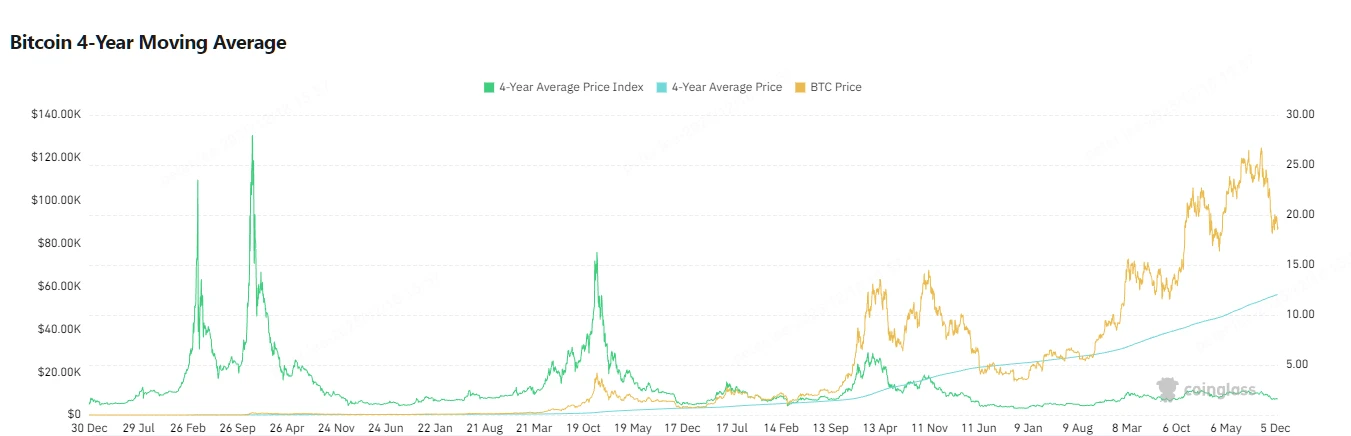
Source: https://www.coinglass.com/pro/i/four-year-moving-average
6. Bitcoin MVRV Z-Score: Has valuation entered the risk zone?
The MVRV Z-Score is a classic on-chain metric for determining whether Bitcoin’s valuation has "deviated from its true value."
It compares Bitcoin’s current market cap with its "realized cap" (the total cost basis of all coins), then calculates the standard deviation. In other words, a higher Z-Score means most holders are in unrealized profit, indicating the market is "too profitable," and risk is building.
Historically, the MVRV Z-Score showed extreme spikes before each bull market peak:
2017 peak: Approached 10, a historical extreme;
2021 double top: First peak exceeded 7, followed by market collapse;
Currently (Q4 2025), the Z-Score is in the 2–4 range, indicating neutral valuation.
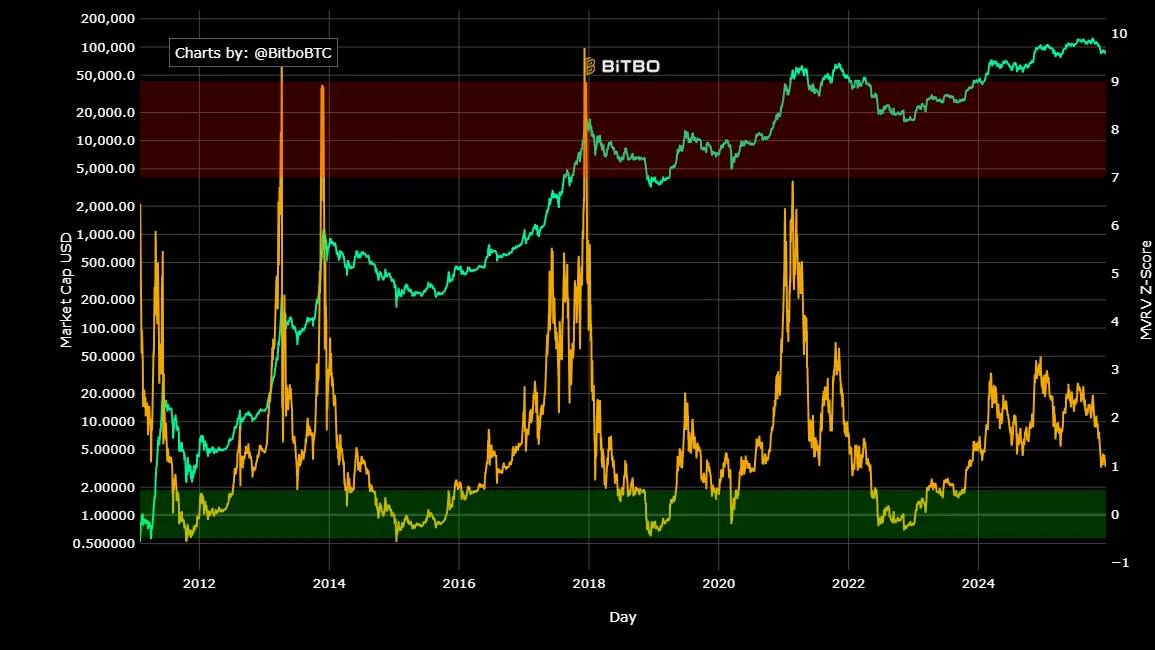
Source: https://charts.bitbo.io/mvrv-z-score
Notably, MVRV Rate enhances MVRV with statistical analysis, measuring the standard deviation between current MVRV and its historical average. This standardization helps identify when Bitcoin’s exchange-traded price is above or below "fair value." However, as shown below, the peak values during each bull market have shown a declining trend, even diverging from price peaks, greatly increasing the difficulty of using this indicator to predict tops.
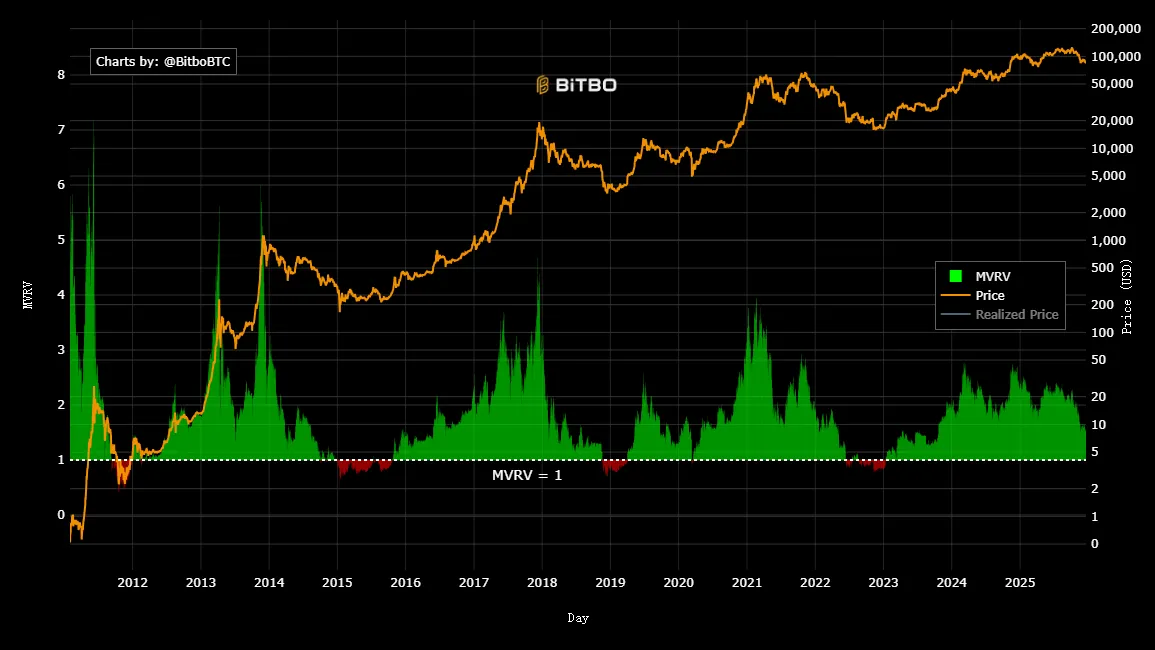
Source: https://charts.bitbo.io/mvrv
7. Altcoin Season Index: Has altcoin season started?
The Altcoin Season Index tracks the performance of the top 100 altcoins relative to Bitcoin, assessing whether an "alt season" has begun.
It is based on relative performance: an index above 75 signals alt season onset, typically occurring after BTC tops as capital flows from BTC to alts. In other words, a high index suggests weakening BTC dominance and increasing market fragmentation and risk.
Historically, each bull market peak ended with a surge in altcoin mania:
2017 peak: Exceeded 90, alt season exploded;
2021 double top: Exceeded 80, followed by BTC correction;
Currently (Q4 2025), the index is in the 30–40 range, with weak altcoin performance. In fact, this cycle, the index never reached 60, possibly due to insufficient liquidity and excessive issuance of new tokens.
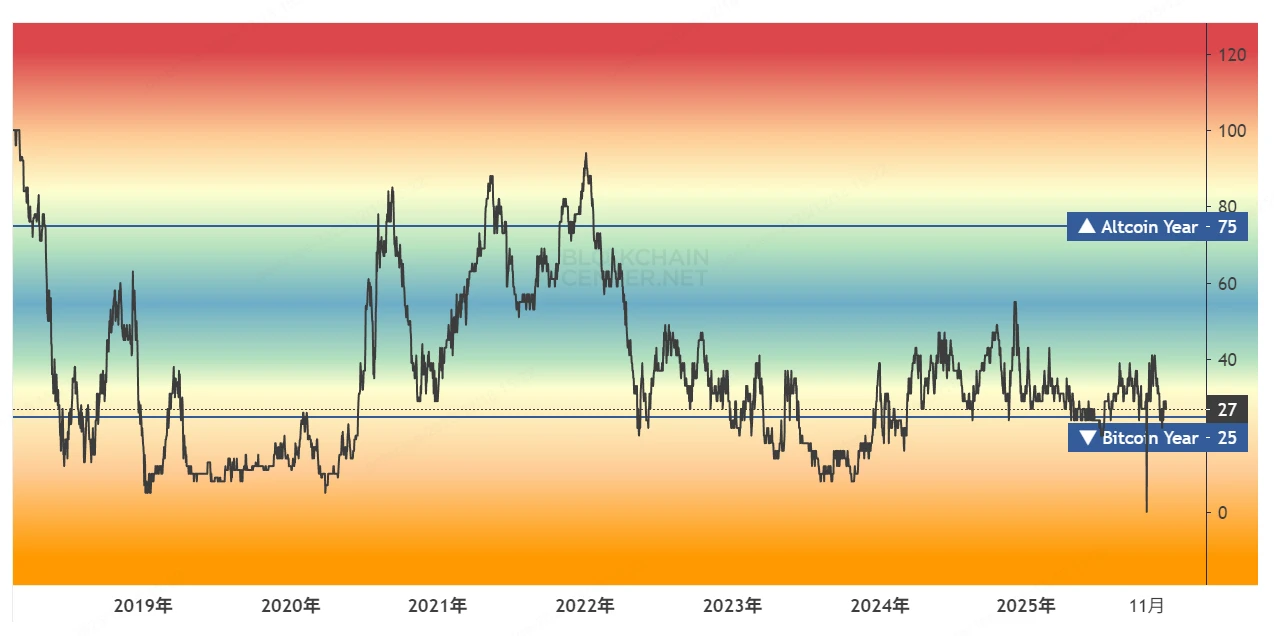
Source: https://www.blockchaincenter.net/en/altcoin-season-index
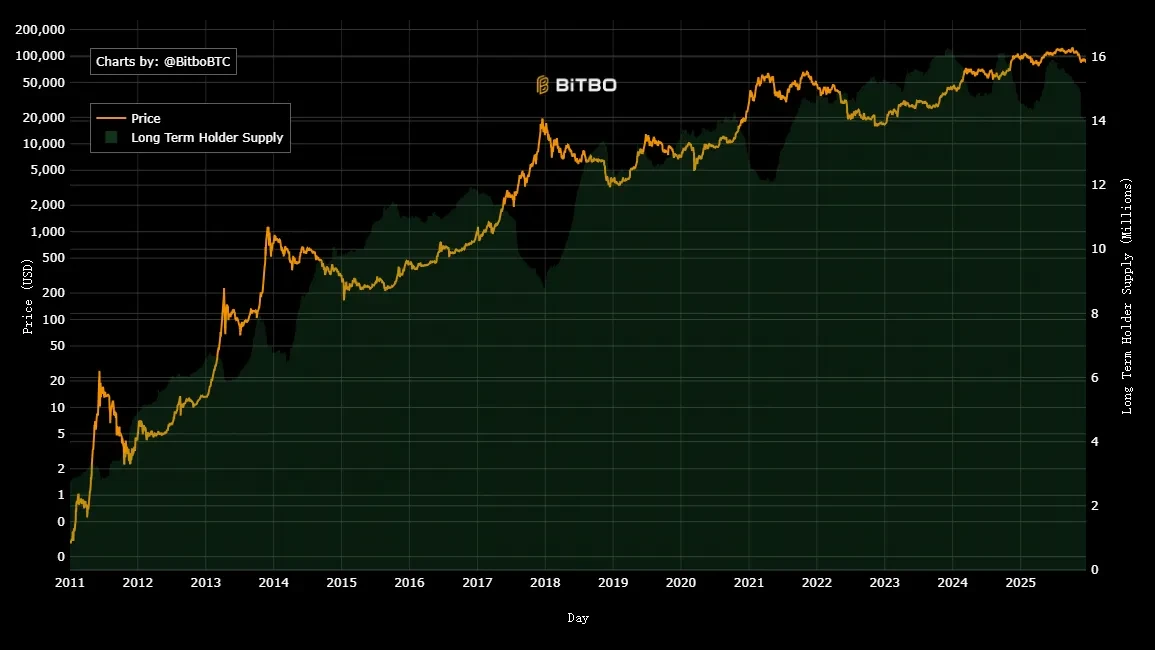
8. Bitcoin Long Term Holder Supply (LTH): Is long-term holder supply decreasing?
Bitcoin Long Term Holder Supply (LTH) tracks the supply of Bitcoin held for more than 155 days, reflecting HODLer behavior.
It observes supply changes: at tops, LTHs often sell to realize profits; at bottoms, they accumulate. In other words, a decrease in LTH supply suggests "smart money" is exiting, indicating high risk.
Historically, LTH supply showed significant declines before each bull market peak:
2017 peak: Selling lasted nearly a year, peaking at the top;
2021 double top: First peak followed six months of continuous selling, but second peak accumulation hit a record high;
Currently (Q4 2025), gradual selling has occurred over six months, but does not align with historical patterns seen at the October peak.
Source: https://charts.bitbo.io/long-term-holder-supply
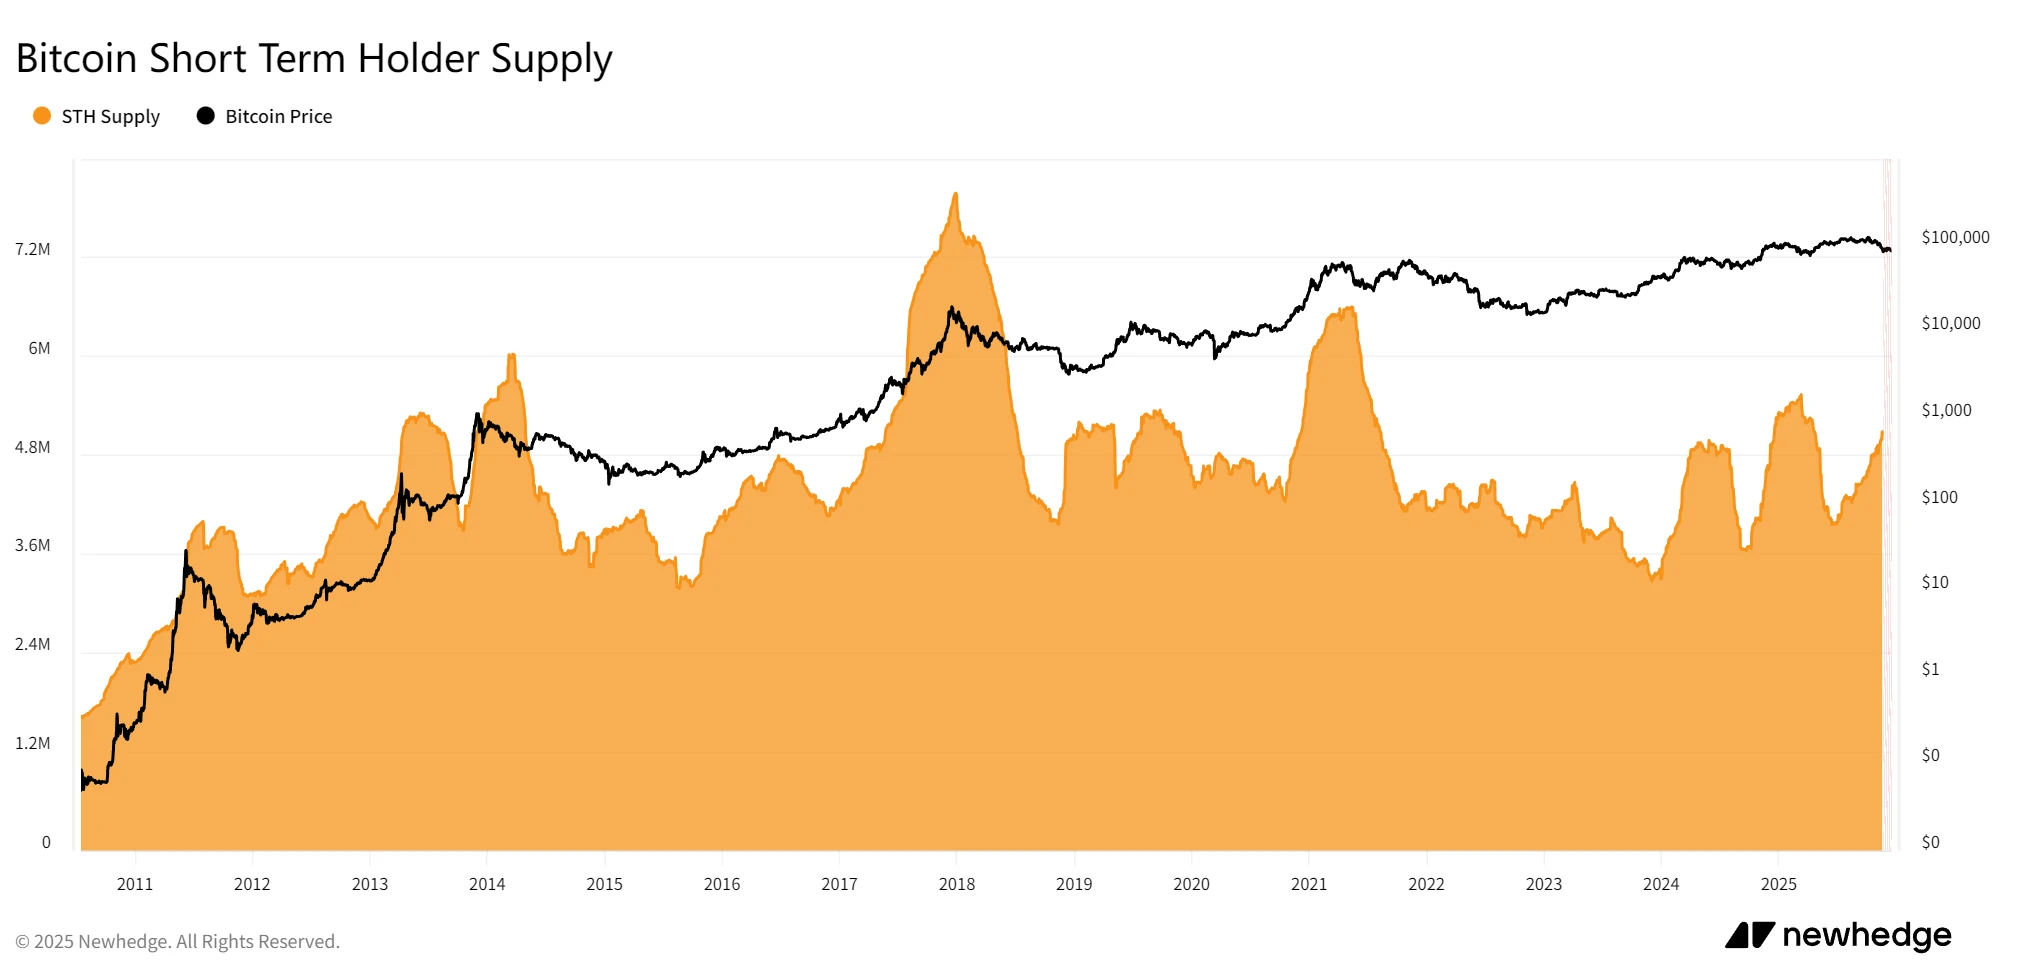
9. Bitcoin Short Term Holder Supply (STH): Is short-term holder supply surging?
Bitcoin Short Term Holder Supply (STH) tracks the proportion of Bitcoin held for less than 155 days, assessing speculative activity by new entrants.
It captures new capital inflows: high proportions indicate rampant speculation, often preceding tops; low proportions suggest market maturity. In other words, high STH means "too many newbies," making bubbles fragile.
Historically, STH surged before each bull market peak:
2017 peak: Nearly 8M BTC, speculative peak;
2021 double top: First peak near 6.5M BTC; second absolute top failed to reach prior peak;
Currently, STH is climbing toward 5.5M BTC, but the price high was on October 6—unlike past cycles, the STH peak no longer closely aligns with the price top.
Source: https://newhedge.io/bitcoin/short-term-holder-supply
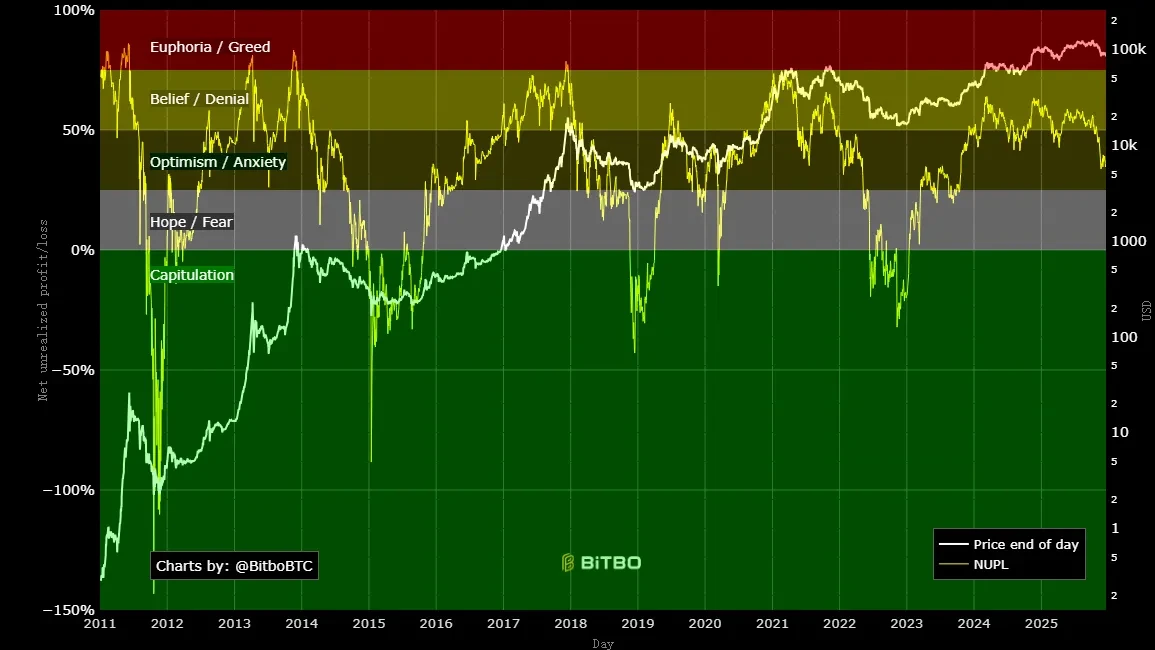
10. Bitcoin Net Unrealized Profit/Loss (NUPL): Has NUPL entered the greed zone?
Bitcoin NUPL measures the network’s overall ratio of unrealized profit to loss, assessing market sentiment.
It calculates (market cap minus realized cap) divided by market cap: above 0.75 indicates greed (top signal); below 0 indicates fear (bottom). In other words, high NUPL means "everyone is in profit," increasing sell-off risk.
Historically, Bitcoin NUPL reached extreme highs before each bull market peak:
2017 peak: Exceeded 0.8, a historical extreme;
2021 double top: Exceeded 0.7, followed by collapse;
Currently (Q4 2025), NUPL peaked at 0.64 in early March 2024, has since fluctuated, and now stands at 0.34.
Source: https://charts.bitbo.io/net-unrealized-profit-loss
Conclusion: Structural changes in this Bitcoin bull market
From the above indicators, current Bitcoin market behavior does not strongly align with the extreme conditions seen at past bull market tops. Historically, peaks coincided with multiple overheated indicators—high Z-Score, high Puell Multiple, NUPL in greed zone, combined with LTH selling and STH surge—but today these metrics remain relatively mild.
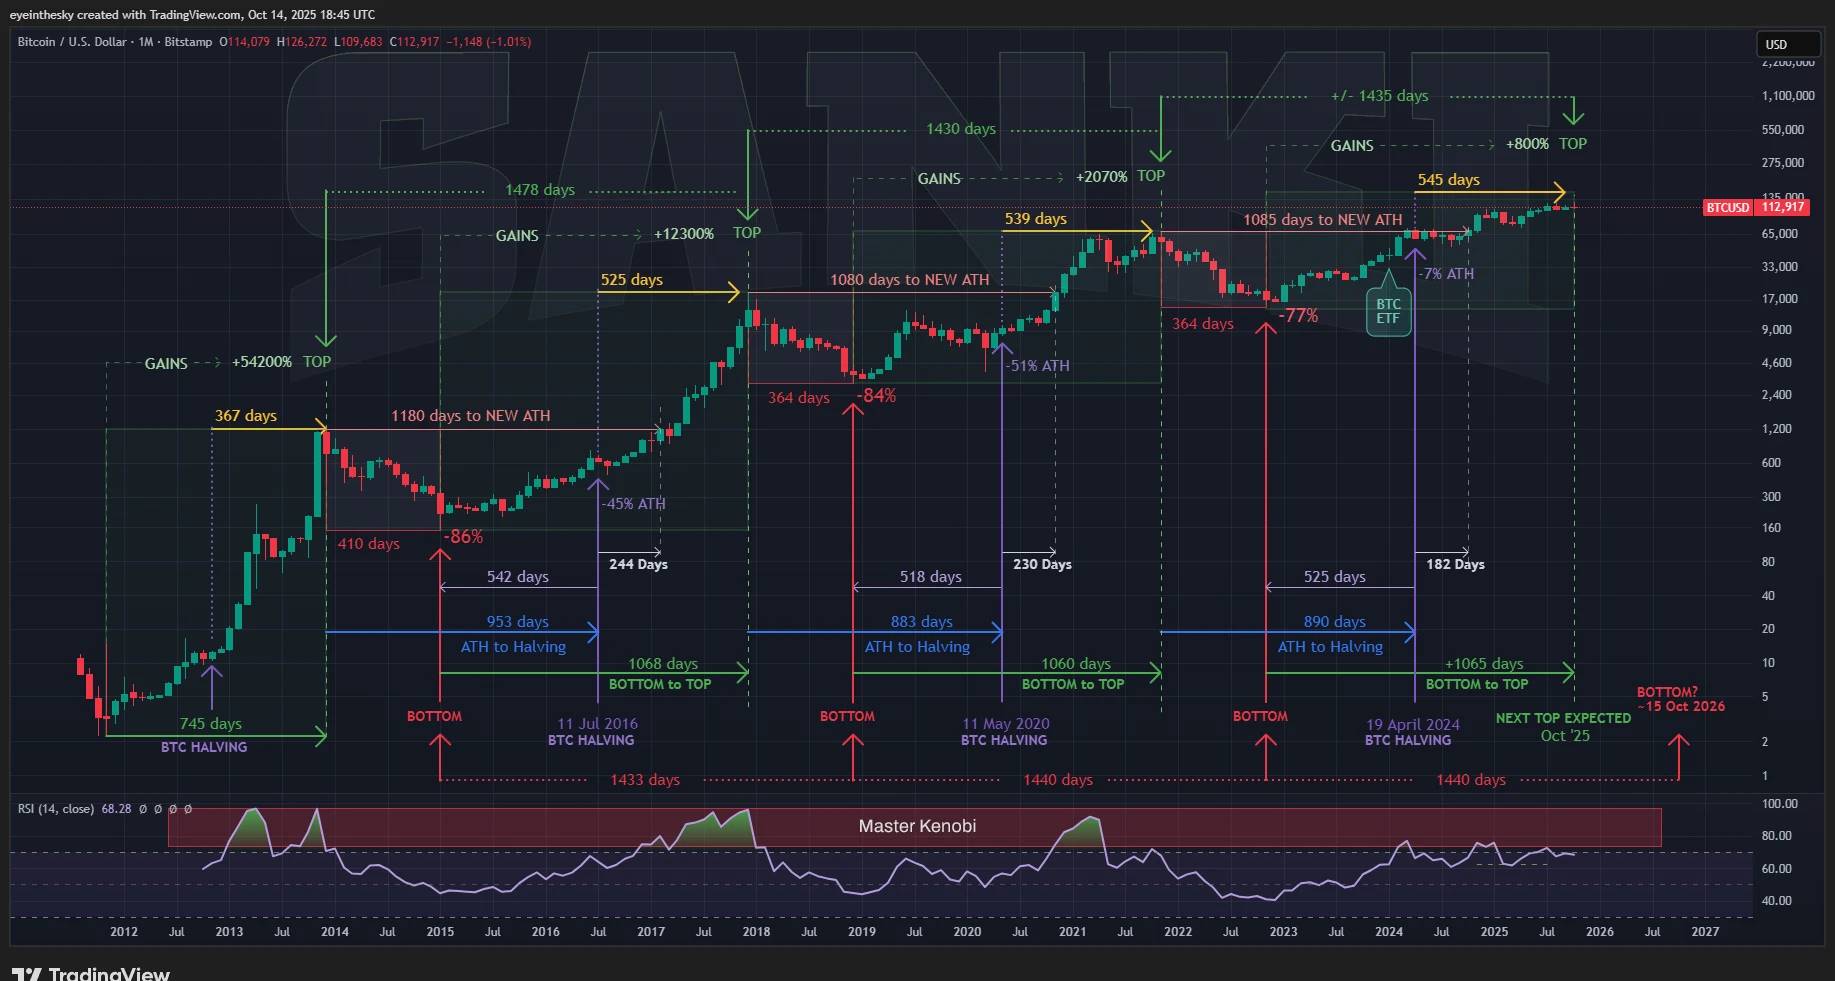
This does not necessarily mean Bitcoin has not yet topped. These indicators are space-based, while the diagram below, which uses a 3-year time cycle to forecast price tops, suggests Bitcoin may already have peaked.
Source: https://x.com/btc_MasterPlan/status/1978180632410042828/photo/1
Of course, our analysis shows that tools based on linear price projections are showing signs of diminishing effectiveness, exhibiting diminishing marginal returns. For example, MVRV peak values at bull market tops were 10 in 2017, 7 in 2021, and 3 in 2025—we can no longer expect MVRV to reach 7 in this cycle, nor reliably use it to pinpoint the top.
In other words, while these indicators suggest a neutral or moderate market, they do not confirm whether the bull market continues or a bear market has begun. Instead, they reflect that Bitcoin’s growth has become more gradual rather than explosive, possibly due to:
• First, the introduction of Bitcoin ETFs has attracted substantial long-term capital, stabilizing supply dynamics—a contrast to past retail-driven bubbles, slowing the pace of overheating.
• Second, global liquidity shifts in 2025 (Fed rate cuts vs. yen hikes) and geopolitical developments have repeatedly disrupted BTC pricing, while the steady evolution of metrics reflects a more mature market.
In summary, regardless of whether October 6 marked the top of this bull run, we must acknowledge that Bitcoin’s price dynamics may have broken free from historical frameworks and experiences. It appears to be undergoing a structural shift—from a "cyclical asset" toward a "mainstream reserve." Investors should note that these indicators may require adjusted thresholds or combined usage to remain effective for investment decisions.
About Us
WEEX Labs is the research division of WEEX cryptocurrency exchange, dedicated to tracking and analyzing cryptocurrencies, blockchain technologies, and emerging market trends, providing professional assessments.
Committed to objective, independent, and comprehensive analysis, the team employs rigorous methodologies and cutting-edge data analytics to explore frontier developments and investment opportunities, delivering thorough, precise, and clear insights to the industry, and offering comprehensive strategic guidance for Web3 startups and investors.
Disclaimer
The views expressed in this article are for informational purposes only and do not constitute endorsement of any product or service mentioned, nor should they be construed as investment, financial, or trading advice. Readers should consult qualified professionals before making any financial decisions. Please note that WEEX Labs may restrict or prohibit all or part of its services to users from restricted regions.
Join TechFlow official community to stay tuned
Telegram:https://t.me/TechFlowDaily
X (Twitter):https://x.com/TechFlowPost
X (Twitter) EN:https://x.com/BlockFlow_News
 @WEEX_Official