If the foundation of the wild山寨 season is Bitcoin volatility, then it might really be coming
TechFlow Selected TechFlow Selected
If the foundation of the wild山寨 season is Bitcoin volatility, then it might really be coming
Increased leverage, profit-taking, and heightened speculative intensity are all characteristics historically associated with mature market stages.
 Navigating Web3 tides with focused insights
Writing: UkuriaOC, CryptoVizArt, Glassnode
Translation: AididiaoJP, Foresight News
Summary
Despite Bitcoin reaching a new all-time high of $124,400, its capital inflows have continued to decline. This period of weaker capital inflow highlights a notably diminished investor appetite at current levels.
As Bitcoin's price hit its all-time peak, the total open interest in major altcoins also reached a record high of $60 billion, underscoring the market's elevated leverage. However, this condition was short-lived; as prices corrected downward, open interest dropped by $2.6 billion, marking the tenth-largest decline on record.
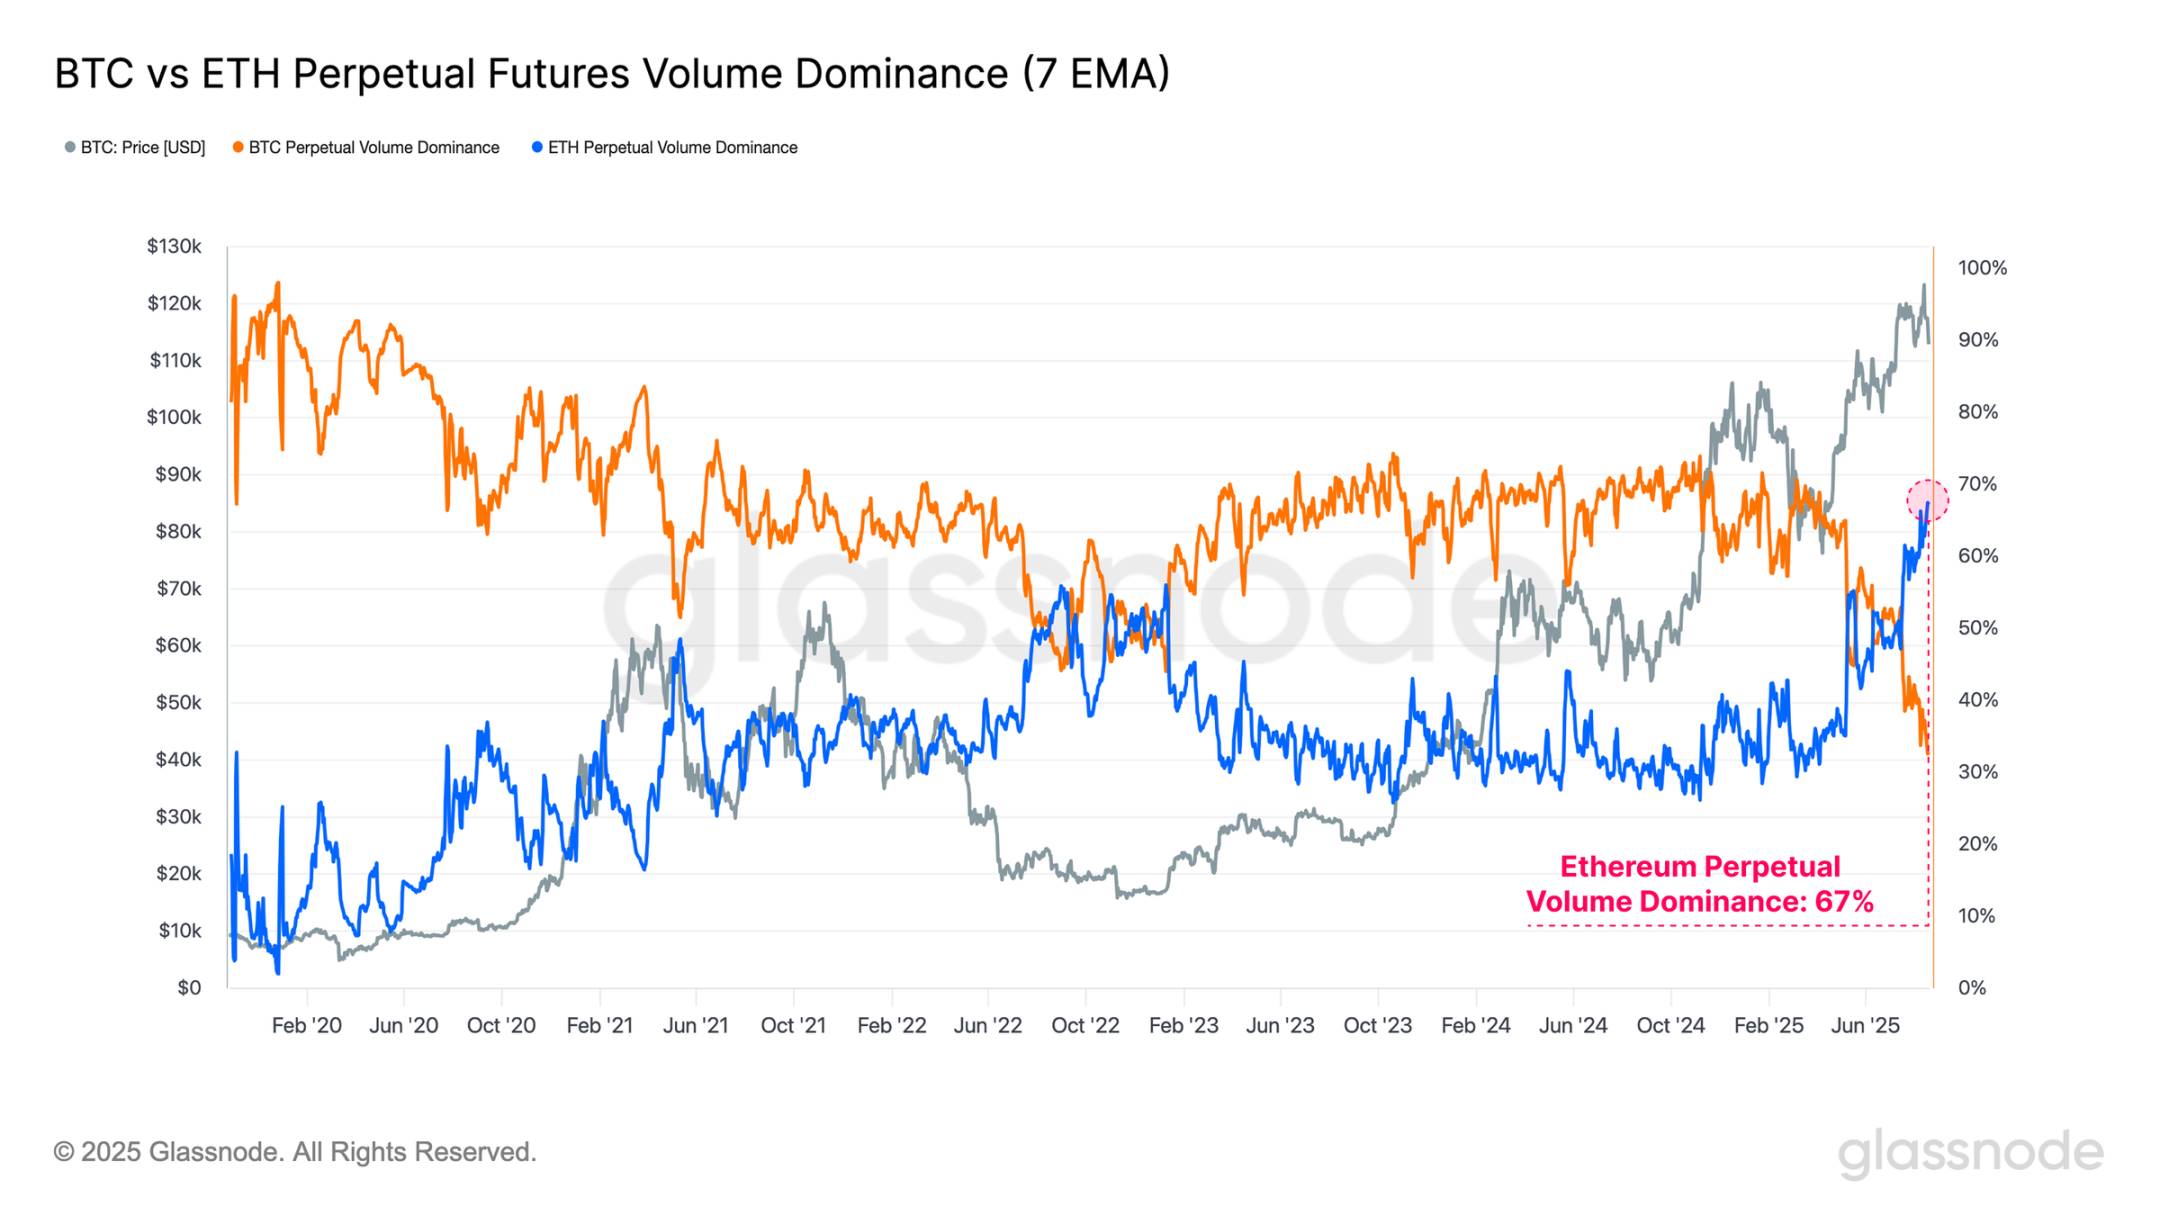
Ethereum, often viewed as a bellwether asset, typically performs strongly during broader "altseason" phases in the digital asset market. Notably, Ethereum’s open interest dominance has reached its fourth-highest level on record, while its perpetual futures trading volume dominance surged to a new all-time high of 67%.
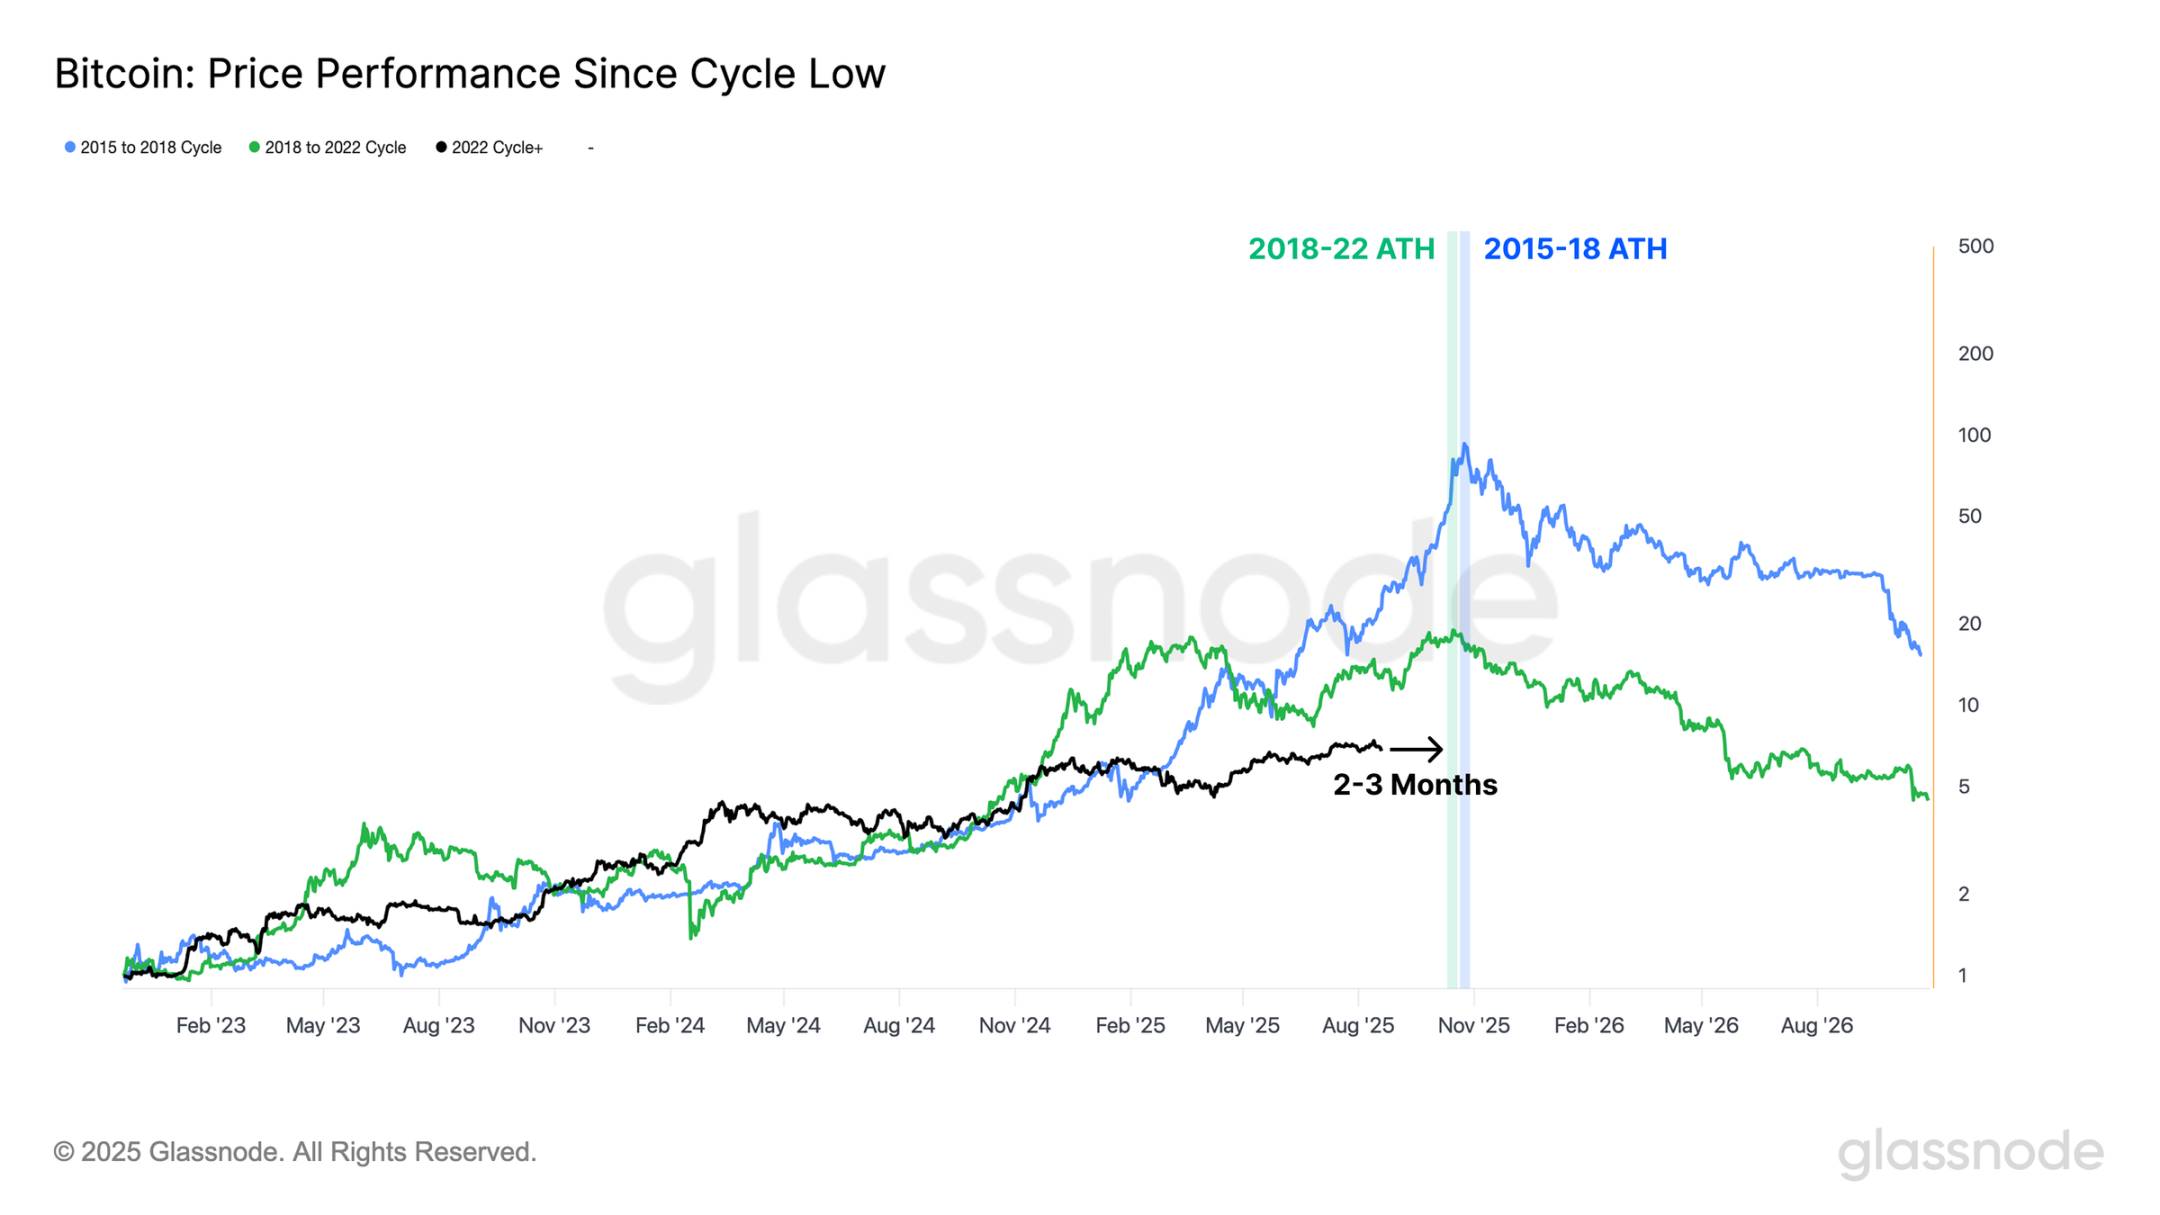
When observing Bitcoin’s performance from each cycle low, we see that in both the 2015–2018 and 2018–2022 cycles, the time to reach the all-time high—on a relative timeline—was approximately 2–3 months later than where we currently stand in the present cycle.
Slowing Capital Flows
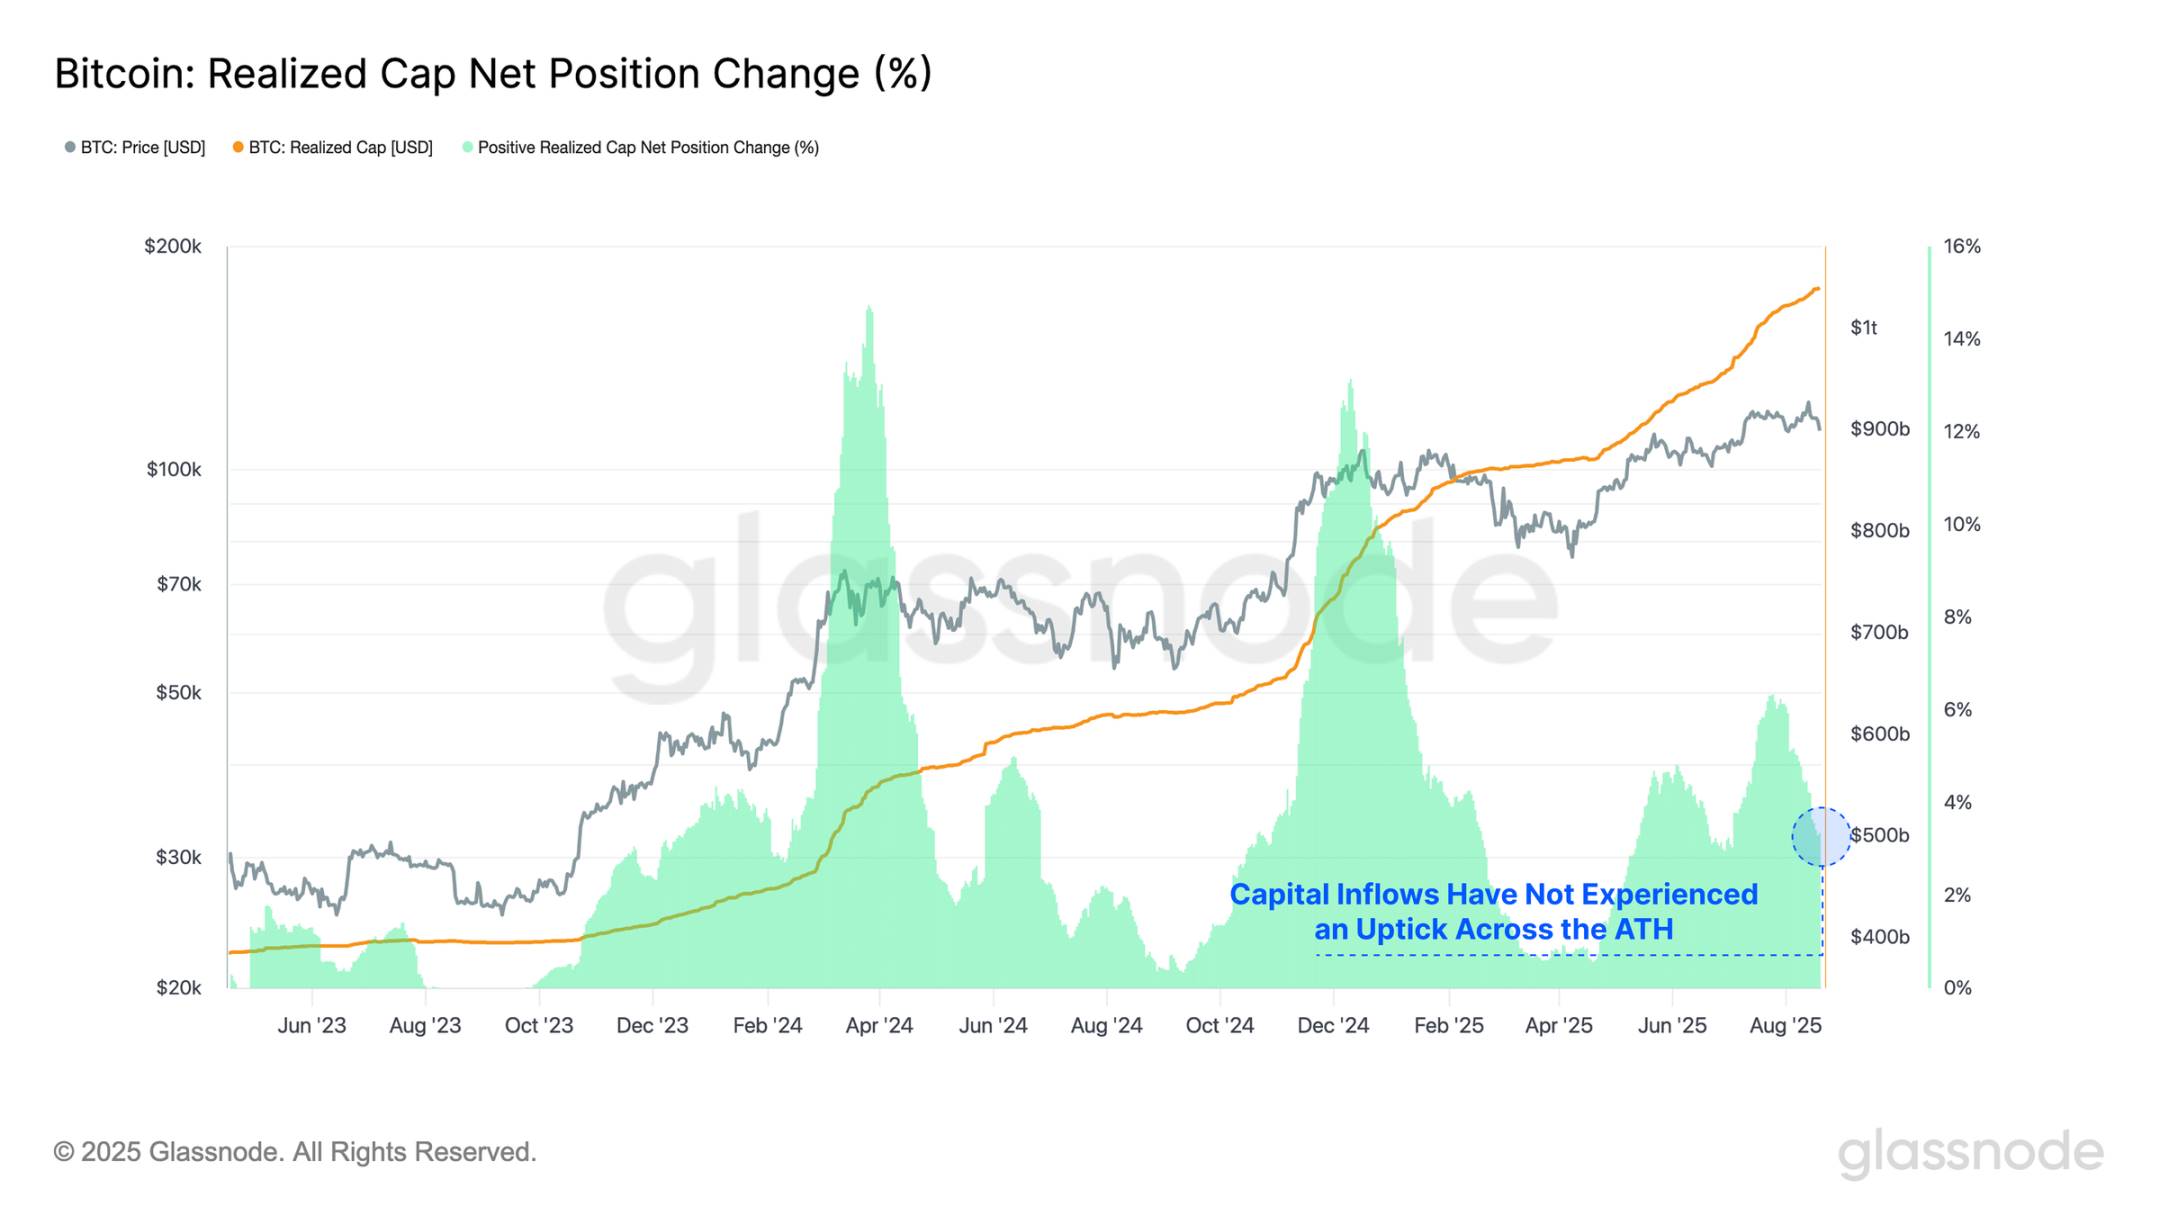
After hitting a high of $124,400 last week, Bitcoin’s upward momentum has stalled, with prices retreating to a low of $112,900—a nearly 9.2% pullback. This decline has been accompanied by noticeably weak capital inflows in recent weeks, indicating investor reluctance to deploy fresh capital at these elevated price levels.
When comparing current capital inflow rates to previous all-time highs, the growth rate of realized market cap is far below levels seen during the March and December 2024 ATH breaks. At the first breach of $100,000 in late 2024, the monthly realized market cap growth reached +13%, whereas the current environment peaked at a much lower +6% per month.
This period of weaker capital inflow underscores a significantly reduced investor demand at present.
Live chart
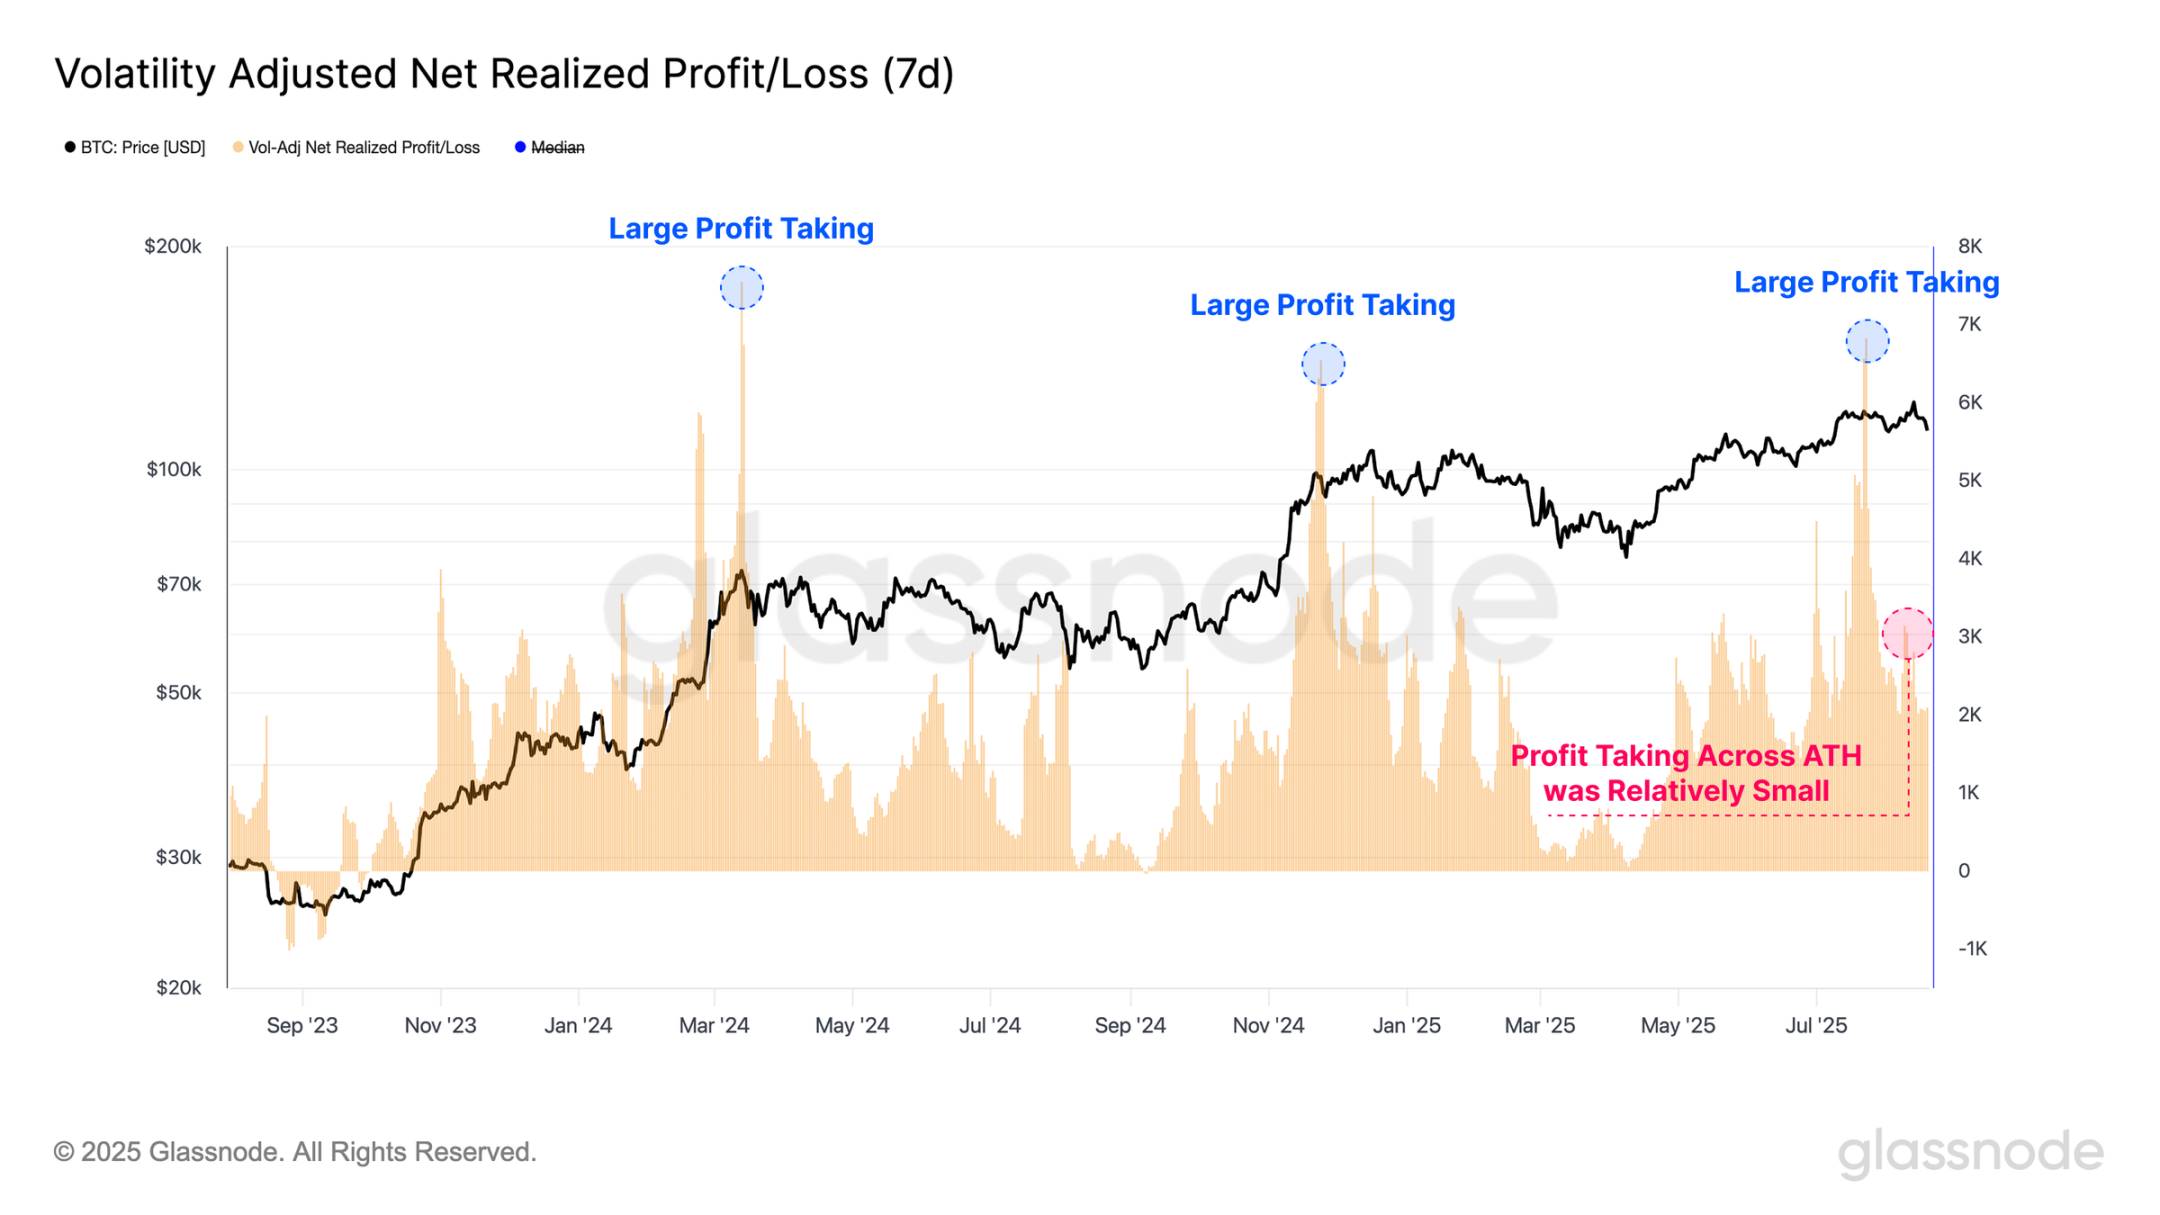
Profit-taking activity has also declined in recent weeks, observable through the volatility-adjusted Net Realized Profit/Loss indicator. This metric measures realized profits and losses in Bitcoin (BTC) units and is standardized against Bitcoin’s growing market value across cycles. It is further refined by adjusting for 7-day realized volatility, accounting for diminishing returns and slowing growth as the asset matures.
Notably, we observe three major profit-taking events near the $70,000 and $100,000 breakouts in 2024, as well as near this year’s $122,000 all-time high. These events indicate strong willingness among investors to lock in substantial profits, matched by equally robust demand absorbing the sell-side supply.
In contrast, during this latest attempt at an all-time high, realized profit-taking volumes have significantly declined. One interpretation of this dynamic is that while selling pressure from existing holders is lower, the market has failed to sustain upward momentum.
Live chart
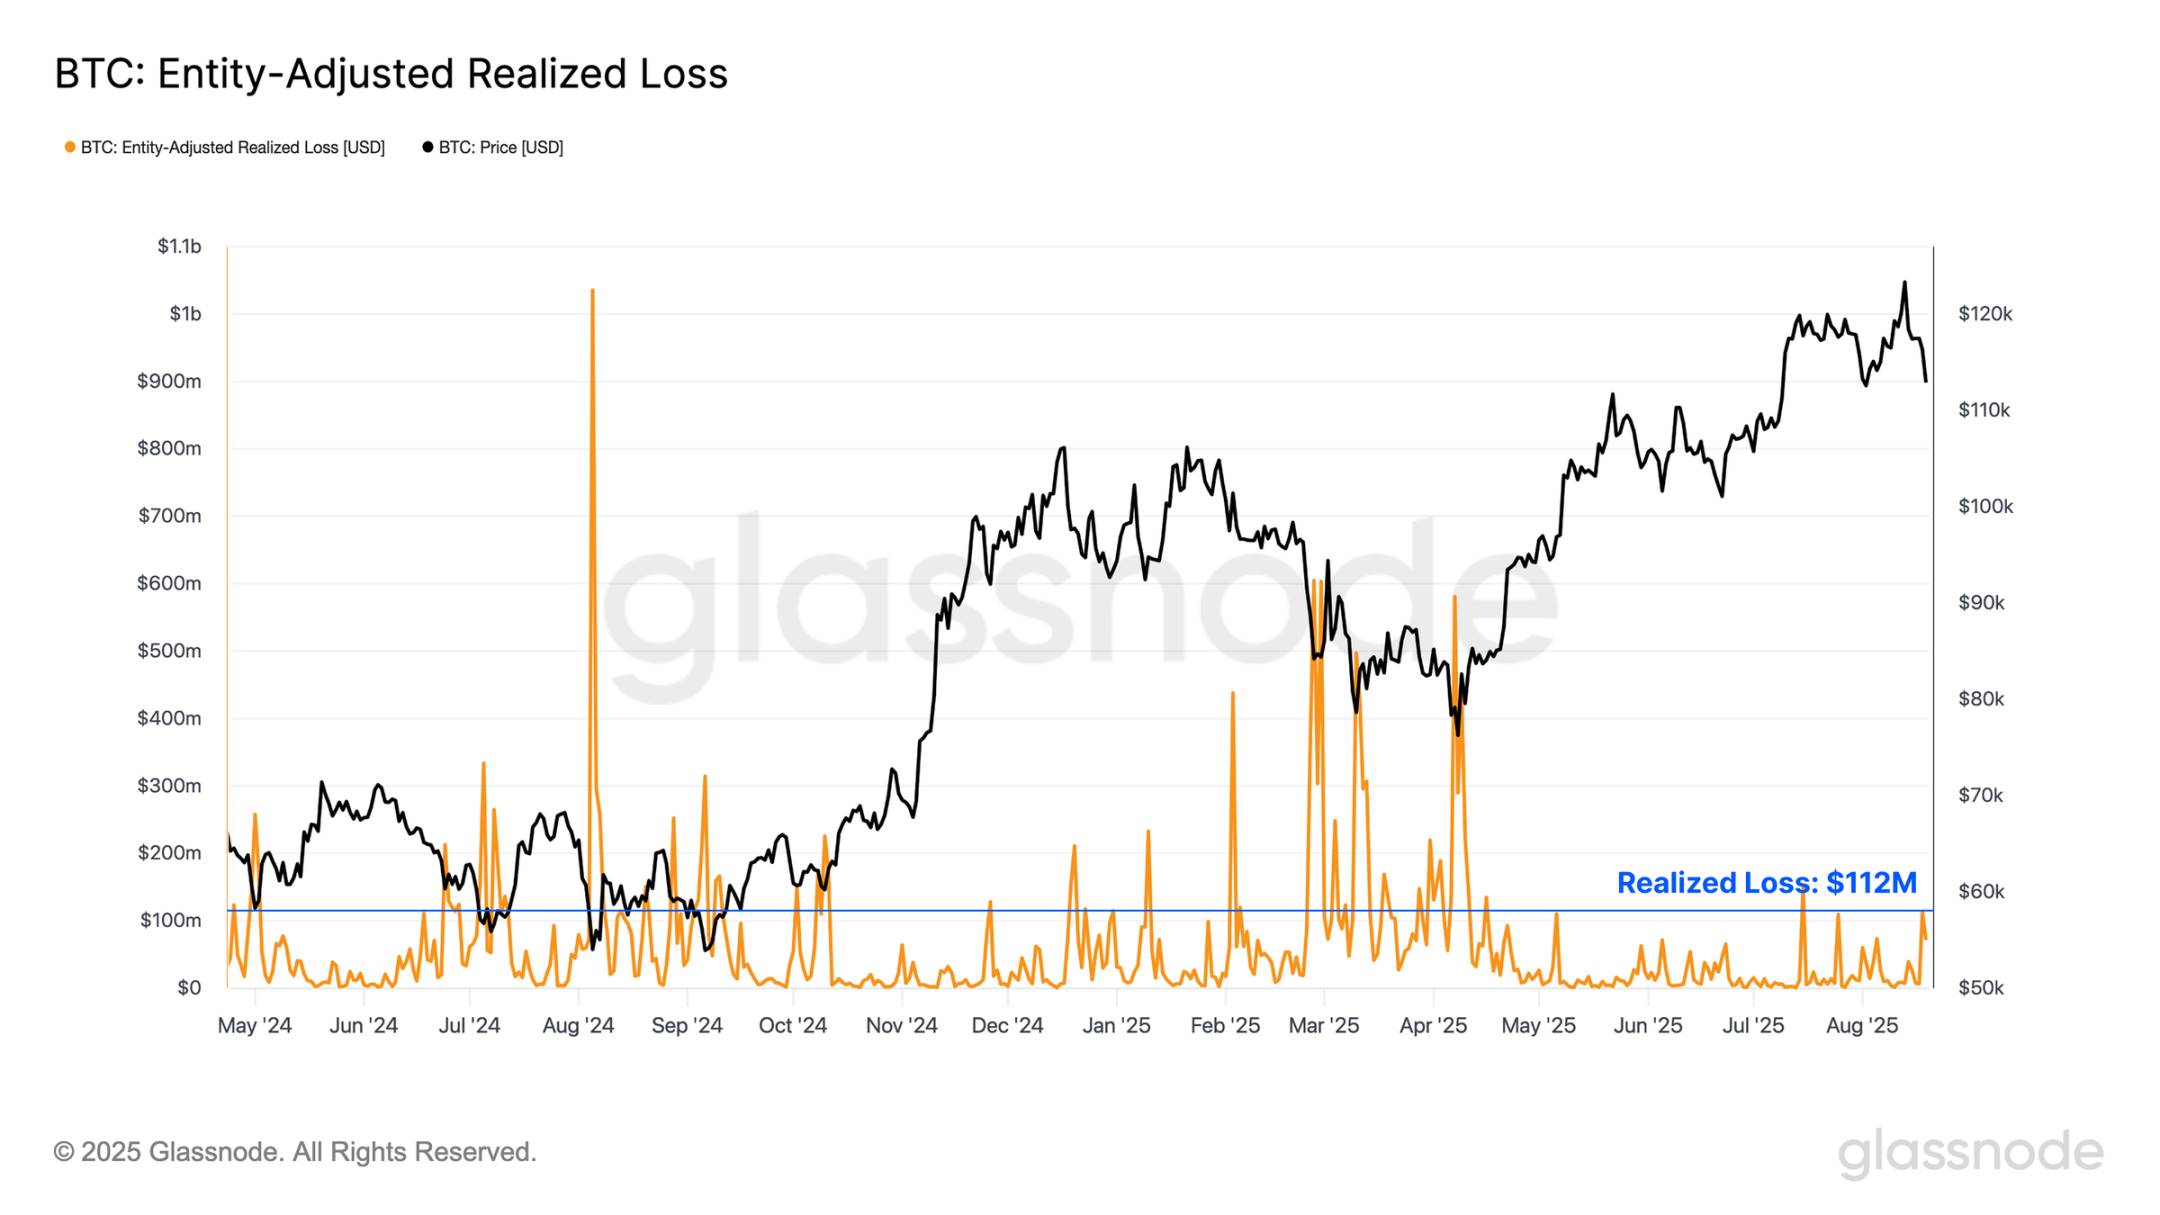
With local market momentum reversing and prices trending lower, attention turns to realized loss events to assess whether investor sentiment is undergoing any significant negative shift. During this local downtrend, investor loss realization has accelerated to $112 million in value per day.
However, this remains within the typical range observed during pullbacks in prior bull cycles. Numerous past events—including the unwinding of the yen carry trade in August 2024 and the "Trump tariff panic" between March and April 2025—resulted in significantly higher capitulation volumes.
This suggests that while rising losses may begin to challenge this view, the current downturn has not yet materially impacted investor confidence.
Live chart
Leverage-Driven Decline
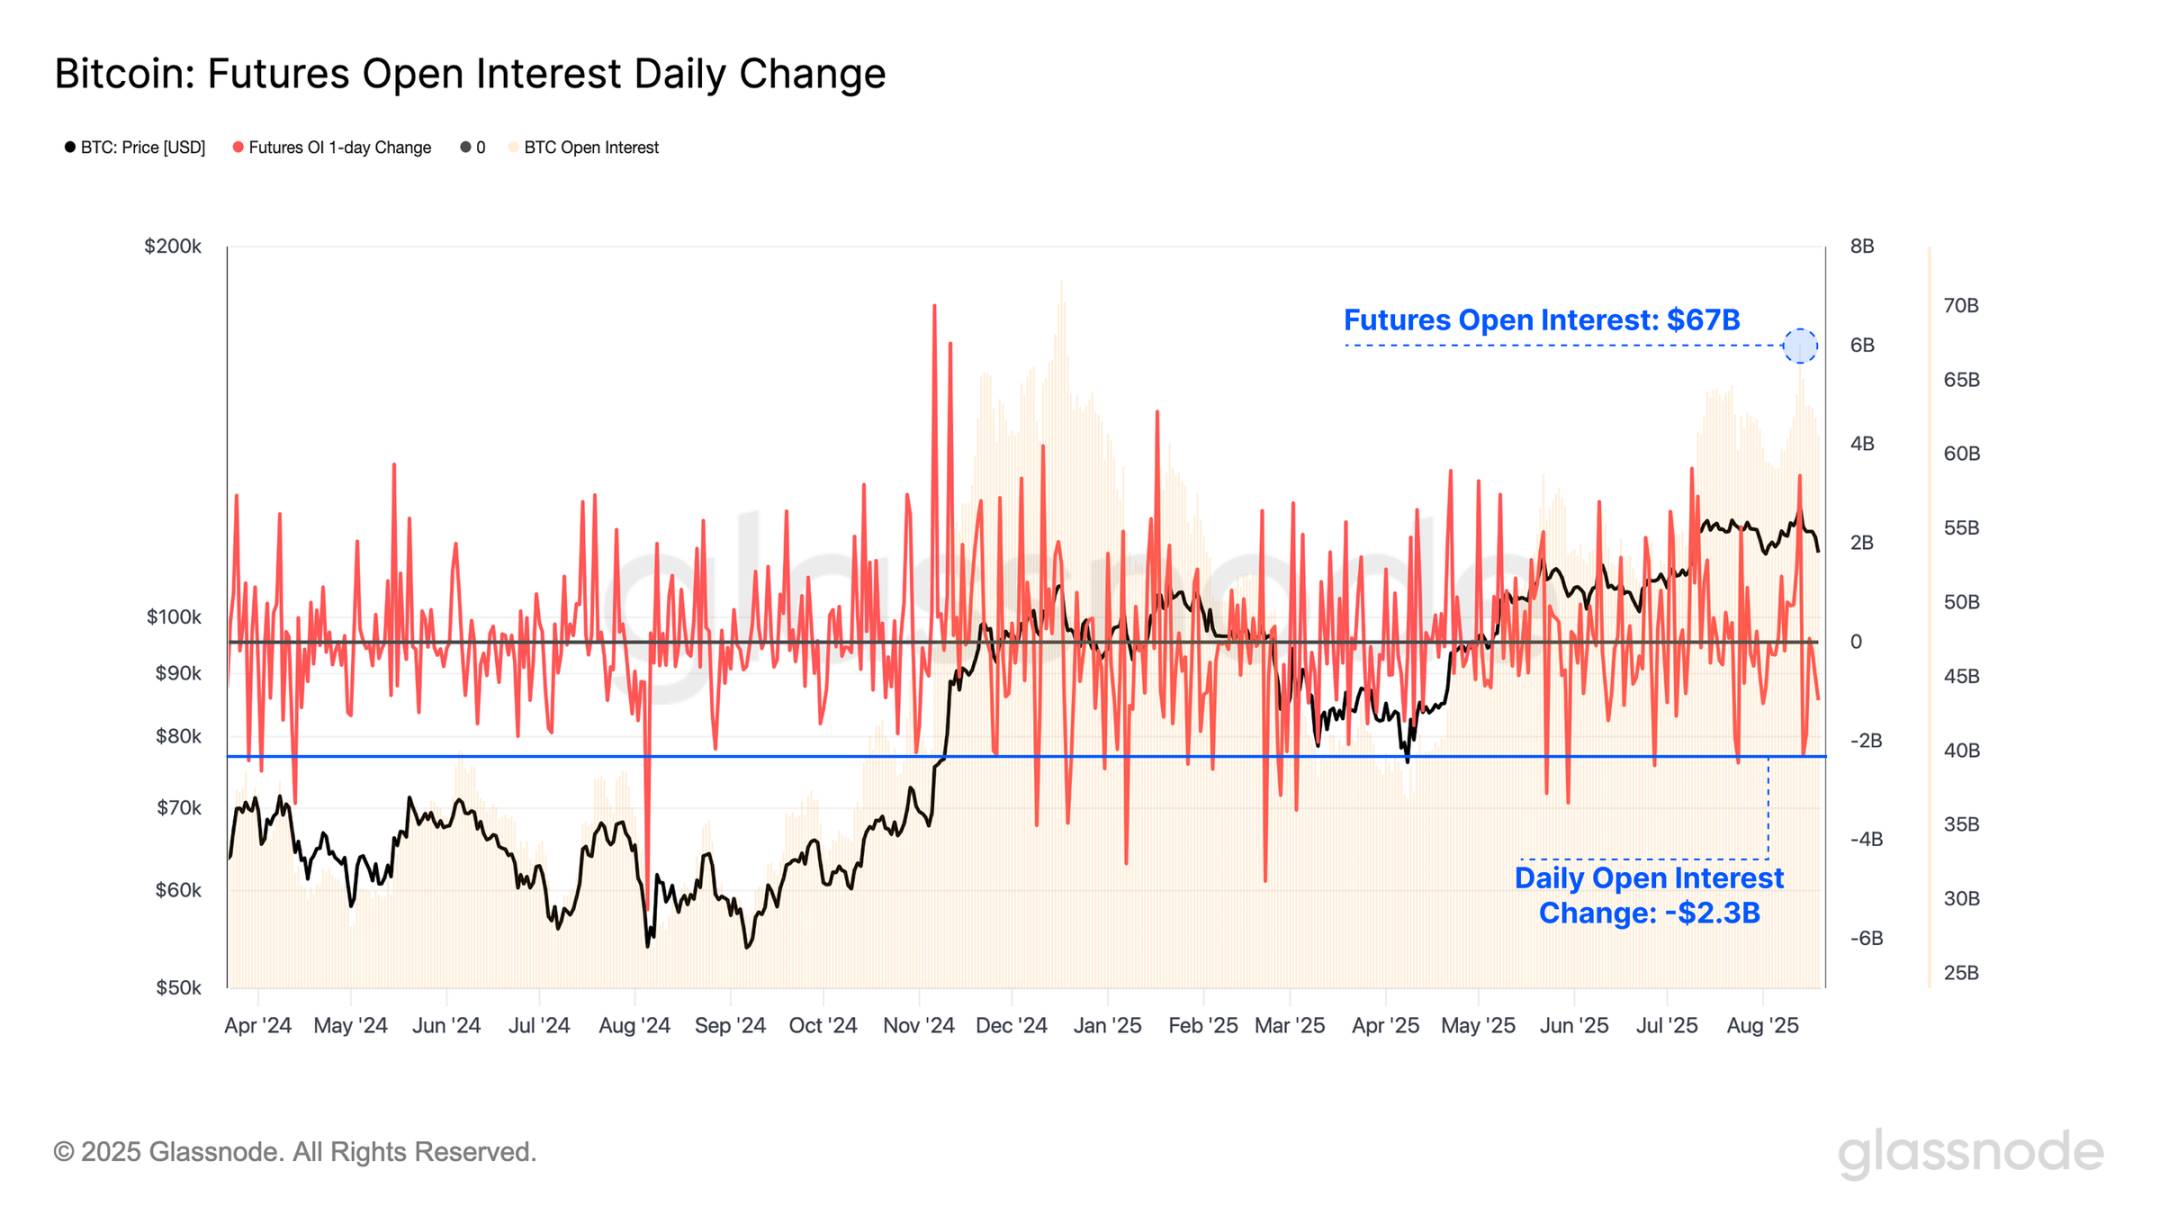
While on-chain profit and loss realization remained relatively muted during the recent formation of the all-time high and subsequent correction, futures market activity accelerated. The total open interest in Bitcoin futures contracts remains elevated at $67 billion, highlighting the high degree of leverage currently present in the market.
Notably, over $2.3 billion in open interest was liquidated during the recent sell-off, a nominal drawdown exceeded by only 23 trading days on record. This underscores the speculative nature of the market, where even modest price moves can trigger significant contractions in leveraged positions.
Live chart
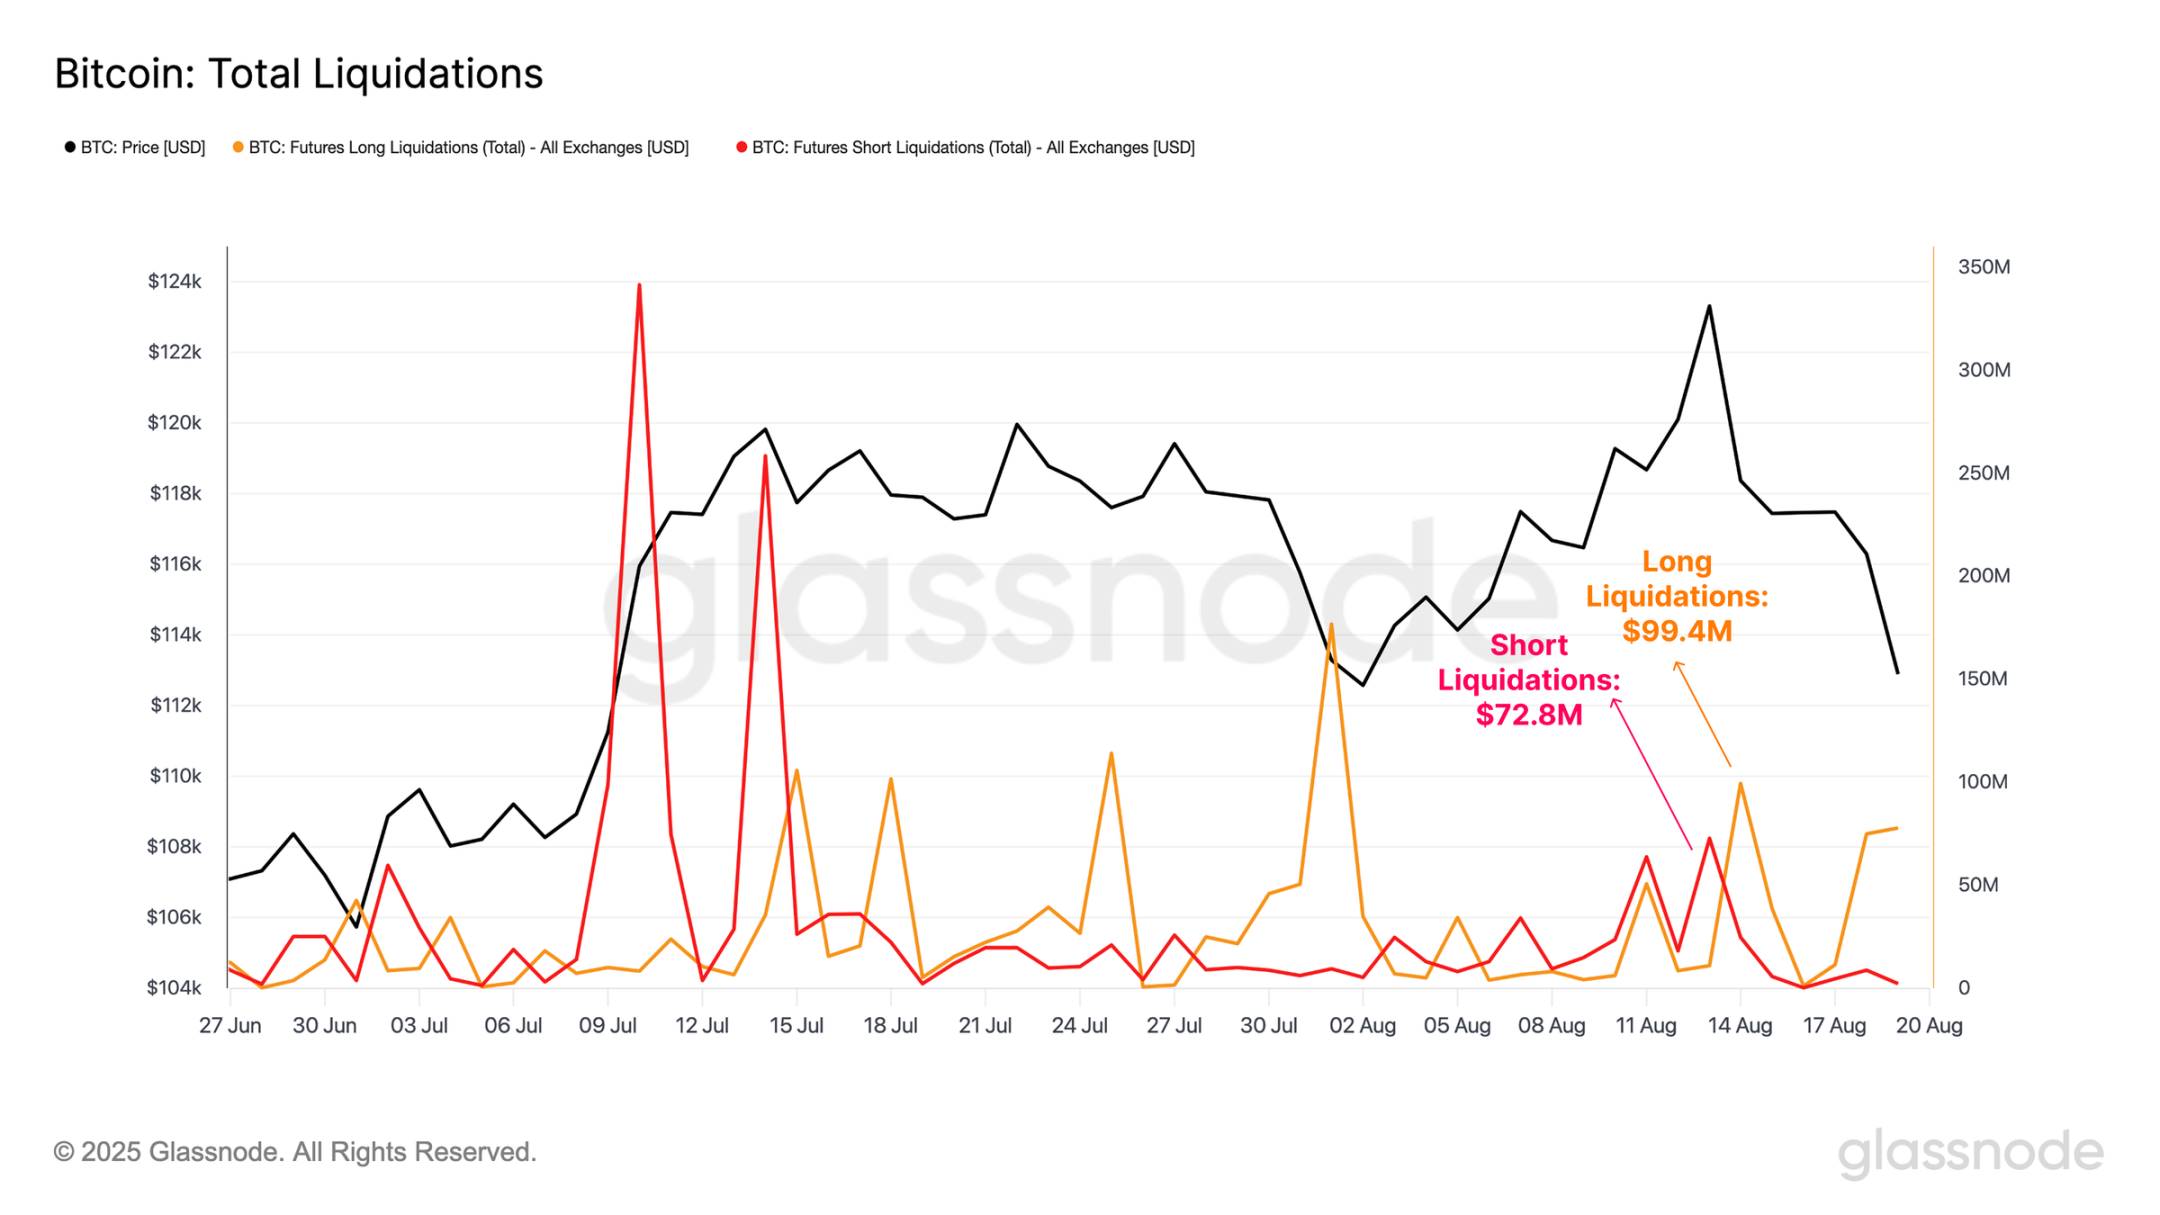
Diving deeper, we can assess the total scale of long and short liquidations during the formation of the all-time high and the subsequent price contraction.
Although liquidation volumes did rise during these events—with short liquidations peaking at $74 million during the ATH and long liquidations reaching $99 million during the downtrend—these levels are notably below those seen during similarly volatile price movements earlier this year. This suggests a significant portion of recent position closures may have been voluntary and risk-managed, rather than forced liquidations driven by excessive leverage.
Live chart
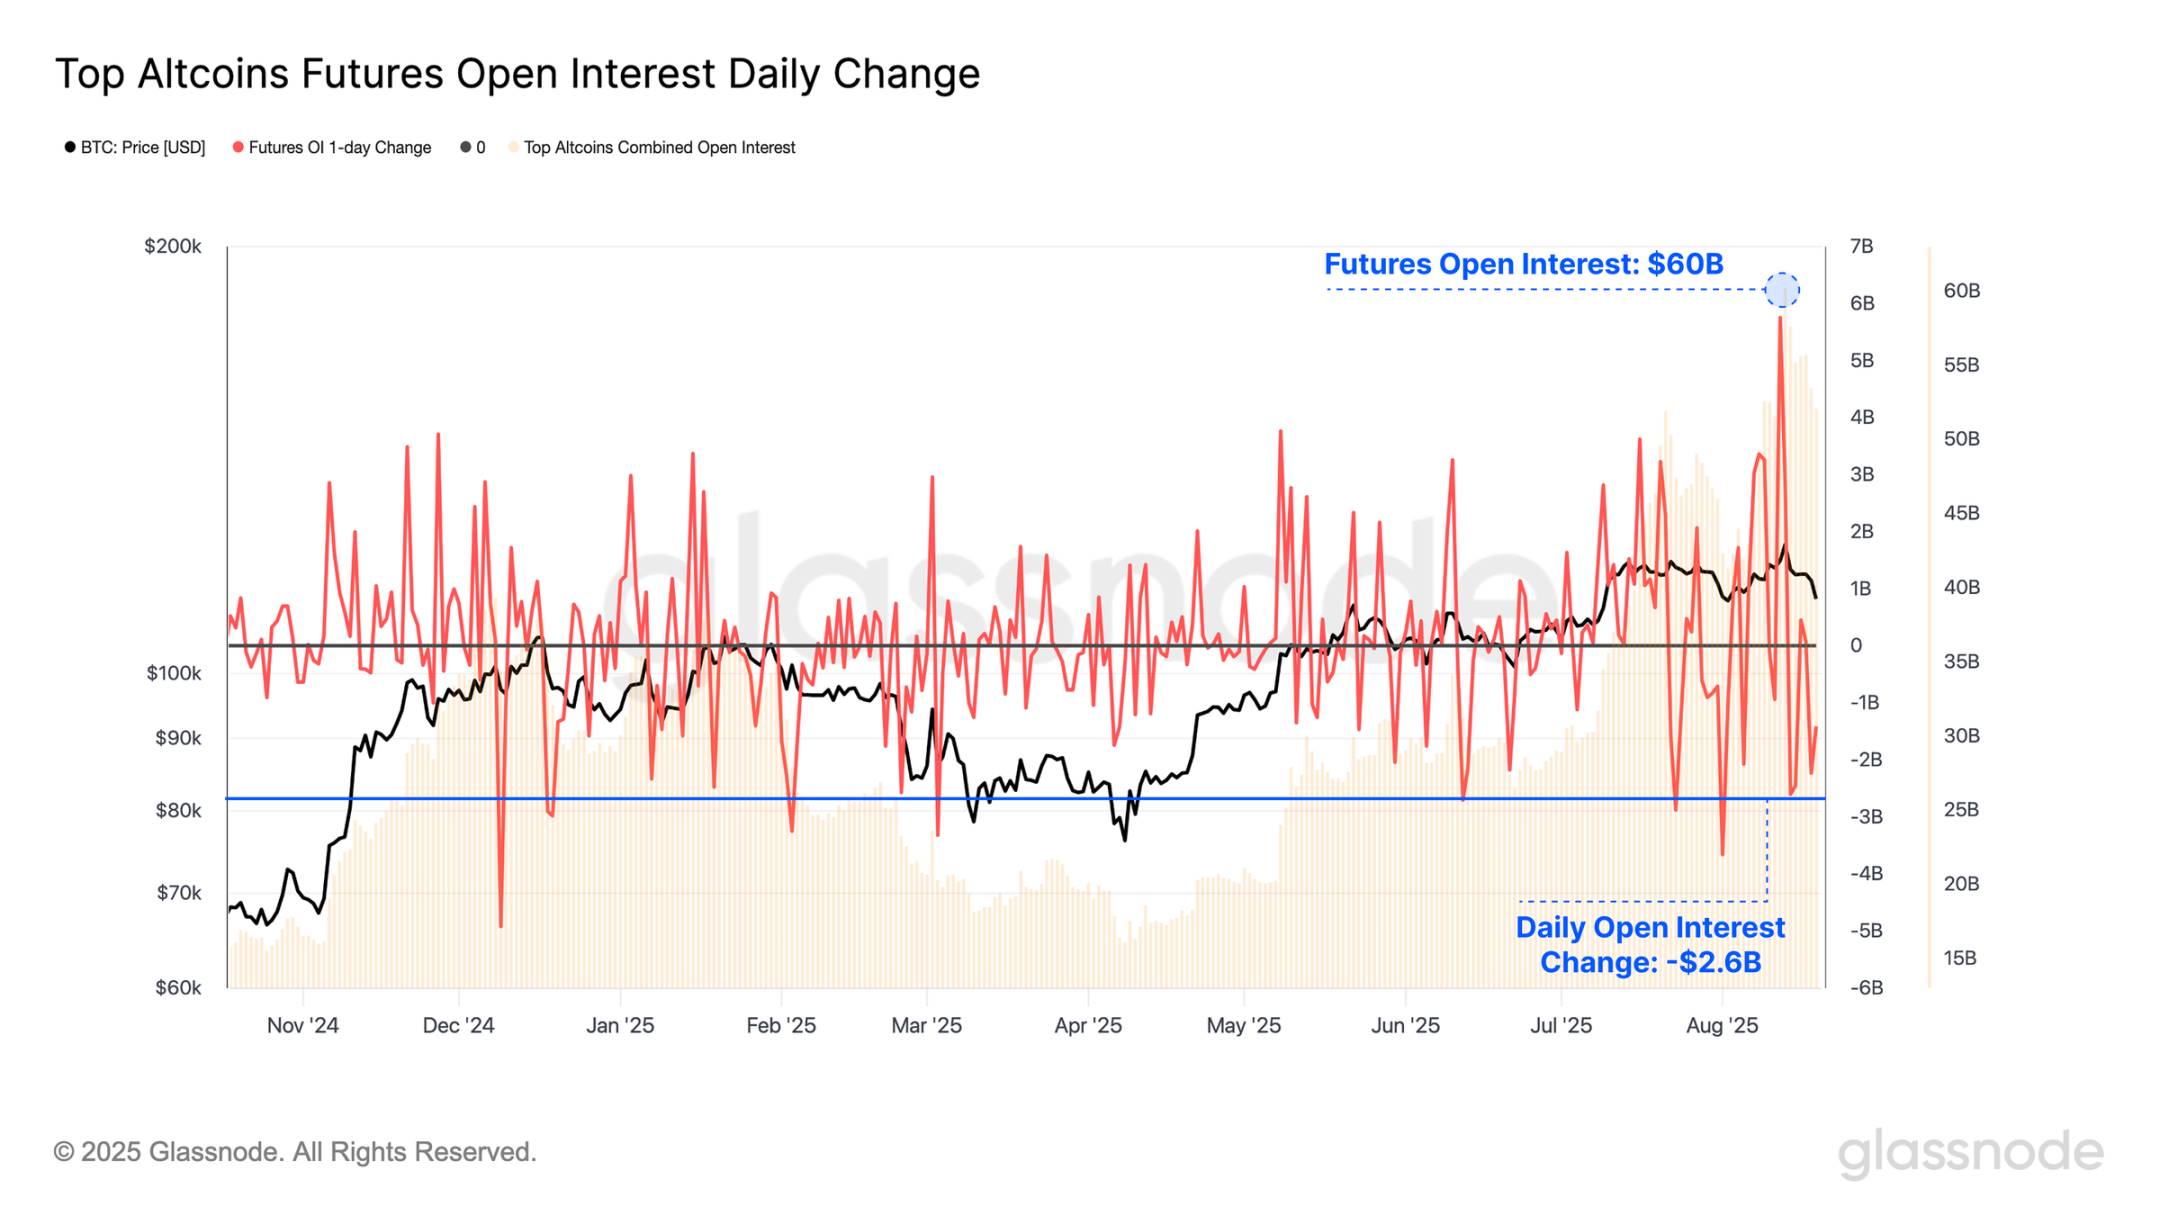
When assessing futures open interest in major altcoins (ETH, SOL, XRP, DOGE), we note their combined total surged to a new all-time high of $60.2 billion last weekend—nearly matching Bitcoin’s contract open interest. However, this condition was fleeting; following the price correction, open interest dropped by $2.6 billion, marking the tenth-largest decline on record.
These rapid fluctuations indicate that altcoins are currently attracting significant investor attention, substantially amplifying reflexivity and fragility across the digital asset market.
Live chart
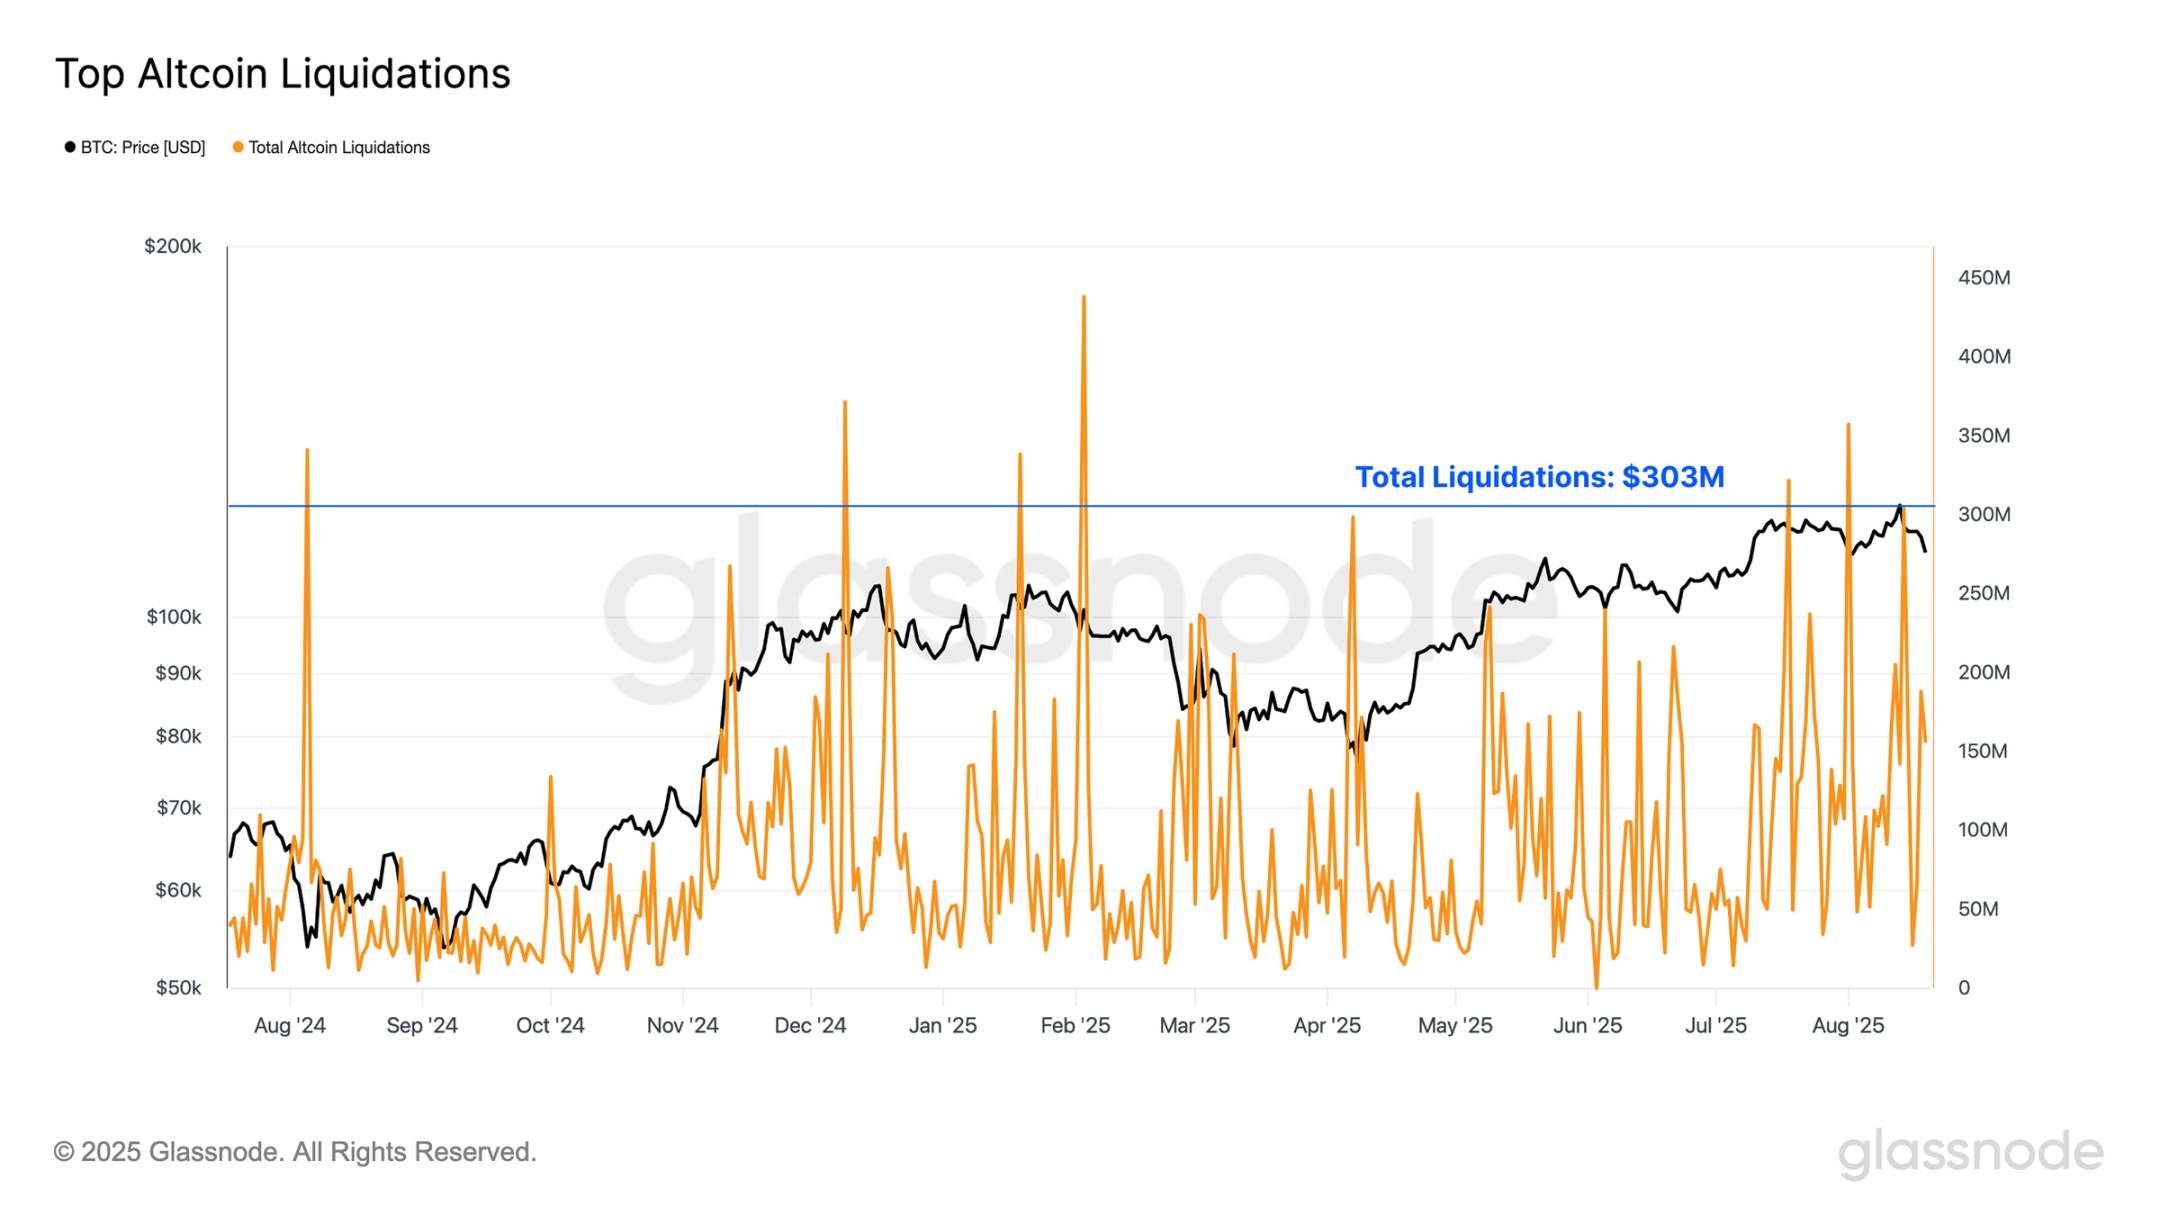
Furthermore, total liquidations in major altcoins have recently been quite high, peaking at $303 million per day—more than double the volume seen in Bitcoin futures markets.
In addition, last weekend’s liquidation size now ranks as the 15th largest on record, reflecting increased willingness to take leveraged exposure in the altcoin space.
Live chart
Escalating Speculation
For years, Ethereum has typically been viewed as a bellwether asset, with periods of strong performance often coinciding with broader "altseason" phases in the digital asset market.
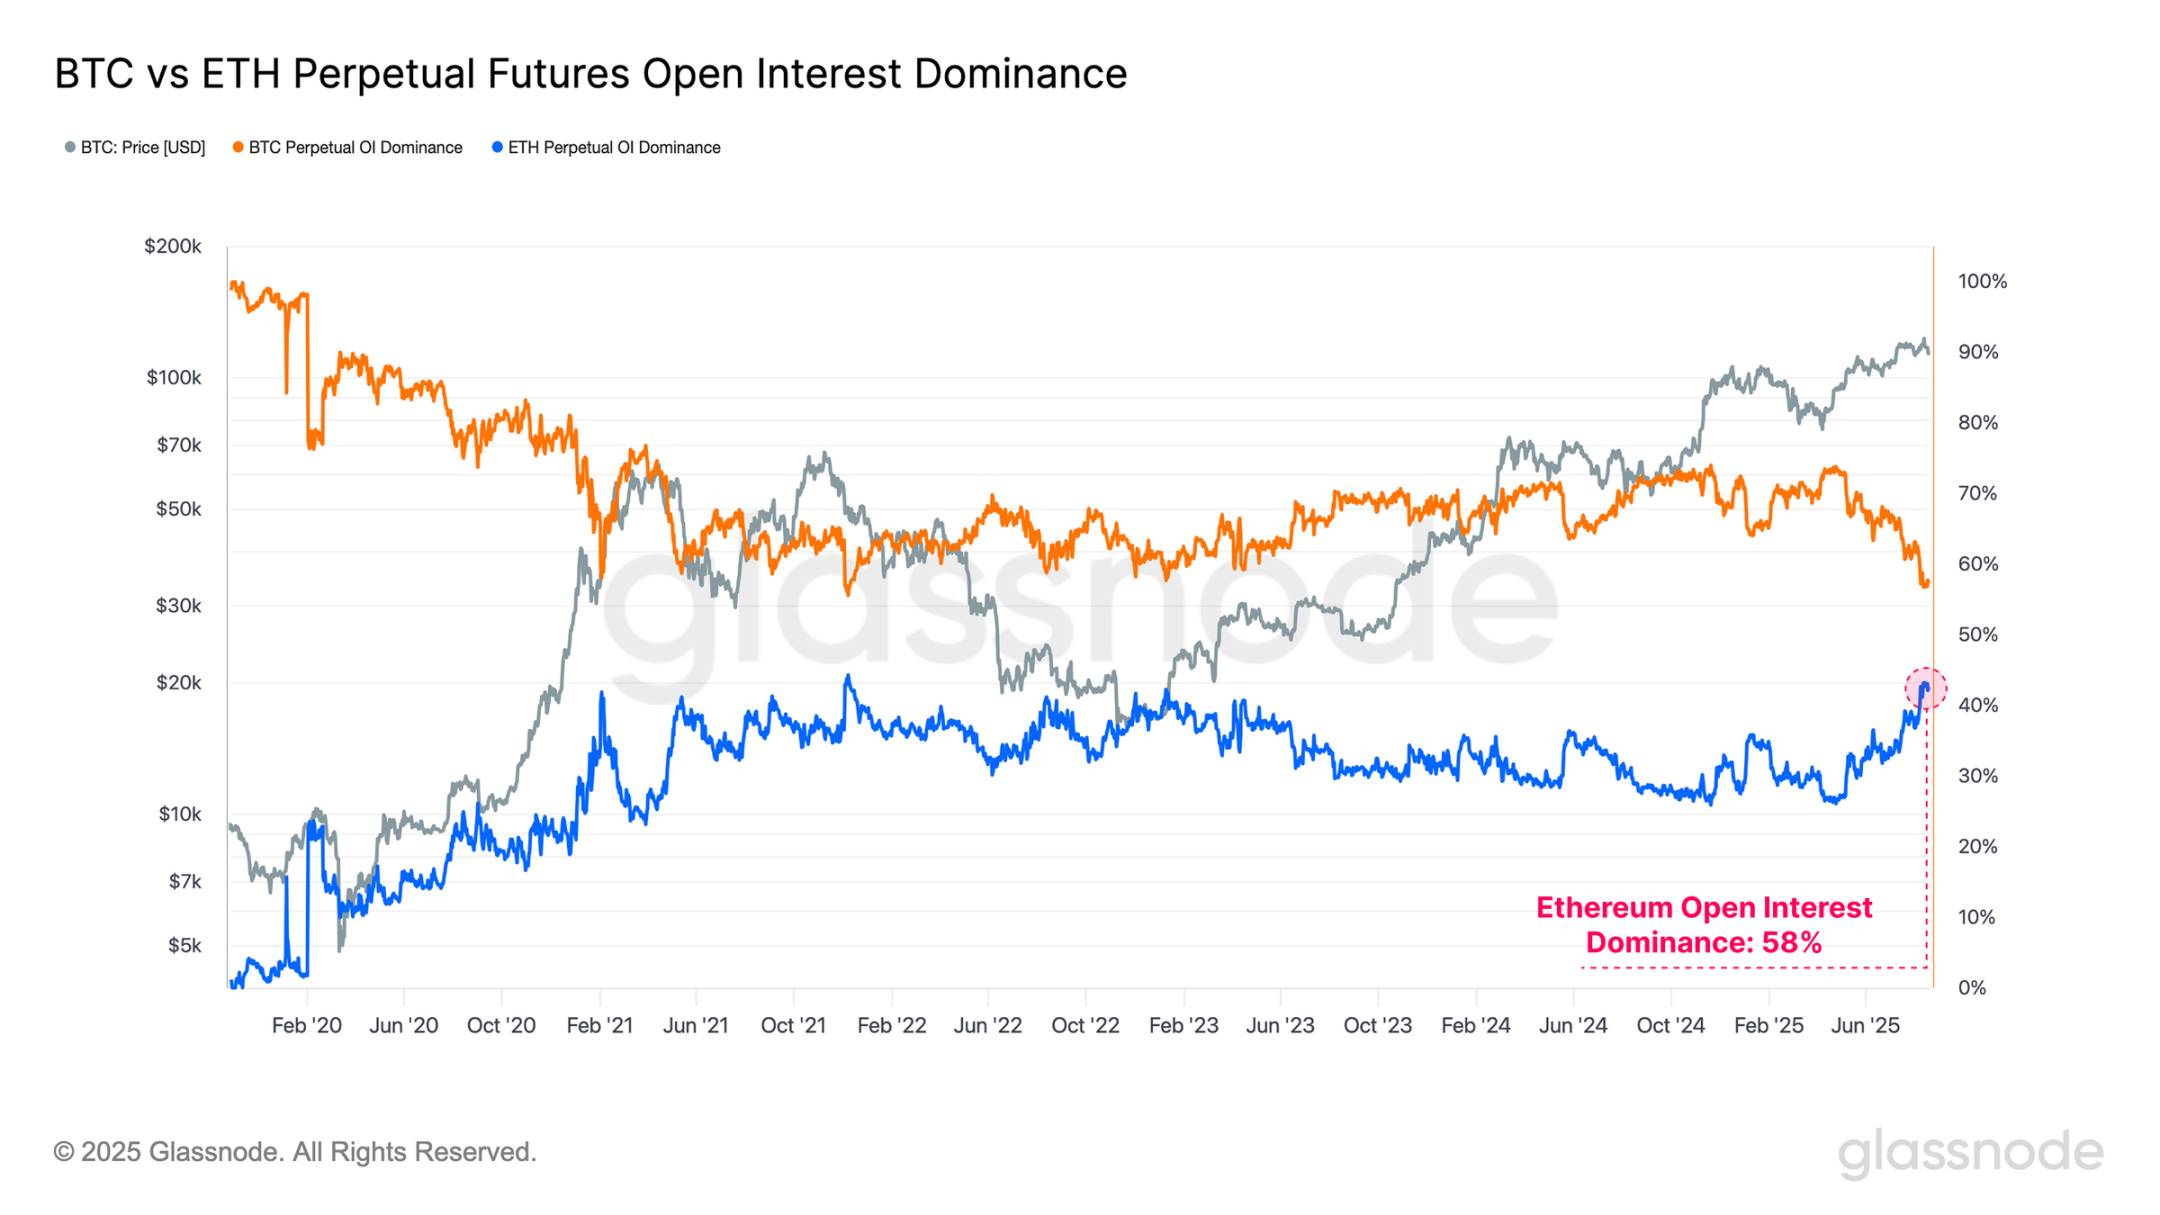
This relationship can also be observed through open interest dominance between Bitcoin and Ethereum, reflecting shifts in market participants’ risk appetite. Currently:
-
Bitcoin open interest dominance: 56.7%
-
Ethereum open interest dominance: 43.3%
Ethereum’s share of open interest has been rapidly climbing recently, indicating a marked shift in market focus toward riskier segments of the spectrum. Notably, Ethereum’s open interest dominance has reached its fourth-highest level on record, highlighting a significant increase in speculative activity. Importantly, as the second-largest digital asset, Ethereum is one of the few assets capable of absorbing institutional-scale capital.
Live chart
When viewed through the lens of trading volume, this trend becomes even more striking. Ethereum’s perpetual futures trading volume dominance has surged to a new all-time high of 67%, the strongest shift ever recorded.
This dramatic rotation in trading activity reflects growing investor focus on the altcoin space and points to an acceleration in risk appetite within the current market cycle.
Live chart
At a Crossroads
When observing Bitcoin’s performance from each cycle low, we see that in both the 2015–2018 and 2018–2022 cycles, the time to reach the all-time high—on a relative timeline—was approximately 2–3 months later than where we currently stand in the present cycle.
While this represents only two prior examples before full maturity, and thus insufficient to assume such synchronicity will persist, it remains a noteworthy data point. This perspective is particularly relevant when considering the waves of on-chain profit-taking over the past two years and the visible surge in speculative activity in today’s derivatives markets.
Live chart
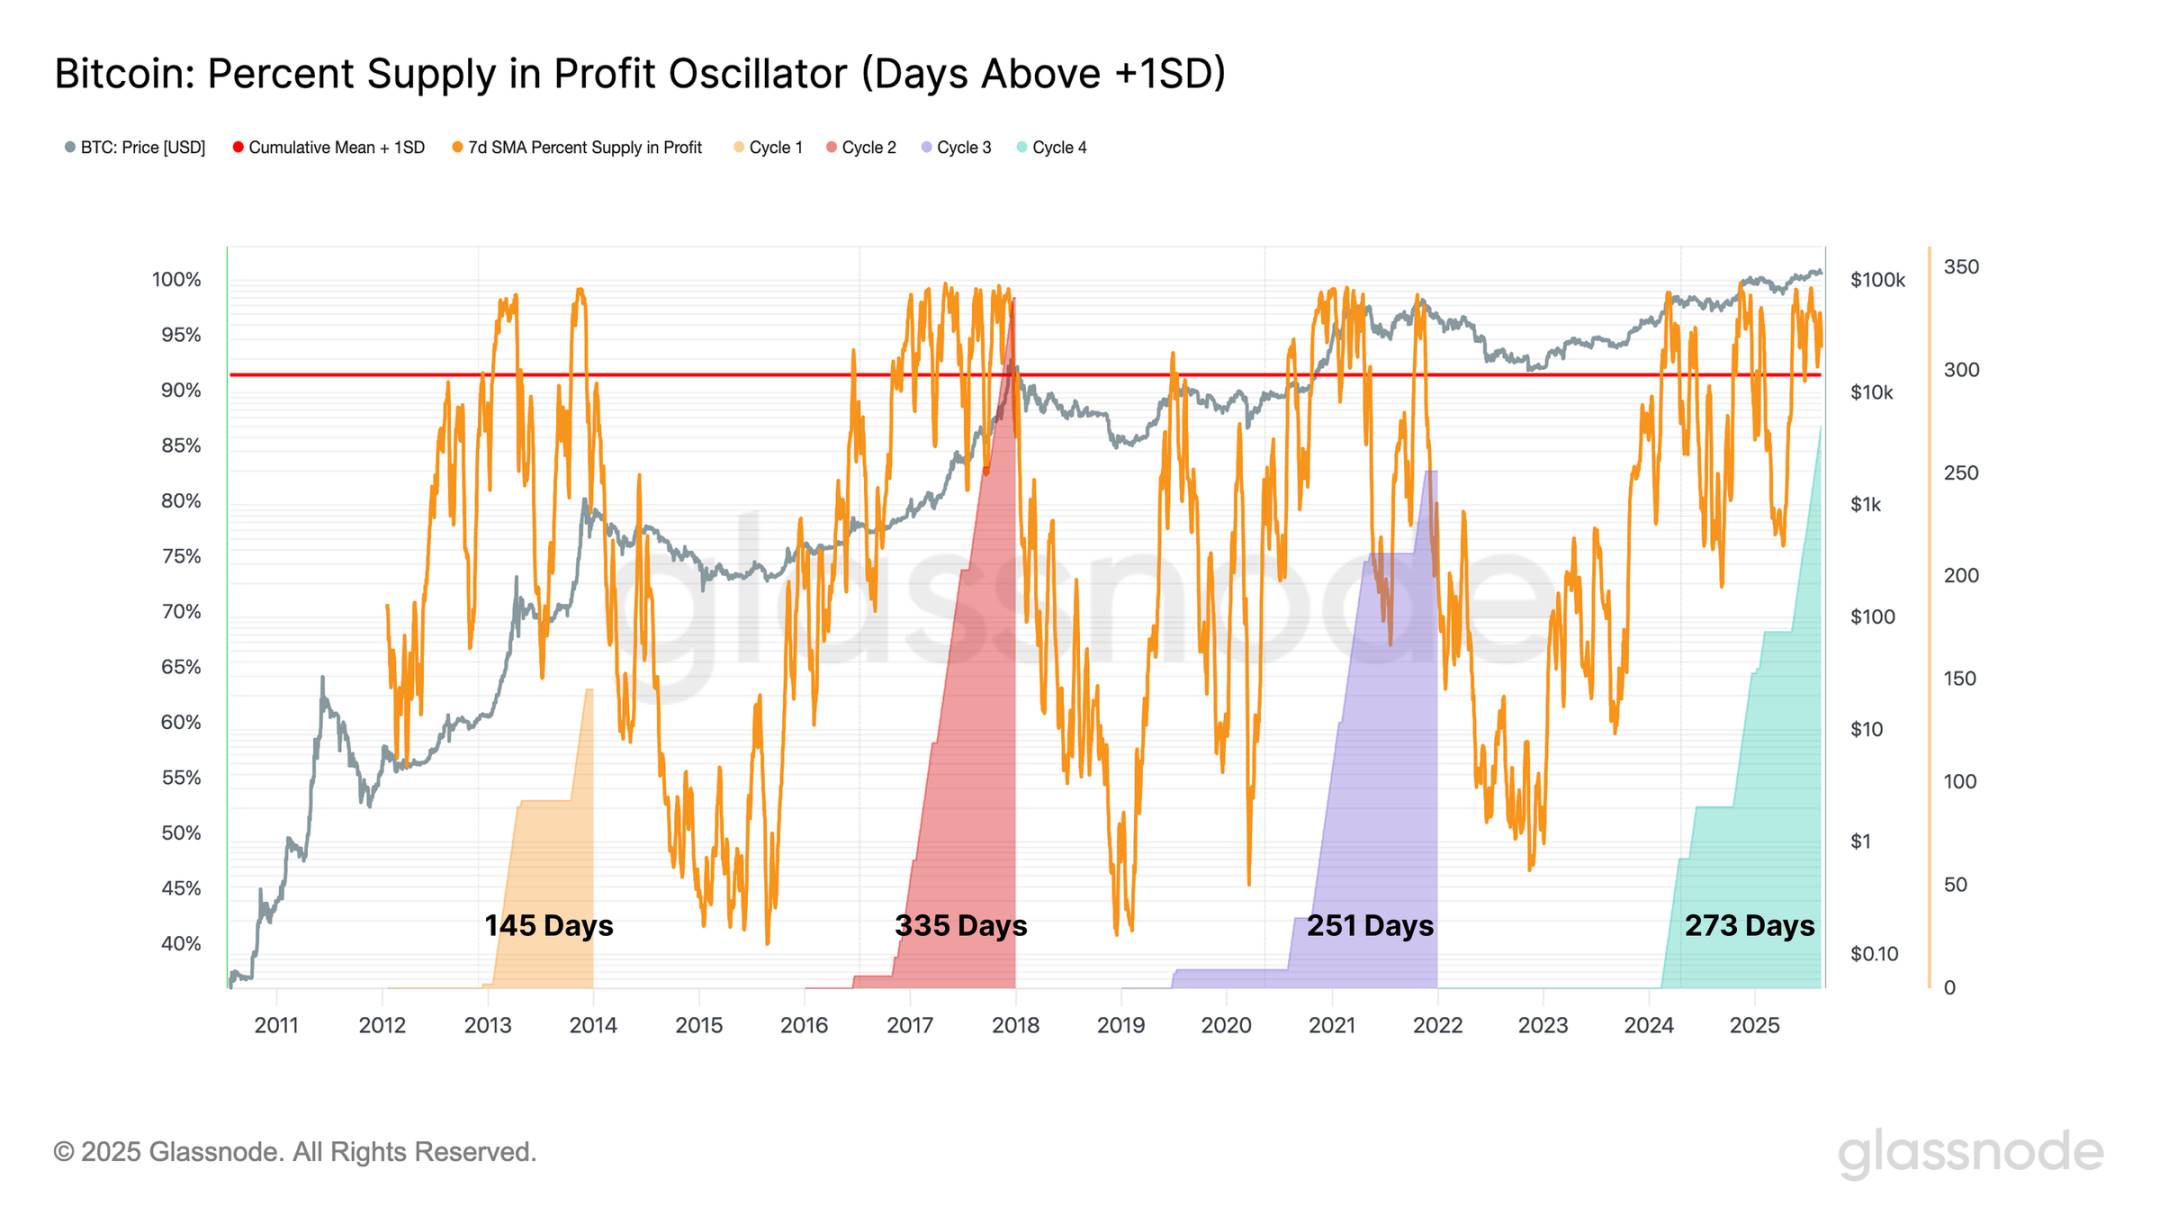
To further support this observation, we can examine the duration—during each cycle—that the percentage of Bitcoin’s circulating supply remains above the +1 standard deviation band.
In the current cycle, this period has now extended to 273 days, making it the second-longest on record, behind only the 335-day stretch in the 2015–2018 cycle. This indicates that, when measured by the duration of the majority of supply being in profit, the current cycle is comparable in length to prior cycles.
Live chart
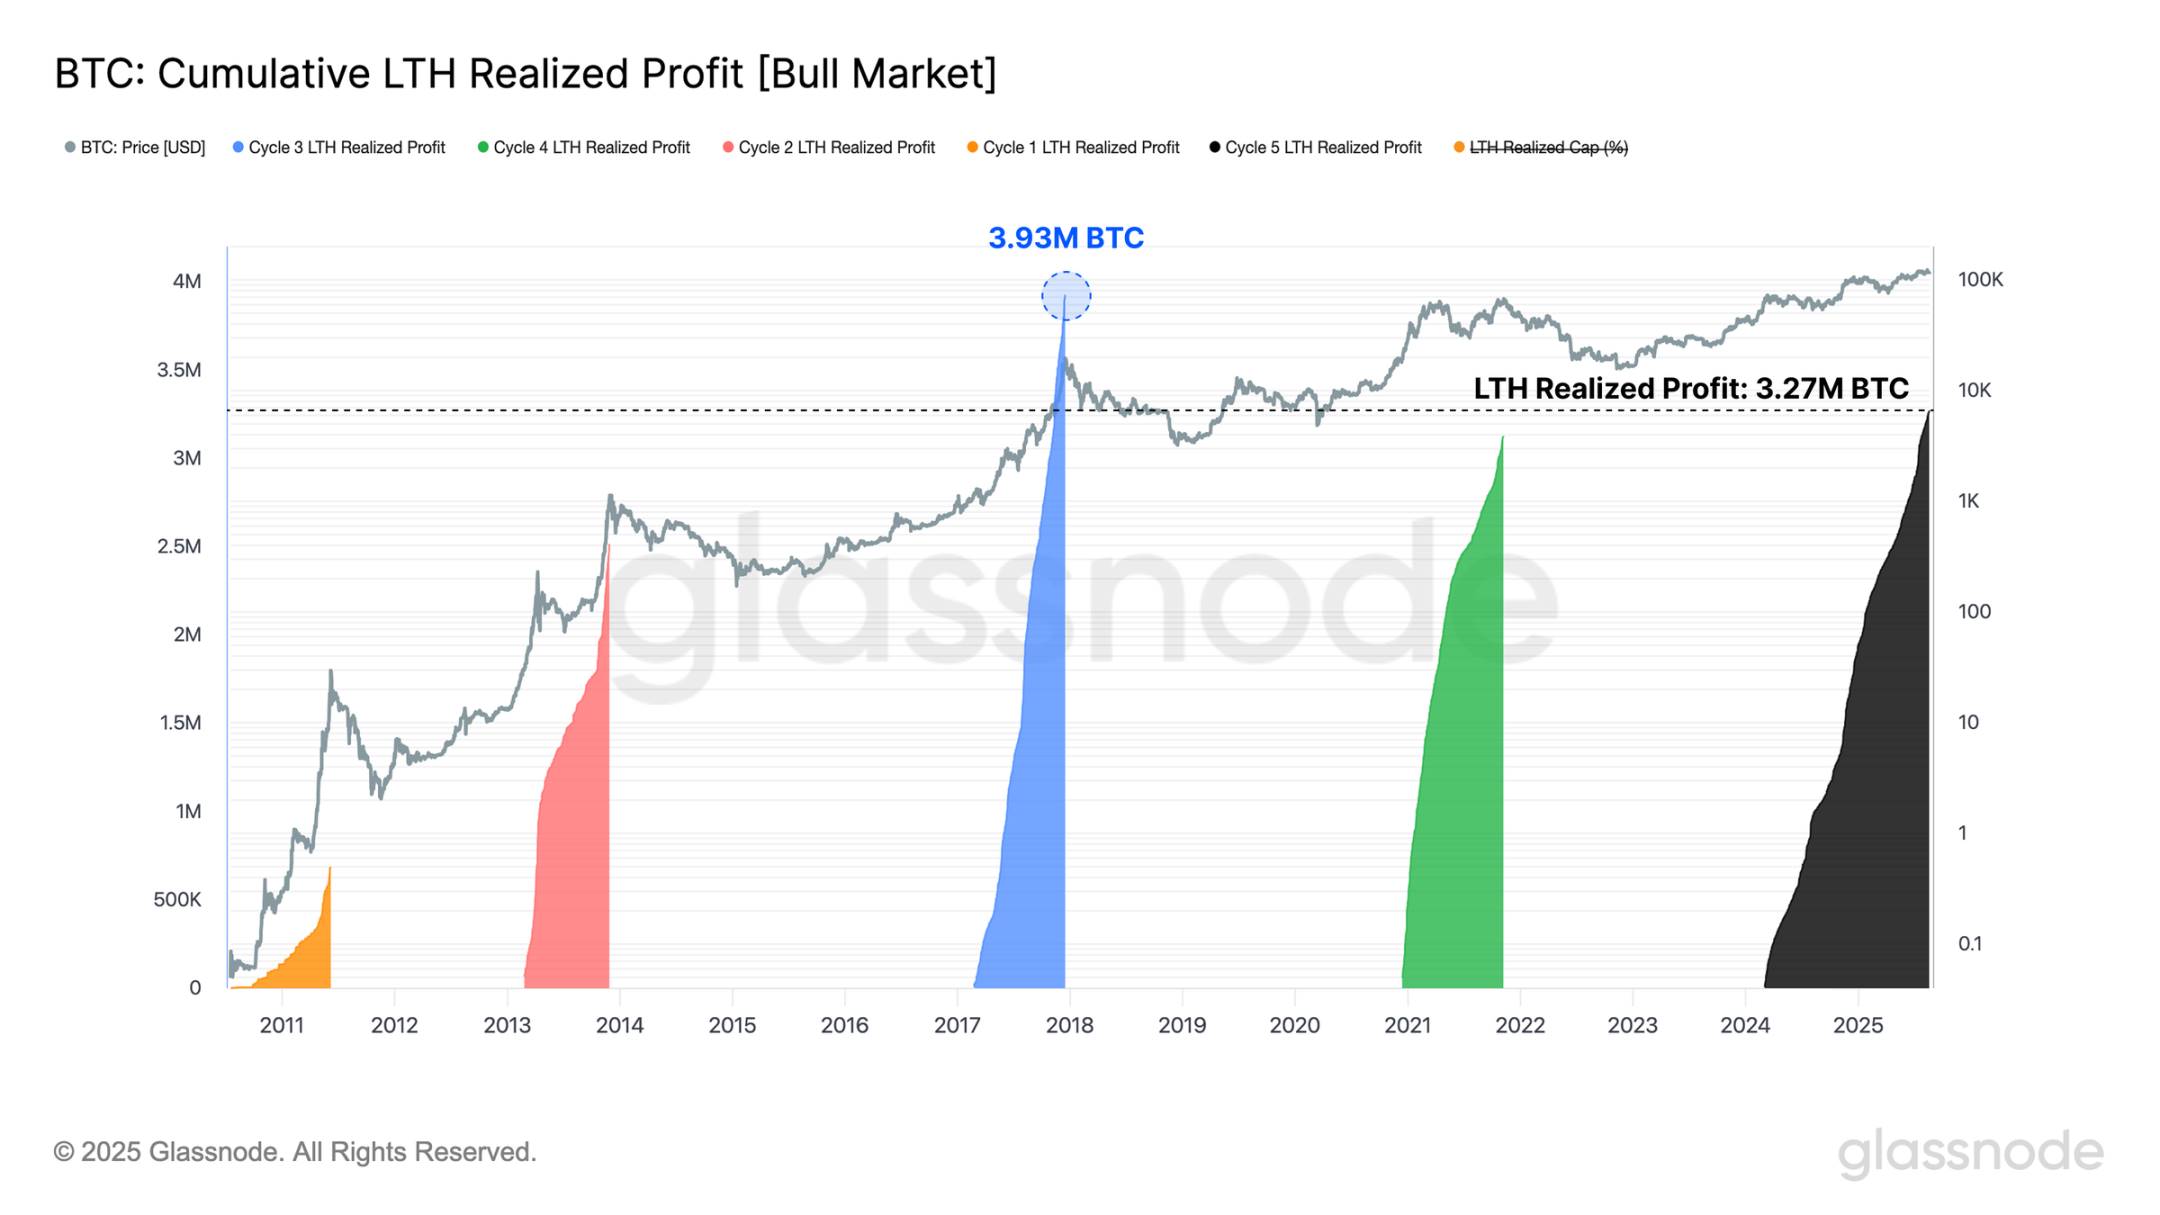
We can also measure the cumulative profit realized by long-term holders from the point of reaching a new cycle all-time high to the final peak of the cycle. From this perspective, we find that the long-term holder cohort—typically most active at cycle extremes—has already realized more profit than in all prior cycles except one (the 2016–2017 cycle).
This observation aligns with previous indicators, adding another dimension through the lens of seller pressure. Collectively, these signals reinforce the view that the current cycle is in its latter stages.
However, each cycle has its own unique characteristics, and there is no guarantee that market behavior will follow a fixed temporal pattern.
Nonetheless, these dynamics raise an interesting question. Is the traditional four-year cycle still valid, or are we witnessing its evolution? These questions will be answered in the coming months.
Live chart
Conclusion
Bitcoin’s capital inflows show signs of weakness, with declining demand even as price hits a new all-time high of $124,400. This waning appetite coincides with a surge in speculative positioning, as total open interest in major altcoins briefly reached a record $60 billion before correcting with a $2.5 billion reduction.
Ethereum, long regarded as the bellwether for "altseason," is once again at the forefront of this rotation. Its open interest dominance has climbed to the fourth-highest level on record, while perpetual futures trading volume dominance has surged to a new all-time high of 67%, marking the strongest structural shift seen to date.
Cyclically, Bitcoin’s price trajectory echoes prior patterns. In both the 2015–2018 and 2018–2022 cycles, the time from cycle low to all-time high was just 2–3 months later than our current position. Meanwhile, profit realization by long-term holders has reached levels comparable to past market euphoria phases, reinforcing the impression of a mature cycle.
Collectively, these signals highlight rising leverage, profit-taking, and intensified speculation—hallmarks of historically mature market phases. Yet, each cycle is unique, and there is no certainty that Bitcoin and the broader market will adhere to a fixed chronological blueprint.
Join TechFlow official community to stay tuned
Telegram:https://t.me/TechFlowDaily
X (Twitter):https://x.com/TechFlowPost
X (Twitter) EN:https://x.com/BlockFlow_News
 @glassnode