A 12-year historical overview of Bitcoin's market share evolution
TechFlow Selected TechFlow Selected
A 12-year historical overview of Bitcoin's market share evolution
Bitcoin has dominated the crypto market for 8 years and is currently hovering around the 12-year average market share.
 Navigating Web3 tides with focused insights
Author: Coingecko
Translation: Felix, PANews
This study examines Bitcoin's daily market dominance from April 29, 2013, to July 22, 2025, with data sourced from CoinGecko.
How Has Bitcoin’s Market Dominance Evolved Over the Years?
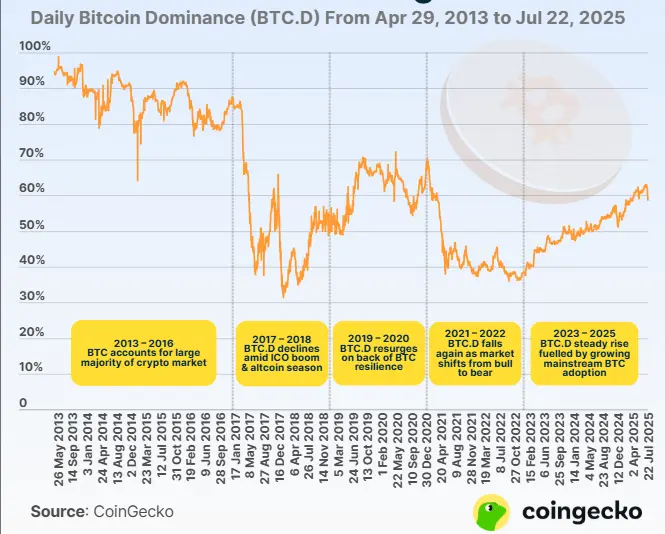
Over these 12 years from 2013 to 2025, Bitcoin's market share in the cryptocurrency market has fluctuated significantly, ranging between a historical low of 31.1% and an early high of 99.1%. During this period, Bitcoin maintained a daily market dominance at or above 50.0% for two-thirds of the time. In other words, Bitcoin dominated the crypto market for approximately eight out of these twelve years.
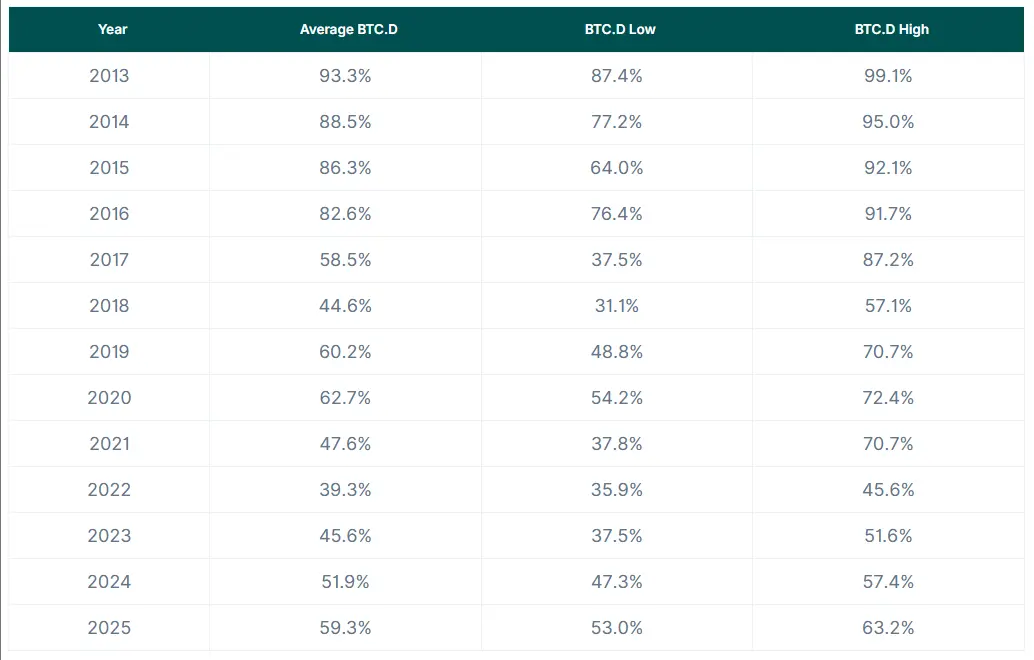
On an annual basis, Bitcoin’s average daily market dominance declined for five consecutive years, falling from 93.3% in 2013 to 44.6% in 2018. It rebounded to 60.2% in 2019 and 62.7% in 2020, before declining again to 47.6% in 2021 and 39.3% in 2022.
Since 2023, Bitcoin’s market dominance has steadily increased, with annual averages rising to 45.6% in 2023, 51.9% in 2024, and reaching 59.3% year-to-date in 2025. This means that Bitcoin’s current market dominance is hovering around the 12-year daily average of 62.5%.
Bitcoin’s market dominance is currently hovering around the 12-year average of 62.5%
Data Period: April 29, 2013 – July 22, 2025
Key Levels of Bitcoin’s Market Dominance
Since February 2016, Bitcoin’s market dominance has remained well below 90%, reflecting a turning point toward market maturity following the 2017 ICO boom and the first altcoin bull run, during which the number and market capitalization of major altcoins grew substantially.
Likewise, after barely recording 70.7% on January 3, 2021, Bitcoin’s market dominance declined and has remained below 70% ever since. This means that over the past 12 years, Bitcoin’s daily market dominance reached 70% or higher only one-third of the time. Whether Bitcoin’s dominance will surpass the 70.0% threshold again remains to be seen.
Notably, on April 7, 2025, Bitcoin’s market dominance rose to 60.5%, marking the first time in over four years it crossed the 60% threshold. The last time Bitcoin exceeded this level was on March 15, 2021, when it reached 60.6%. Over the past 12 years, Bitcoin’s market dominance has spent more than half its time below 60.0%.
Historical Development of Bitcoin’s Market Dominance (2013–2025)
The annual averages, lows, and highs of Bitcoin’s market dominance from 2013 to 2025 are shown below.
2013 to 2016: Bitcoin Monopolizes the Cryptocurrency Market
Between 2013 and 2016, Bitcoin dominated the cryptocurrency market, with its daily average market share ranging annually between 82.6% and 93.3%. During this nascent period, despite price corrections and the U.S.’s first major regulatory action against Mt. Gox—the leading Bitcoin exchange at the time—Bitcoin reached its peak market dominance of 99.1% on May 29, 2013.
Although Bitcoin held the vast majority of market share during this time, it experienced three of its largest swings in dominance:
-
On March 29, 2014, Bitcoin’s market dominance dropped 10.9 percentage points from 89.6% to 78.7%, following the collapse of Mt. Gox and attributable to a sharp rise and subsequent correction in total crypto market capitalization.
-
On January 15, 2015, Bitcoin’s dominance plunged 16.2 percentage points from 80.2% to 64.0%, driven by a price drop from $221 to $172 the previous day, marking the bear market bottom after a hack on the centralized exchange Bitstamp.
-
On January 16, 2015, Bitcoin’s dominance rebounded to 80.7%, up 16.7 percentage points from the prior day, as its price recovered to $211.
2017 to 2018: ICOs and Altcoins Outshine Bitcoin
In the next two years, Bitcoin’s market dominance continued to decline, dropping below the 80% and then 70% thresholds during the 2017 ICO-driven altcoin bull run and the 2018 bear market. On May 16, 2017, Bitcoin fell below 50% for the first time, reaching 48.5%. Notably, on January 16, 2018, Bitcoin’s market dominance hit a historic low of 31.1%, as its price plummeted from $14,412 to $11,724.
Over the past 12 years, Bitcoin’s market dominance saw its greatest volatility in 2017, starting the year at 87.2% and shrinking by more than half to 37.6% by June 19. In the second half, dominance briefly rose before falling again to a yearly low of 37.5%, then rebounding to 66% on December 7, ultimately closing the year at 38.9%.
In contrast, Bitcoin’s market dominance showed an overall upward trend in 2018, increasing from 37.4% at the beginning of the year to 52% by year-end.
2019 to 2020: Bitcoin Regains Dominance Ahead of the Third Halving
In 2019 and 2020, Bitcoin reestablished dominance in the cryptocurrency market, maintaining a share between 48.8% and 72.5%. This resurgence was driven by multiple factors: anticipation of Bitcoin’s third halving in May 2020, investor rotation back into quality assets post-ICO boom, early institutional interest in Bitcoin as “digital gold,” and Bitcoin’s role as an entry point during the 2020 “DeFi summer.”
2021 to 2022: Altcoins Reassert Influence
During the 2021 bull market and the pandemic-triggered crash in 2022, Bitcoin’s market dominance declined by 30.9 percentage points, from 69.5% to 38.6%. Over these two years, as altcoins gained traction and began exerting greater influence in the crypto market, Bitcoin’s share continued to erode.
During this period, Bitcoin’s market share was below 50% on 8 out of every 10 days—specifically, on 624 out of 730 days.
Specifically, in 2021, despite Bitcoin’s price rising from $29,022 to a new all-time high and closing the year at $47,192—an increase of 62.6%—its market dominance fell from 69.5% at the start of the year to 38.2% by year-end. In contrast, the total crypto market cap outperformed Bitcoin during the same period, surging from $776.4 billion to $2.3 trillion, a 200.6% gain.
In 2022, Bitcoin’s market dominance started at 37.9% and ended at 38.6%, as its price dropped 64.2%, closely mirroring the broader crypto market’s 64.1% decline. In other words, Bitcoin was directly impacted by the collapses of Terra-Luna and FTX, prompting investors to flee into fiat currencies for risk mitigation.
2023 to 2025: Bitcoin Goes Mainstream
Over the past three years, Bitcoin’s market dominance has risen steadily, climbing from 38.4% at the beginning of 2023 to 58.5% year-to-date in 2025. This resurgence reflects structural shifts in the crypto market, driven by the approval of spot Bitcoin ETFs in the U.S. in January 2024 and increasing regulatory clarity following the FTX collapse, leading to mainstream recognition and institutional adoption of Bitcoin.
Notably, Bitcoin’s market dominance has become increasingly stable, with smaller fluctuations ranging between -1.2 and +1.6 percentage points. By comparison, from 2013 to 2016, Bitcoin’s dominance swung between -16.2 and +1.6 percentage points, while from 2017 to 2022, the range was -8.8 to +7.0 percentage points.
Join TechFlow official community to stay tuned
Telegram:https://t.me/TechFlowDaily
X (Twitter):https://x.com/TechFlowPost
X (Twitter) EN:https://x.com/BlockFlow_News
 CoinGecko