Cycle Capital Research: Exploring the Relationship Between BTC and the Nasdaq Index
TechFlow Selected TechFlow Selected
Cycle Capital Research: Exploring the Relationship Between BTC and the Nasdaq Index
This article attempts to explore the strength and changes in correlation between the current bull market and the previous one across different time dimensions through a review of both cycles.
 Navigating Web3 tides with focused insights
Author: Lisa, LD Capital
Recently, BTC has diverged from the Nasdaq Index—the Nasdaq keeps hitting new highs while BTC declines, dragging down the overall crypto market significantly. This contradicts the conventional perception of a positive correlation between the Nasdaq and BTC. What's behind this phenomenon? Have similar situations occurred in history? This article explores the strength and evolution of their correlation across different timeframes by reviewing the current and previous bull markets.
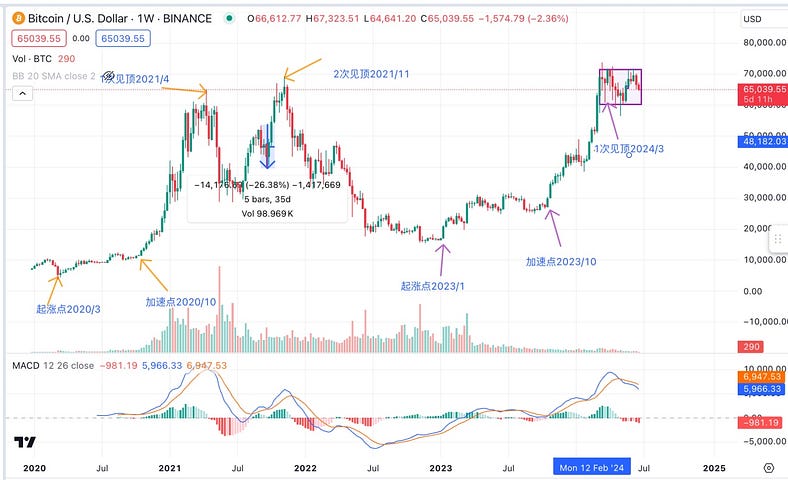
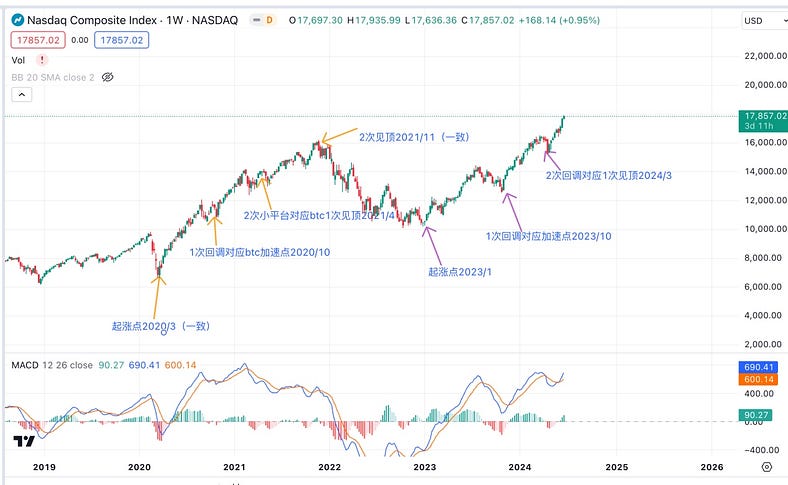
In fact, BTC does not maintain a fixed positive correlation with U.S. equities but exhibits varying degrees of correlation at different stages of the cycle. Reviewing the last bull market and the current one reveals several patterns:
1. The starting points and final peaks of both markets align perfectly in time
(Previous rally start: 2020/3 & Previous peak: 2021/11 & Current rally start: 2023/1)
2. Their price ascent processes differ
The Nasdaq rises steadily, appearing on charts as an almost linear trend with constant slope.
BTC, however, follows a more exponential growth pattern—rising slowly at first, then sharply accelerating after a certain point. Coincidentally, this acceleration ("inflection point") consistently occurs around the time when the Nasdaq stabilizes after its first pullback during the uptrend.
(2020/10 & 2023/10)
3. BTC’s first peak in each cycle corresponds to the second minor consolidation phase (pullback plateau) in the Nasdaq’s upward trajectory
(2021/4 & 2024/3)
Which historical phase does the current market correspond to? Is the present situation—U.S. stocks rising while BTC falls—precedented?
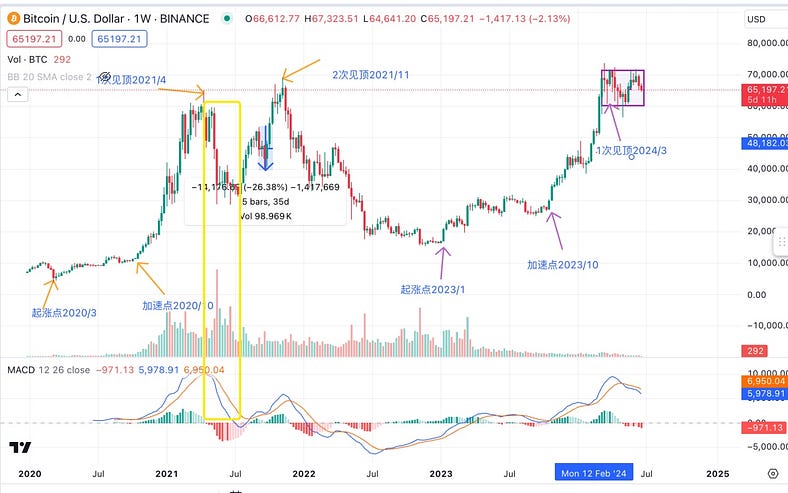
We can observe that for most of both bull cycles, BTC and U.S. equities remained positively correlated. Periods of negative correlation did occur but were not dominant. In the previous bull market, after BTC reached its first peak, the Nasdaq continued to rise while BTC corrected, creating a divergence (highlighted in yellow in the chart below)—a scenario similar to today’s market conditions. History is repeating itself once again.
What comes next? How long will the decoupling between BTC and the Nasdaq last, and how will it resolve? Let's examine this from two perspectives—timing and magnitude:
1. In the prior bull cycle, the divergence was relatively short-lived. On a weekly chart, it lasted about nine weeks before reverting back to positive correlation (on a weekly timeframe).
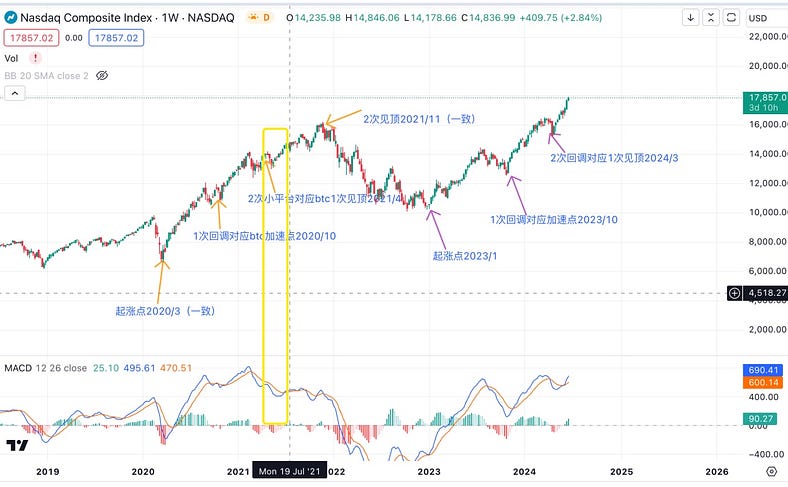
2. The re-synchronization of the two markets in the previous cycle occurred when BTC showed clear signs of weakening downward momentum on the daily chart and reached a key support level.
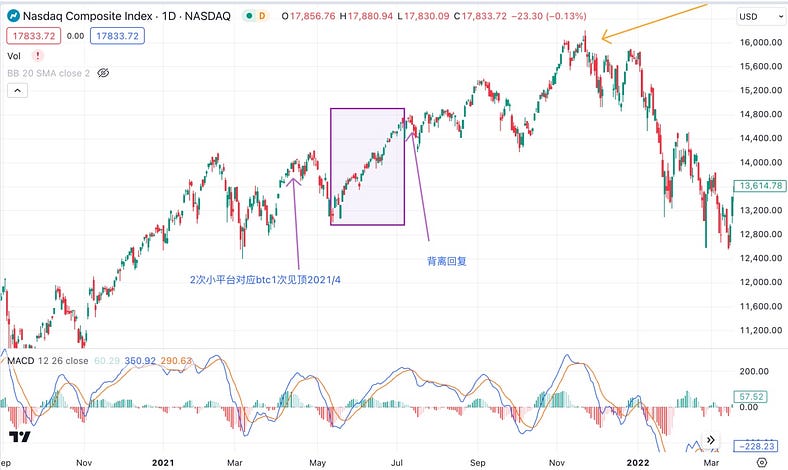
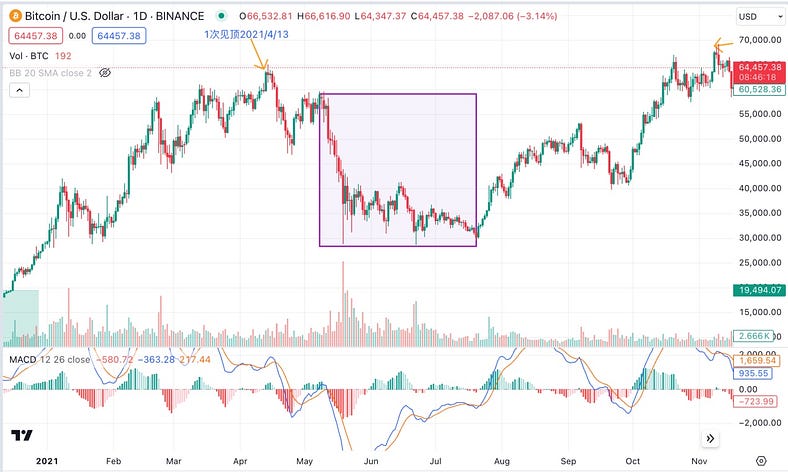
By historical standards, applying strict analogy, current market conditions have not yet fully met the criteria for re-correlation. More candlestick data is needed. So how do we logically understand this recurring pattern seen in both bull runs?
Assets such as BTC, gold, and U.S. equities operate under the same macro environment and are all influenced by factors like financial liquidity and risk-free interest rates. As a more elastic asset class, BTC tends to surge strongly early in a confirmed bull market, significantly outperforming U.S. equities. But as the saying goes, extremes reverse themselves—after such a strong run, BTC may subsequently underperform relative to equities. This dynamic resembles the relationship between altcoins and BTC.
From another angle, during the primary bullish phase, market liquidity is sufficient to drive broad-based asset appreciation. However, once prices rise to a certain level, the fuel or momentum begins to wane, making it difficult to sustain simultaneous gains across all asset classes—leading instead to a rotation where some assets rise while others fall.
On the event-driven side, recent market pressure has stemmed from selling by the German government and the Mt. Gox estate. Regardless of how we interpret this move, ultimately, after sufficient adjustment, BTC is likely to return to its positive correlation with U.S. equities. (The above views are personal opinions for reference only.)
Join TechFlow official community to stay tuned
Telegram:https://t.me/TechFlowDaily
X (Twitter):https://x.com/TechFlowPost
X (Twitter) EN:https://x.com/BlockFlow_News
 Cycle Capital Research