
6 Charts That Show the Correlation Between BTC Price and Major Assets Like U.S. Stocks Over a 10-Year Period
TechFlow Selected TechFlow Selected
6 Charts That Show the Correlation Between BTC Price and Major Assets Like U.S. Stocks Over a 10-Year Period
From exploration and formlessness to clear positioning and maturity.
 Navigating Web3 tides with focused insights
Author: WealthBee
As major players accelerate their entry into Bitcoin, its characteristics as a financial asset are becoming increasingly pronounced. Although Bitcoin is considered an independent asset with its own price movements, its growing integration into the global financial system makes higher correlations with traditional assets inevitable.
We examine Bitcoin’s correlation over more than a decade—from 2012 to present—with risk assets (U.S. equities), safe-haven assets (U.S. Treasuries and gold), and the global macroeconomic cycle (commodity index). Focusing on the period after 2017—when Bitcoin's price successfully broke and held above $1,000—we analyze its evolving relationship with other asset classes.
In its early stages, Bitcoin went through a period of exploration and imitation. When Bitcoin first emerged, its nature and potential were poorly understood, its value and use cases unclear, and mainstream investors and institutions approached it with caution.
However, over time, features such as decentralization and a fixed supply cap attracted increasing attention and trust, allowing Bitcoin to gradually solidify its identity and ultimately gain mainstream recognition. Particularly since 2017, Bitcoin’s price has shown rising correlation with four major traditional assets: U.S. stocks, U.S. Treasuries, gold, and commodities.
From uncertainty to clear positioning and maturity, Bitcoin’s evolution over the past decade not only reflects its price appreciation but also underscores its growing prominence in the global asset market.
1 Bitcoin vs. U.S. Stock Market: Strong Correlation
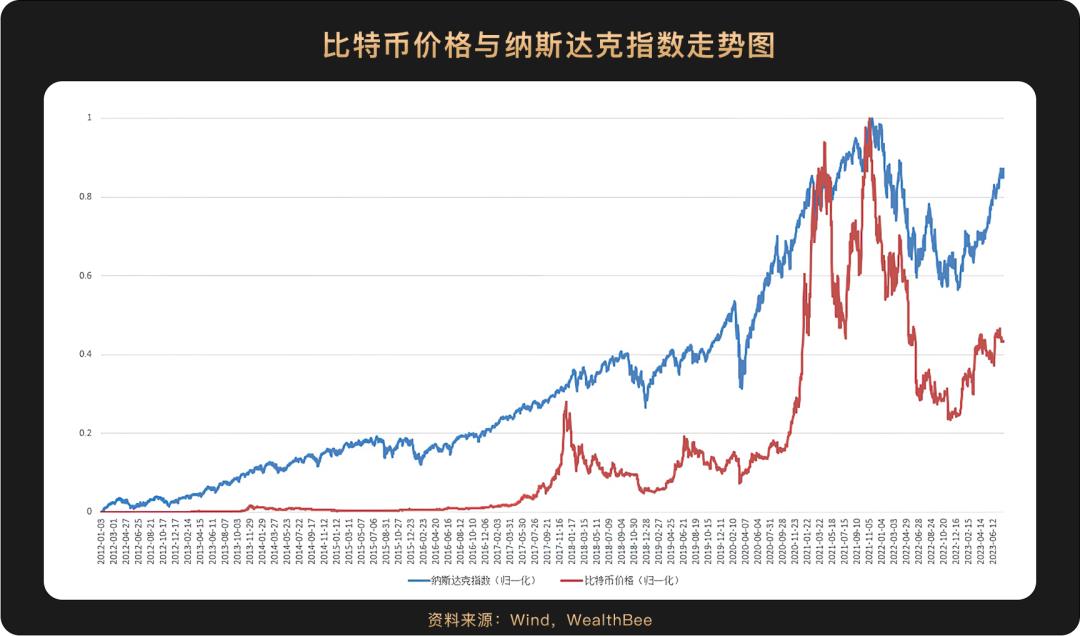
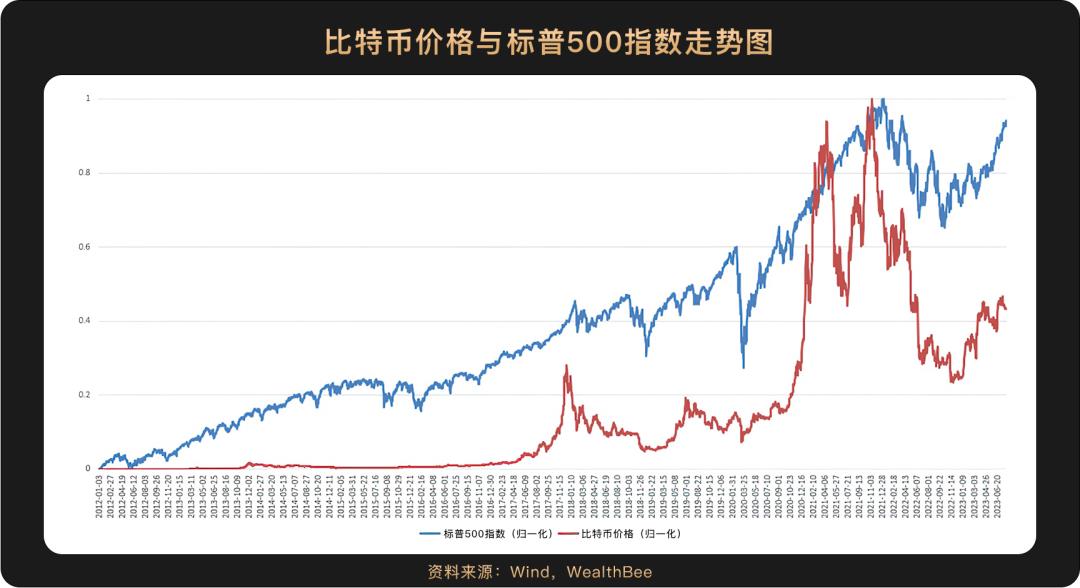
The chart clearly shows a high degree of correlation between U.S. stock indices and Bitcoin’s price movements. Using Bitcoin’s breakthrough above $1,000 in 2017 as a dividing line, calculations show that prior to 2017, Bitcoin’s correlation coefficients with the Nasdaq and S&P 500 were 0.6996 and 0.7217 (Pearson correlation coefficient), respectively.
Both nearly reached阶段性 peaks around late 2017, then peaked again simultaneously near the end of 2021—the highest point within the observed timeframe—followed by synchronized declines and rebounds. After 2017, the correlation coefficients increased to 0.8528 with the Nasdaq and 0.8787 with the S&P 500. This comparison reveals a steadily strengthening correlation with U.S. equities. Post-2017 values exceeding 0.8 fall into the “strong correlation” category.
2 Bitcoin vs. Gold Price: Moderate Linear Correlation
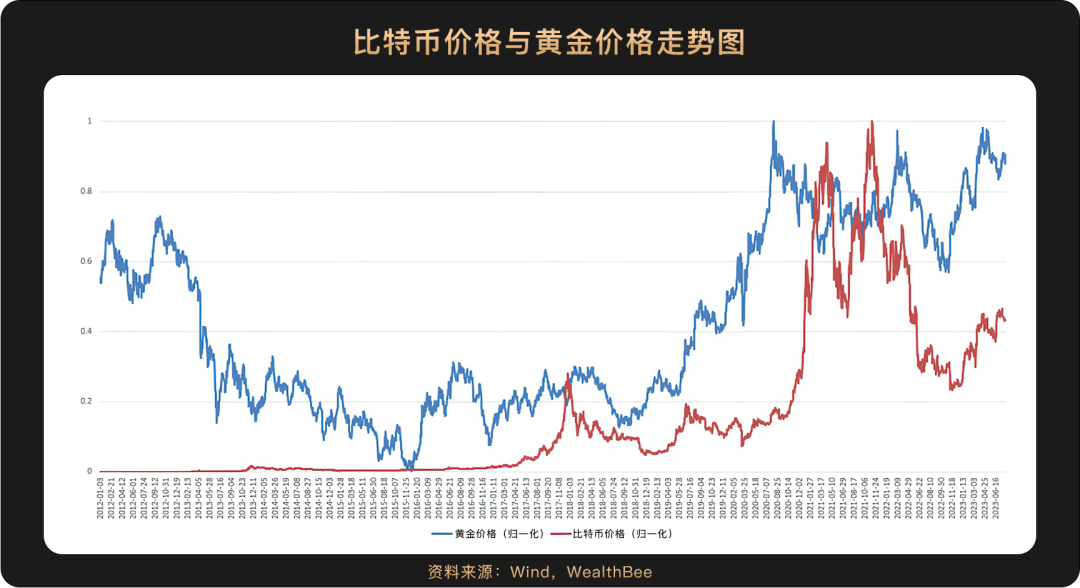
We use London spot gold (XAU) as the benchmark for gold price movements. Gold is a classic safe-haven asset. As shown in the chart, gold prices declined gradually before 2016, while Bitcoin prices slowly rose. Thereafter, both exhibited converging trends, peaking around 2018. In August 2020, gold hit its peak and began to decline, whereas Bitcoin surged afterward, entering a major bull market. Bitcoin’s peak coincided with a trough in gold prices (in 2021). However, starting November 2022, both rebounded from lows, showing consistent price behavior.
Again using 2017 as the watershed, the pre-2017 correlation coefficient was -0.6202, indicating a clear negative relationship. After 2017, the correlation coefficient rose to 0.6889 (Pearson), falling into the moderate linear correlation range.
3 Bitcoin vs. U.S. Treasury Yields: Low and Negative Correlation
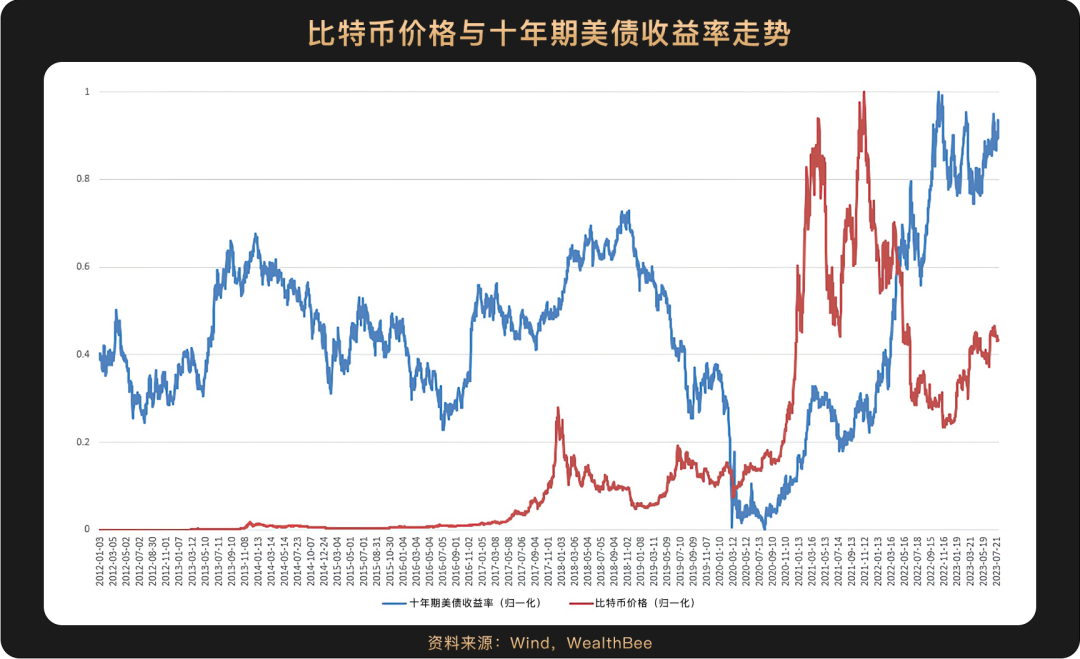
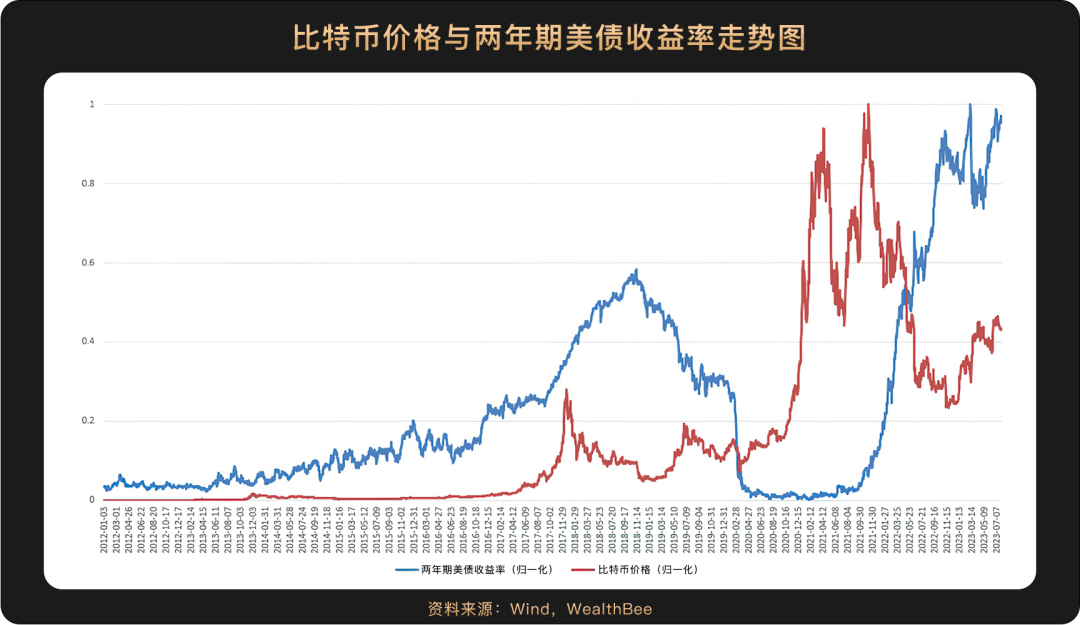
We selected the most representative U.S. 10-year and 2-year Treasury bonds, approximating them as proxies for medium-to-long-term and medium-to-short-term risk-free rates, respectively. Like gold, U.S. Treasuries are classic safe-haven assets. The charts show weak correlation between Treasury yields and Bitcoin prices. Especially for the 2-year yield, which remained extremely low in 2020 and 2021, Bitcoin prices soared during the same period. Testing post-2017 correlations, Bitcoin’s coefficients with the 10-year and 2-year Treasuries are -0.1382 and -0.1756 (Pearson), respectively—indicating low correlation and a negative relationship.
4 Bitcoin vs. Commodity Price Index: Moderately High Correlation
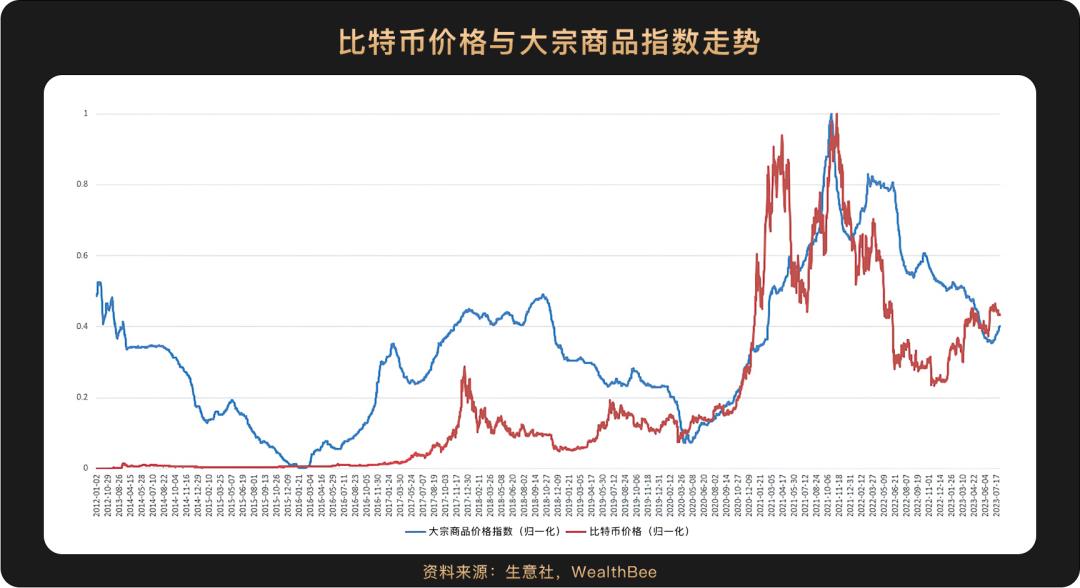
Commodity prices are influenced by many factors but broadly reflect the global macroeconomic cycle. The chart shows a relatively high correlation: both rebounded from lows in early 2020, continued rising, and nearly peaked simultaneously in November 2021 before declining together. Correlation testing yields a post-2017 coefficient of 0.7184 (Pearson), indicating a moderately high correlation.
5 Conclusion
Based on the above analysis, after 2017, Bitcoin’s correlation ranking with other assets is “U.S. equities > commodities > gold > U.S. Treasuries.” It shows high correlation with risk assets and the macroeconomy, but low correlation with safe-haven assets. Therefore, we can classify Bitcoin as a risk asset.
Fundamentally, financial asset price movements are driven by two forces: fundamentals and market risk appetite. When the global economy performs well—reflected in rising commodity prices—market risk appetite naturally increases, lifting Bitcoin alongside other risk assets like U.S. equities. Recently, the U.S. economy has remained strong, and the widespread adoption of AI large models is expected to become a primary driver of productivity growth over the next 10 to 20 years. With rising productivity, interest rate cuts could accommodate greater liquidity. Thus, we have good reason to believe that global investors’ risk appetite will gradually rise, leading to increased capital inflows into markets—and likely driving stronger performance in Bitcoin’s price.
Join TechFlow official community to stay tuned
Telegram:https://t.me/TechFlowDaily
X (Twitter):https://x.com/TechFlowPost
X (Twitter) EN:https://x.com/BlockFlow_News
 R3PO
R3PO