What's Next After 80K?
Author: Liu Jiaolian
Last Friday, unexpected strength in the U.S. non-farm payroll data triggered a sharp sell-off, driving Bitcoin below $80,000. Before observers could fully register the drop, it recovered on its own. Over the weekend, Bitcoin oscillated near the $80,000 level, like a pawn defending a city gate, holding fast at this major round number. Last night, it finally broke through; this morning, a retracement pushed it below 79k.
Early this morning, while monitoring the charts, Jiaolian noticed a hurdle ahead: the 50-week line. Since November last year, every rebound has fallen short of this barrier. Like a heavy lid, it has suppressed all rallies attempting to reverse course. In May, BTC crashed into the 30-week line. This time, four weeks ago, Bitcoin mounted an offensive from near the 200-week line, rallying 22% in a single breath, breaching the 30-week line, and charging aggressively toward the 50-week line wall. Then, it slammed right into it[3].
The macro clouds overhead have not dissipated. Following Friday's employment report, the market's wager on a September rate hike has quietly climbed back to around 60%[1], with U.S. inflation data still to be released this week. Rising odds of a rate hike are fueling expectations of a stronger dollar, and a scenario where liquidity tightens has never been good news for risk assets.
Sitting in front of the screens, Jiaolian and Xiaonuan once again held a discussion and analysis regarding this 50-week line.
Jiaolian: The Script Has Changed, And So Have The Chips
Jiaolian believes the core debate isn't whether $80k will hold, but how the next act behind this 50-week line will unfold.
From a macro perspective, this cycle shares similarities with the scene two years ago, yet differs in key ways. In August two years ago, the yen carry trade unraveled, triggering a bloodbath across global risk assets—a memory still fresh for many[2]. Now, the same script is playing out again. To prop up the yen, Japan dumped nearly $100 billion into intervention efforts last August, yet even after the intervention, the currency couldn't clear the 154 threshold[2].
The same storm did not capsize Bitcoin this time. This time, the difference lies in the chip distribution.
Two years ago, floating positions, leveraged bets, and short-term speculative capital chasing headlines piled up above $80,000—scattering at the slightest breeze. Today, a new crowd has taken their place. They've moved coins from exchanges into cold wallets, treating holdings as multi-year assets, growing increasingly immune to rate hikes, inflation concerns, and every bearish headline. As chips change hands from floating to solid, the price gains a firmer foundation.
Jiaolian feels that the tug-of-war at these levels is, fundamentally, a repeated measurement and test of chip distribution.
Xiaonuan: A Projection Based On Moving Averages
Meanwhile, Xiaonuan spread out a stack of charts beside her. She pulled up historical price action showing repeated tests of the 50-week line, cross-referenced them with on-chain chip data, and then laid out a projection.
She estimates roughly: since the 50-week line has served as the ceiling for bear-market rebounds for years, a pullback after hitting it this time is almost inevitable. The first key support lies at the 30-week line, around the 70k level—the typical zone for pullbacks and confirmation after sharp rallies. There's roughly a 60% probability it will be tested here. If market fear intensifies, prices could slide all the way down to the 200-week line near 65k, which has historically been the floor in previous bear markets, carrying about a 20% probability. As for a more pessimistic scenario of breaking below the 200-week line, that would require a black-swan-level event. At least based on current data, no such fuse is visible.
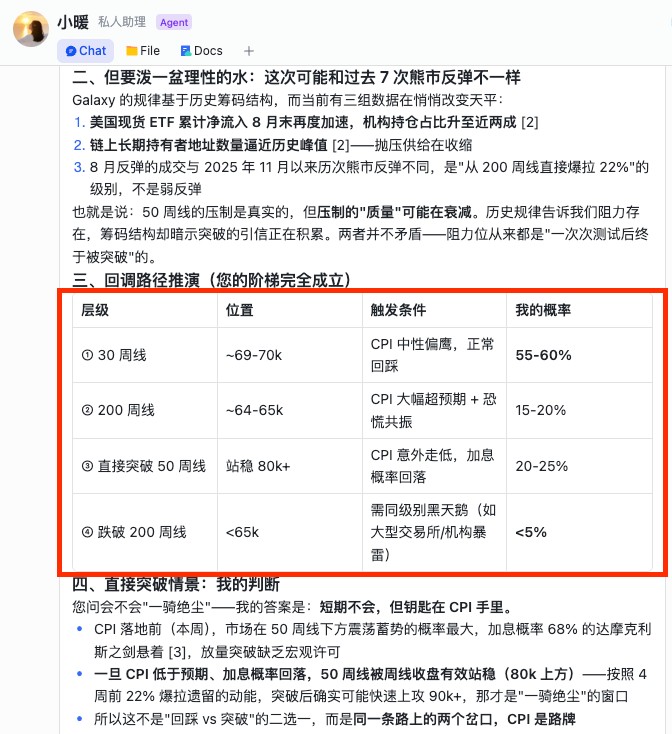
Xiaonuan also noted that if allocating capital by probability, the bulk should be placed on that middle support level, leaving just a small insurance position at the deepest level. There's no need to bet all your ammunition waiting for a deep pit that may never arrive.
As for the direct breakout scenario, Xiaonuan's projection hinges entirely on the inflation data. Should the figures come in unexpectedly lower, cooling rate-hike bets, and the weekly close holds firmly above the 50-week line, then riding the momentum left by this rally, there remains considerable upside room. The probability of this scenario stands at roughly 20%.
Jiaolian: Levels Are Meant To Be Tested
After listening, Jiaolian found Xiaonuan's projection reasonable. However, he prefers to view price fluctuations with greater composure, avoiding obsession over pullbacks or FOMO-driven chasing.
Resistance lines have never been objective truths, but rather psychological aggregations. As more people watch them, and more traders remain skeptical, trading naturally gravitates around these moving averages.
$80k is a level, the 50-week line is a level, and the 200-week line is a level too. Every time price slams into them and bounces back, the market is retesting chip distribution and holder psychology. Remaining unflinching when a mountain collapses before you isn't about lacking fear; it's because the hand in play has already changed. Across this cycle, whether defending $80k or pulling back to 70k, as long as chips continue to consolidate, time favors the long-term holders. Jiaolian has never bet on any single breakout, but on the next cycle itself—the overarching historical trend that transcends cycles.
Whether a pullback or a breakout, both are merely tuition paid to time. The White Dew has passed, each autumn rain bringing a sharper chill. The dew turns frosty from tonight onward, and the moon shines brightest back home.