Exchange reserves collectively shrink—who is still artificially inflating trading volumes?
Author: danny
Compiled by: TechFlow
TechFlow Summary: The author cross-verified the Q2 reserves and trading volumes of eight centralized exchanges, finding that industry-wide reserves are contracting and data anomaly signals at certain exchanges have become more pronounced. During liquidity drawdowns, this quantitative comparison can help investors identify counterparty risks and suspicions of volume washing.

About three months ago, we used on-chain data to analyze the trading volumes and open interest (OI) of several centralized exchanges (CEX). The analysis was divided into two parts: the first focused on trading volume (Vol/PoR), and the second on open interest (OI/PoR). The conclusions at the time were somewhat abstract; interested readers can refer back to it themselves.
2026 Q1 Data:
Some might argue that a single snapshot proves nothing, or that once incentive programs end and fees normalize, the data will naturally revert. So what actually happened? A follow-up analysis is sufficient.
This article focuses on only three things:
Rerunning the Vol/PoR analysis with Q2 data;
Rerunning the OI/PoR analysis;
Comparing Q1 and Q2 to see whose ratios are converging and whose are deteriorating.
I. Hyperliquid Remains the Benchmark
The formula remains unchanged:
Vol/Reserve = Total 30-day trading volume ÷ 30 ÷ Core reserve assets (BTC + ETH + USDT + USDC)
OI/PoR = Total open interest ÷ Core reserve assets
Hyperliquid remains the benchmark because it has the highest cost for fabricating data. The reasons have been explained in the previous two articles, so they won't be repeated here. See:
Hyperliquid's performance this quarter can be summarized as growth against the trend.
Hyperliquid's TVL increased from $4.88 billion to $6.11 billion, a 25% rise; its 30-day derivatives trading volume grew from $206.8 billion to $237.7 billion, up 15%. Capital inflow outpaced trading volume, causing the benchmark ratio to drop from 1.44x to 1.30x. After applying a 15% tolerance band, the Q2 threshold is 1.49x, compared to 1.66x in Q1.
Some might argue that a lower threshold could unfairly flag certain exchanges as anomalous. Therefore, all evaluations in this article underwent sensitivity testing, using both the new Q2 threshold and the previous Q1 threshold of 1.66x.
II. First, the Denominator: Industry-Wide Reserves Are Shrinking
The denominator for the ratios is reserves. All subsequent data comes from the official PoR pages of each exchange, using June 2026 snapshots, converted at standard prices of $63,001 for BTC and $1,769 for ETH.
Three observations:
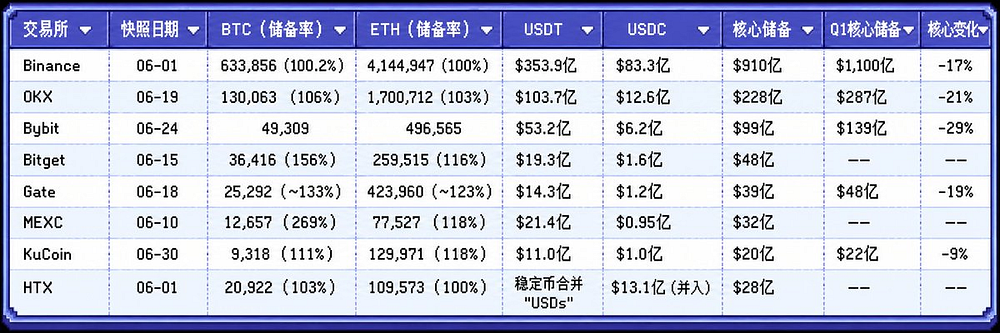
First, reserves are shrinking across the board. Binance down 17%, OKX down 21%, Bybit down 29%. Two forces are at play here. One is token price: as BTC drops into the $63,000 range, the USD value of crypto-denominated assets in PoR naturally declines. The other is genuine capital outflow. The overall direction is clear: liquidity is receding across the entire industry.
Second, Bitget's excess reserves are contracting. In Q1, we noted that Bitget maintained a 237% BTC reserve rate, projecting confidence akin to "we have funds and no reason to rug." In Q2, this figure dropped to 156%. A significant portion of the platform's own BTC was withdrawn from the reserve pool. This isn't a major issue since it's the platform's own money, but it directly impacts our ratios. More on this later.
Third, MEXC's excess reserves have hardly changed. Its BTC reserve rate stands at 269%, nearly identical to Q1's 270%. However, one detail is worth noting: MEXC users actually hold only 4,699 BTC on the platform. For an exchange claiming monthly volumes nearing $400 billion, the total BTC deposited by all users amounts to less than 5,000. Of course, some attribute this to MEXC's reputation for altcoin trading, which is a reasonable explanation.
Data Period: June 6 to July 6, 2026 (30 days) | Source: Official exchange PoR pages, CoinGlass, CoinGecko, and DefiLlama
Note: This article only samples these eight exchanges and does not represent the entire market. Research results inevitably contain errors.
III. Vol/PoR: Reassessing the Trading Volume Dimension
30-day trading volume is calculated using CoinGecko's daily series and converted at the daily BTC price. For details on data source changes, see the Limitations section. The benchmark is 1.30x, and the threshold is 1.49x:
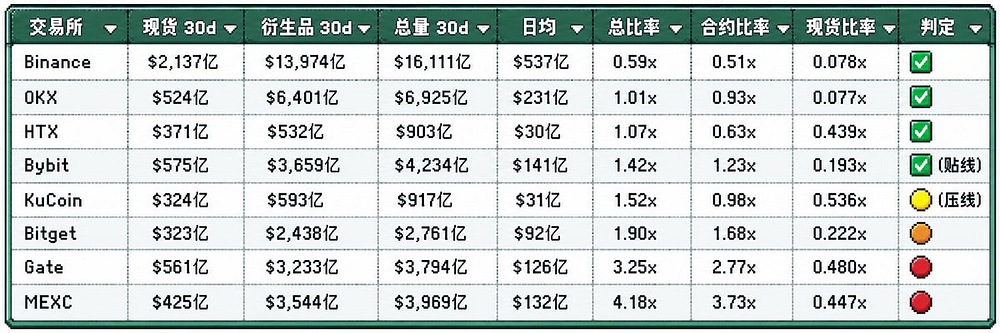
Binance remains the unexplained entity. Its total ratio is 0.59x, meaning every $1 of reserve corresponds to only $0.59 in average daily trading volume. Its derivatives ratio is 0.51x, less than half the benchmark. The total ratio is higher than Q1's 0.44x, but this is primarily due to the denominator shrinking by 17%, rather than a spike in the numerator. Its spot ratio is 0.078x, almost identical to Q1's 0.081x. A massive amount of dormant capital remains parked on the platform: deposits stay deposited, and long-term balances remain settled. This is how a mature exchange should look.
OKX is remarkably clean. Its derivatives ratio is 0.93x, and its total ratio is 1.01x, meaning roughly $1 of average daily trading volume per $1 of reserve. Its cross-verification discrepancy is also 0%, making it the most robust dataset among the eight exchanges. Reserves dropped 21%, and trading volume contracted correspondingly. Both numerator and denominator pulled back together, keeping the ratio stable.
HTX appears surprisingly healthy. Its ratio is 1.07x, below the threshold. The only caveat is that its self-reported volume is about 50% higher than cross-verification data. However, adjusting the data downward would only make HTX appear healthier, so the assessment remains unchanged. Its real issue isn't trading volume, but OI, which will be discussed in the next section.
Bybit remains within the warning zone. Its ratio is 1.42x, just one step away from the threshold. Its reserves contracted 29% this quarter, the largest drop among the eight exchanges. The numerator, i.e., trading volume, showed no abnormal changes. On the contrary, the shrinking denominator drove the ratio up. Bybit is now the most noteworthy case of "denominator risk." It currently passes on the volume dimension, but if reserves continue to drain without a corresponding drop in volume, it may breach the threshold next quarter.
Did KuCoin return to safe territory this quarter? This is the most closely watched dataset in the article. KuCoin's monthly spot volume dropped from $65 billion in Q1 to $32.4 billion, a 50% decline. Its spot ratio fell from 0.98x to 0.536x. The derivatives ratio dropped from 1.27x to 0.98x, falling below the on-chain benchmark. Its total ratio is 1.52x, just 0.03 above the threshold, meaning anomalous volume has essentially hit zero. In Q1, we attributed KuCoin's anomalous spot volume to trading incentives. Now that incentives have scaled back, the data has followed suit. KuCoin's own actions have retrospectively validated our judgment from three months ago.
Bitget has slid from the healthy zone into the gray area, but its situation requires separate analysis. Its derivatives ratio rose from 1.33x in Q1 to 1.68x, with the total ratio reaching 1.90x. By any measure, this looks like deterioration. But let's not jump to conclusions. Bitget's BTC reserve rate dropped from 237% to 156%. This indicates the platform extracted a substantial amount of its own capital from the denominator. Simply put, there are two ways a ratio can worsen: the numerator rises, or the denominator falls. In Bitget's case, at least half of the deterioration stems from the latter. This isn't volume inflation, but the platform withdrawing its own capital. Cross-verification shows its reported volume may be overstated by roughly 30%. If recalculated with adjusted data, its derivatives ratio would fall back to around 1.2x, within normal ranges.
Gate. The total ratio was 2.03x in Q1. In Q2, the total ratio surged to 3.25x, with the derivatives ratio jumping from 1.75x to 2.77x. More concerning is that while its reserves shrank by 19%, trading volume hardly decreased.
MEXC. In Q1, we attributed its 2.95x derivatives ratio to trading incentives and zero-fee promotions. In Q2, its derivatives ratio reached 3.73x, approaching three times the on-chain benchmark. Interestingly, its spot ratio did indeed drop from 0.81x to 0.447x. Spot incentives seem to have genuinely ended, but the focus has completely shifted to derivatives. Therefore, the conclusion must be revised: this isn't a promotion, but a business model. For an exchange where users collectively deposited only 4,699 BTC, monthly derivatives volume reaches $354.4 billion. That translates to $75 million in monthly derivatives turnover for every 1 BTC deposited by users.
IV. OI/PoR: Reassessing Open Interest
Volume measures flow, while OI measures open positions. Every open contract requires real capital locked as margin. CoinGlass has not yet released its Q2 report as the quarter just concluded. Therefore, this section uses a live snapshot from July 4, 2026. This inevitably differs from the Q1 methodology based on quarterly averages.
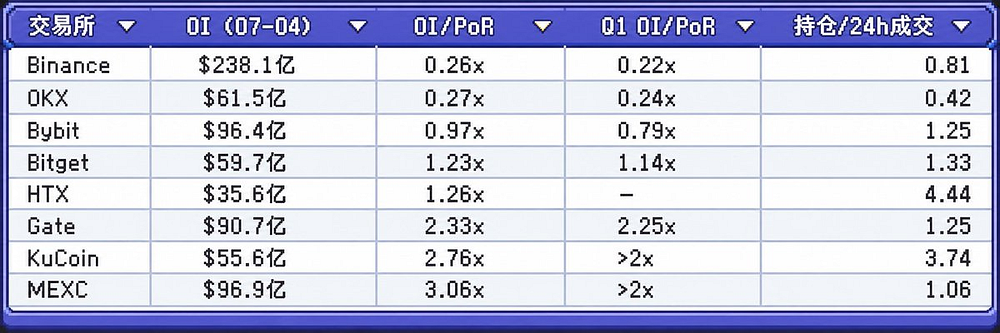
Benchmark: Hyperliquid OI/TVL stands at 1.16x ($7.09 billion / $6.11 billion).
MEXC's OI has caught up to Bybit's: $9.69 billion versus $9.64 billion. At an exchange holding $3.2 billion in reserves, its open positions are nearly equal to those of an exchange holding $9.9 billion in reserves. MEXC's OI/PoR ratio is 3.06x, the highest among the eight exchanges. In Q1, we stated: "You can almost forge volume at near-zero cost, but you cannot conjure OI out of thin air." Today, either every MEXC user is fully leveraged, or...
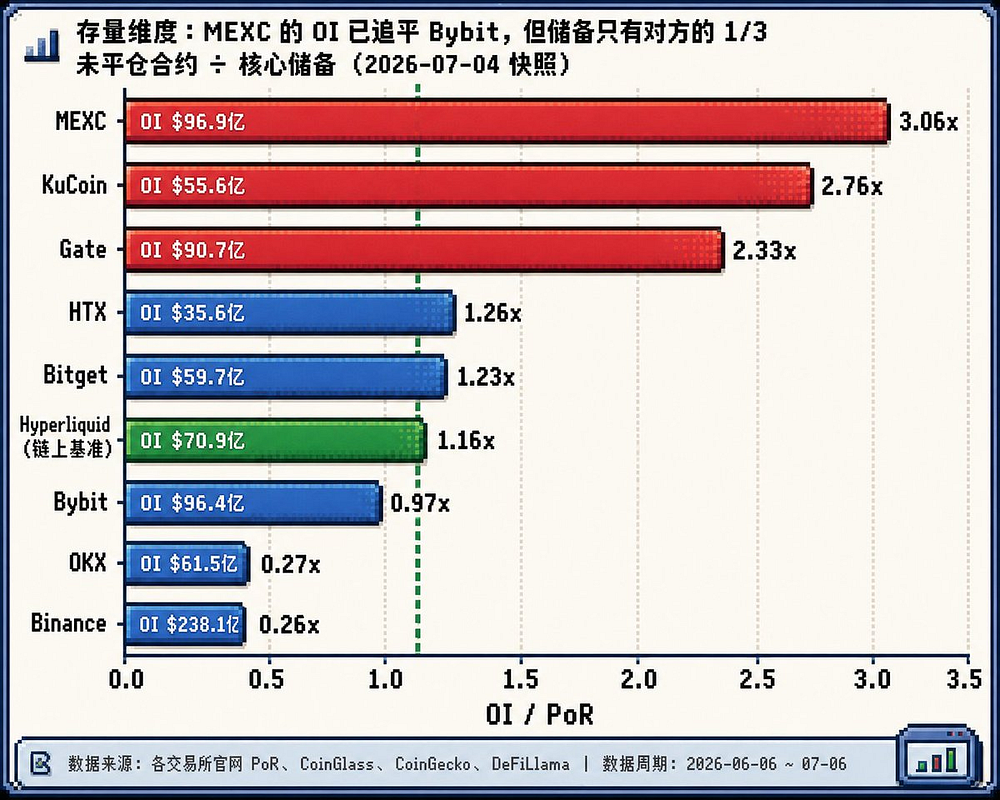
Gate. Its OI/PoR ratio is 2.33x, up from 2.25x in Q1. It has not converged but instead deteriorated further. Gate holds $9.07 billion in OI against core reserves of only $3.9 billion. In Q1, we warned: "In extreme market conditions, Gate's liquidation system could come under strain." We repeat this warning verbatim, but with a stronger tone.
KuCoin and HTX share a similarly anomalous pattern: an extremely high OI-to-volume ratio. KuCoin stands at 3.74, and HTX at 4.44. This implies it takes three to four full trading days' worth of volume to flip all open positions once. By contrast, Binance sits at 0.81, and Hyperliquid at 2.35, the latter partly attributable to on-chain limit order incentives. When open positions far exceed trading flow, it typically points to one of two scenarios: zombie positions or "beautified" OI reporting. Meanwhile, KuCoin's OI/PoR ratio remains stubbornly pinned at 2.76x. Flow is easy to withdraw, but open interest is much harder to conceal.
V. Quarter-on-Quarter Comparison
Now, we place the data from both quarters side by side.
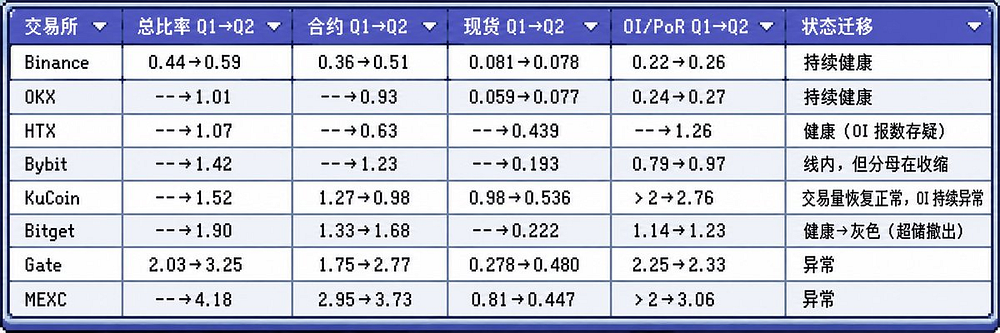
Quarter-on-quarter change in suspicious volume (the portion exceeding the threshold):
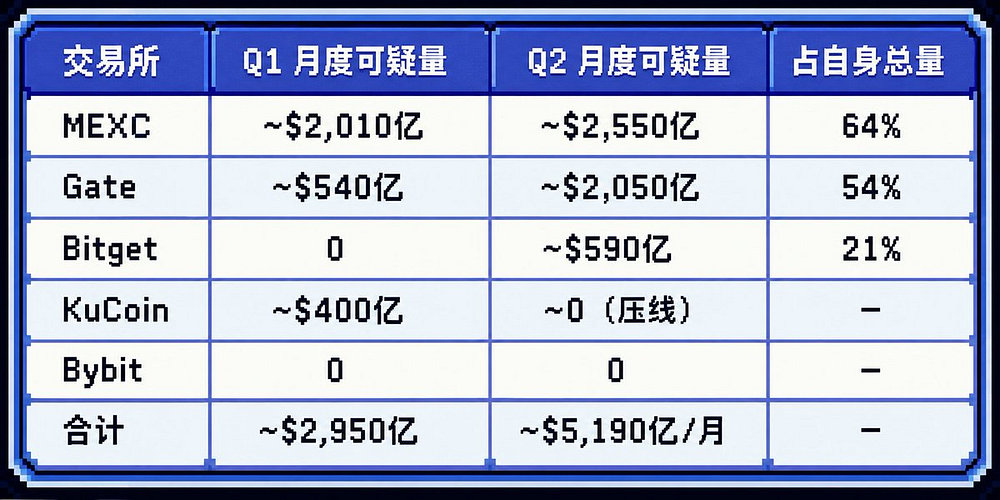
Some might argue that the total suspicious volume rising from $295 billion to $519 billion is merely a statistical artifact caused by lowering the threshold. Not so. As mentioned earlier, even applying Q1's older 1.66x threshold, MEXC's suspicious volume still stands at roughly $240 billion. Gate hovers around $180 billion. The real driver is that in a bear market, the denominator—reserves—declines. The numerator—reported volume—did not drop. In fact, it edged slightly upward. Capital recedes, yet reported data refuses to follow. This exposes the gap in water levels.
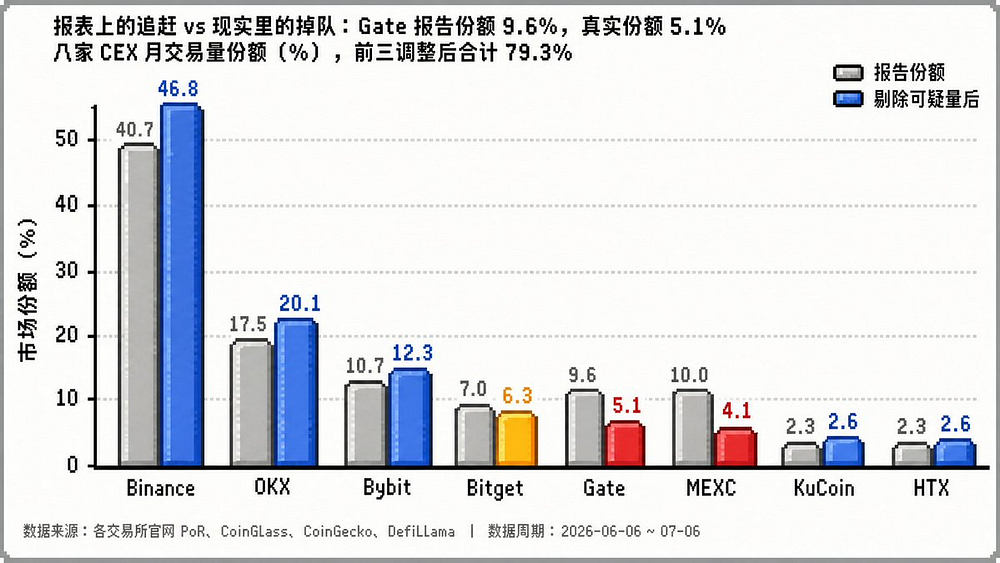
Market share comparison across three periods:
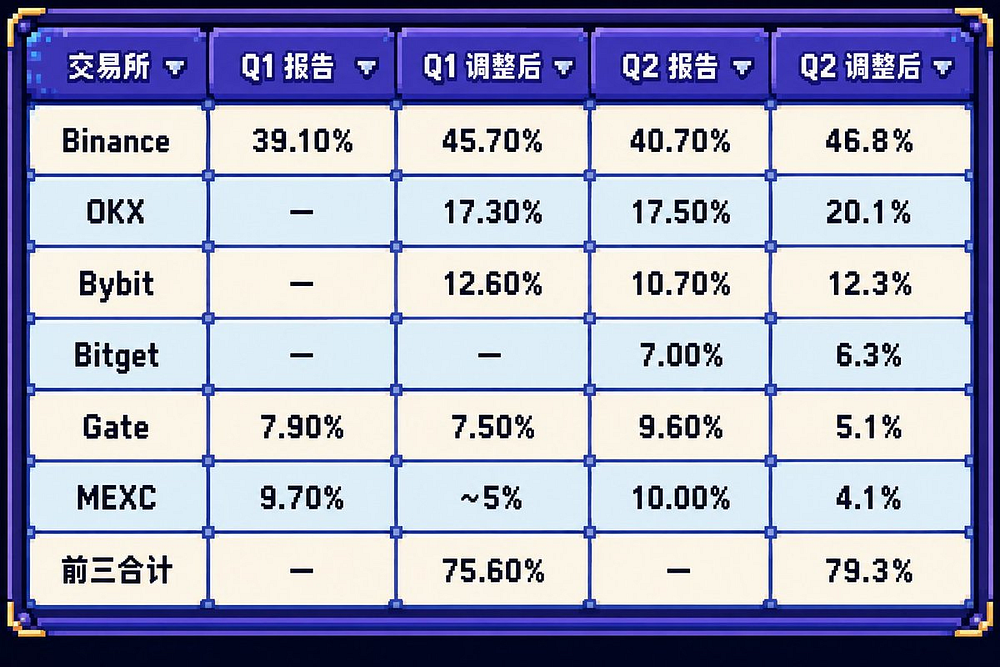
The combined genuine market share of the top three exchanges rose from 75.6% to 79.3%. Bear markets always favor concentration. When tides recede, capital instinctively flows toward the pools least likely to fail.
VI. RWA Interlude: With US Stocks Heating Up, Is the Data Warming Too?
This quarter, trading in tokenized US stocks and RWAs heated up across crypto exchanges. MEXC's homepage carousel no longer features new meme coins but highlights SK Hynix, Kioxia, and Samsung. These chip stocks soared amid a storage supercycle. Bybit launched a TradFi section prominently featuring gold, crude oil, and Nasdaq. Gate's navigation bar places "Stocks" alongside Polymarket. Meanwhile, Binance's bStock promotions never ceased. So, is RWA stock trading data really taking off?
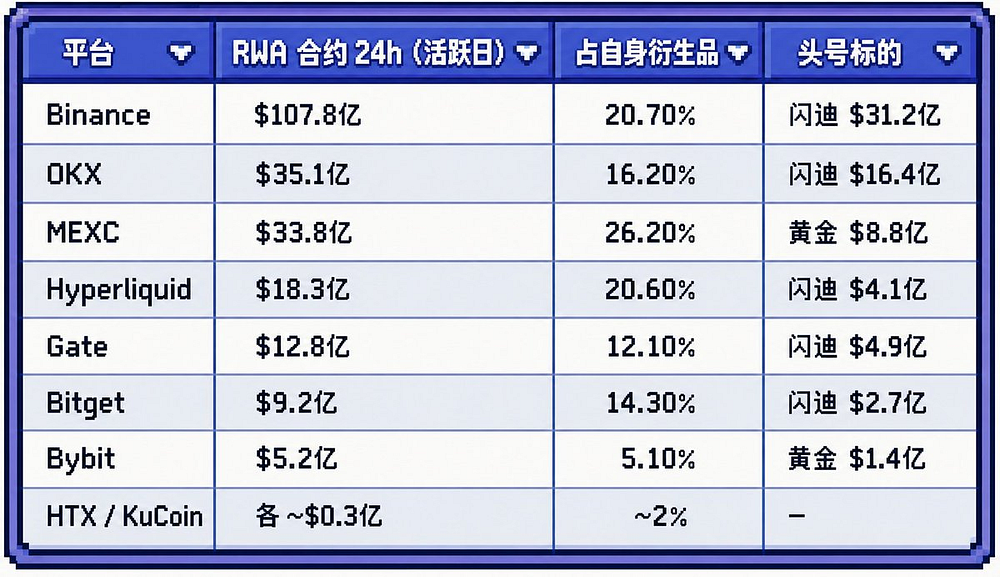
Three observations:
First, RWA trading has indeed reached considerable scale. On active trading days, sample exchanges recorded $22.3 billion in daily RWA derivatives volume. Memory stocks are the primary driver, with SanDisk contributing ~$6.4 billion and SK Hynix ~$4 billion. Together, the two storage giants account for nearly half of total RWA volume. Global retail traders are now leveraging crypto perpetual contracts to trade the DRAM supercycle.
Second, there is an interesting coincidence in the data. The benchmark Hyperliquid used here derives 20.6% of its volume from RWA, nearly matching Binance's 20.7%. This suggests that regardless of the exchange, the proportion of volume allocated to identical underlying assets remains broadly similar. Under extreme sensitivity testing, removing MEXC's entire 26.2% RWA volume would drop its derivatives ratio from 3.73x to 2.75x. However, if Hyperliquid's 20.6% RWA volume were removed simultaneously, the threshold would also fall to 1.19x. MEXC would still stand at 2.3 times the threshold. The same applies to Gate: after stripping its 12.1% RWA share, the ratio remains double the threshold.
Third, the denominator remains tiny. Stock perpetuals use USDT as margin, so the formula treats them fairly. In the spot market, the all-market daily volume for tokenized stocks is only $330 million, with even smaller user holdings. This is insufficient to skew the core reserve methodology.
Disclaimer: This report is based on public data from exchange official PoR pages, CoinGlass, CoinGecko, and DefiLlama. It does not constitute investment advice. OI data is based on a live snapshot from July 4, 2026, rather than quarterly averages. Volume data is self-reported by exchanges and aggregated by CoinGecko. This article samples only 8 exchanges and does not represent the entire market. Conclusions are inherently subject to error.
Join TechFlow official community to stay tuned
Telegram:https://t.me/TechFlowDaily
X (Twitter):https://x.com/TechFlowPost
X (Twitter) EN:https://x.com/BlockFlow_News
 @agintender