The market fears both missing out and being stuck at the top; what does the abnormal trend of the S&P Low Volatility Index reveal?
TechFlow Selected TechFlow Selected
The market fears both missing out and being stuck at the top; what does the abnormal trend of the S&P Low Volatility Index reveal?
Historical data shows that this signal often predicts poor performance for the stock market and tech stocks in the near future.
 Navigating Web3 tides with focused insights
Author: Jim Paulsen
Translation: TechFlow
TechFlow Editor's Note: The S&P 500 Low Volatility Index has exhibited an unprecedented anomaly for the first time in history: it rises when the broader market falls, and falls when the broader market rises. This unseen price behavior exposes the current market's schizophrenic state—investors both fear missing out on the AI frenzy (FOMO) and fear being left holding the bag at high levels (NBO). Historical data indicates that this signal often portends poor performance for the stock market and tech stocks in the near future.
The recent unique price trend of the S&P 500 Low Volatility Index indicates that investors are simultaneously trapped in two anxieties: both fear of missing out (FOMO) and fear of not exiting in time (NBO).
Recently, the performance of the S&P 500 Low Volatility Price Index has set an unprecedented record. Typically, low volatility stocks rise less when the S&P 500 rises, and fall less when the S&P 500 falls. However, over the past six months, low volatility investments have on average risen on days when the S&P 500 fell, and instead fell on days when the S&P 500 rose. That is to say, daily declines in the S&P 500 not only allowed defensive low volatility stocks to outperform by "falling less," but even directly pushed up the prices of low volatility stocks; conversely, on days when the S&P 500 rose, low volatility stocks not only underperformed, but their actual prices fell.
In my view, this unprecedented extreme price trend of the S&P 500 Low Volatility Index recently indicates that investors are simultaneously trapped in the dual anxiety of missing out (FOMO) and not exiting in time (NBO). Historically, this price behavior of low volatility stocks is often a warning signal for the stock market and tech stocks.
What is the S&P 500 Low Volatility Index?
The S&P 500 Low Volatility Index aims to measure the performance of the 100 stocks with the lowest volatility in the S&P 500 Index. The index consists of various defensive securities, including high-quality, stable earnings, safe dividend, and low price beta stocks. It is a typical buy target for the fearful, and also an object of rapid selling when bullish. This index is specifically designed to rise less in bull markets and fall less in bear markets, aiming to satisfy conservative investors who both want to participate in the market and fear not exiting in time.
But what does it mean when low volatility investments rise when the market falls and fall when the market rises? In my view, this depicts a market driven neither by excessive bullishness nor by excessive bearishness, but by investors simultaneously worried about FOMO and NBO. Excessive bullishness leads to low volatility stocks underperforming, while excessive bearishness makes low volatility stocks winners. But when the dual fears of FOMO and NBO are prominent simultaneously, low volatility stocks anomalously "rise" on down days and "fall" on up days. In the coexistence of FOMO and NBO, market up days not only see buying of high-risk stocks but are accompanied by selling of low volatility stocks; while market down days simultaneously stimulate selling of high-risk stocks and buying of low volatility stocks.
Performance of the S&P Low Volatility Index on S&P 500 Up Days and Down Days
Chart 1 shows the average daily percentage price gain of the S&P 500 Low Volatility Index over a rolling 6-month period on all S&P 500 up days (blue line) and down days (red line) since 1990. As shown, in almost all rolling six-month periods, when the S&P 500 Index rises, the average percentage price change of the S&P 500 Low Volatility Index is positive; when the S&P 500 Index falls, it is negative.
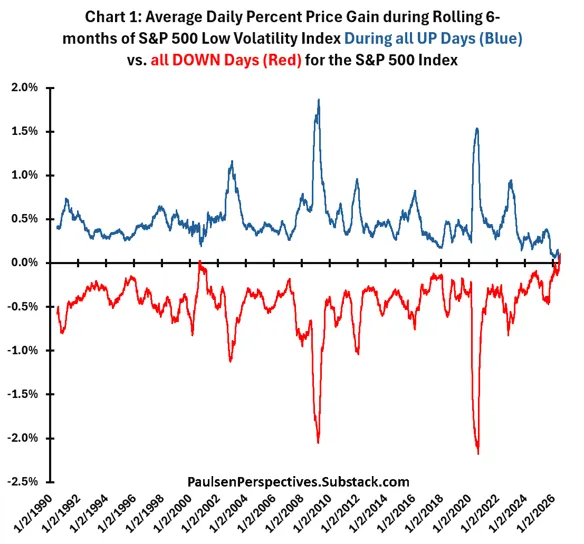
Except for the current situation, only briefly in 2000 did the rolling six-month low volatility index price percentage change appear as "positive" during S&P 500 daily up periods, and it has never appeared as "negative" during S&P 500 daily down periods. Although the low volatility index almost always underperforms during S&P 500 market rises and outperforms during S&P 500 market declines, except for the current era, it has never risen on all S&P 500 down days and fallen on all S&P 500 up days in the past six months. That is to say, in the past six months, the performance of the S&P 500 Low Volatility Index is "unique" compared to any other period since 1990—it on average rose on all S&P 500 down days in the past 6 months (red line), and simultaneously on average fell on all S&P 500 up days in the past 6 months (blue line)! This may reflect a milestone or at least very rare investor mindset or sentiment driving the stock market—my guess is the FOMO/NBO combination.
Average Historical Performance of Low Volatility Index on Up Days Minus Down Days
Chart 2 illustrates this unique change in the performance of the S&P 500 Low Volatility Index from a slightly different angle. It shows the average performance difference of the low volatility index over the past 26 weeks comparing all S&P 500 up weeks to all S&P 500 down weeks. That is the difference between the red line and the blue line in Chart 1. As shown, in the current era, this difference is "uniquely" negative (i.e., the gain of the low volatility index during overall S&P 500 rises is less than the gain during S&P 500 declines).
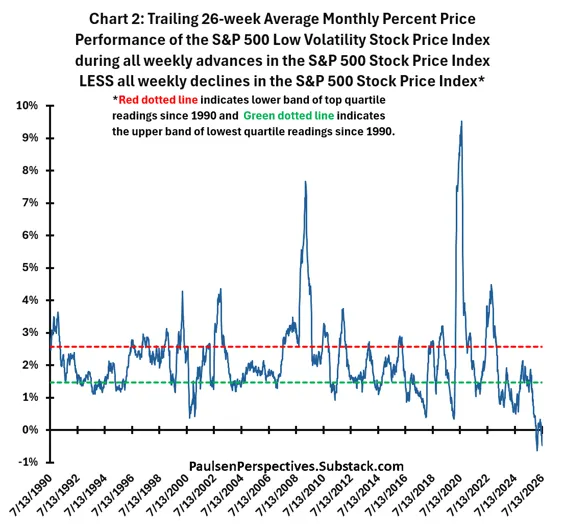
Although this performance difference has never been negative like today, near several important stock market peaks, it often fell into the historical lowest quartile (i.e., below the green dashed line)—for example, mid-2000, 2007, 2018, early 2020, and late 2021. It also often surged to the highest quartile near several important stock market bottoms (above the red dashed line)—for example, early 1991, late 2002, March 2009, mid-2020, and late 2022.
FOMO/NBO and Future S&P 500 Performance
What does the performance difference of the S&P Low Volatility Index on S&P 500 up days minus down days imply for future overall S&P 500 performance? Chart 3 highlights that since 1990, the average annualized price gain of the S&P 500 for the future 1 week is highly sensitive to the low volatility index spread difference quartiles. When the low volatility spread is in the highest quartile (i.e., above the red dashed line in Chart 2), the S&P 500 future average annualized price gain reaches a strong 17.26%. When the low volatility spread is in the middle two quartiles, its average annualized future 1-week gain drops to 10.12%, and finally, when the low volatility spread is in the lowest quartile, the S&P 500 future 1-week average annualized price gain drops to a disappointing 3.92%.
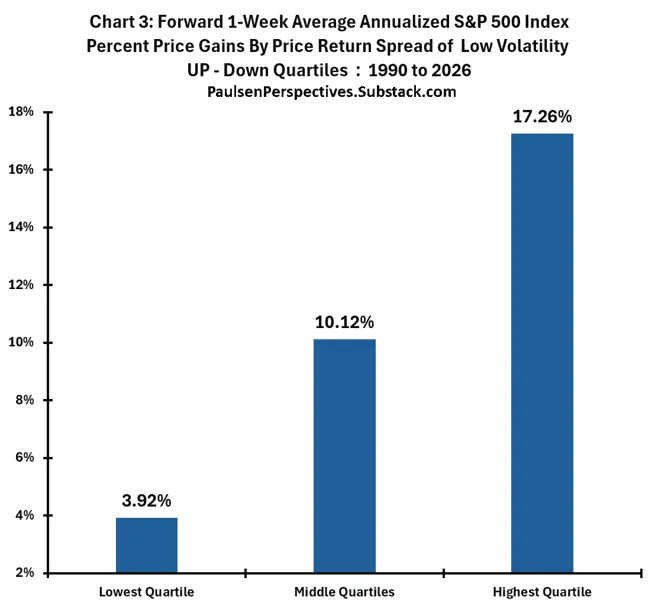
Obviously, the performance difference of the low volatility index during overall stock market rises and declines has historically been very important for the future performance of the S&P 500 Index. Essentially, as long as low volatility investments perform far better in rising markets than in falling markets, the S&P 500 usually delivers robust results. However, when low volatility investments perform better on down market days relative to up market days, the future performance of the S&P 500 usually struggles.
Overall, I believe this indicator represents a proxy indicator for investor sentiment. The performance of low volatility investments demonstrates the degree of importance investors place on risk aversion. When low volatility investments start to perform far better in falling markets than in rising markets, this indicates investors place greater emphasis on capital preservation—that is, their greatest fear is not exiting in time. And in the unique position we are in today—low volatility price performance is negative on up days because FOMO causes investors to sell low volatility stocks to switch to more aggressive alternatives, while low volatility price performance is positive on down days because falling markets truly make investors fear NBO—this means a nearly schizophrenic anxious mindset is driving the stock market.
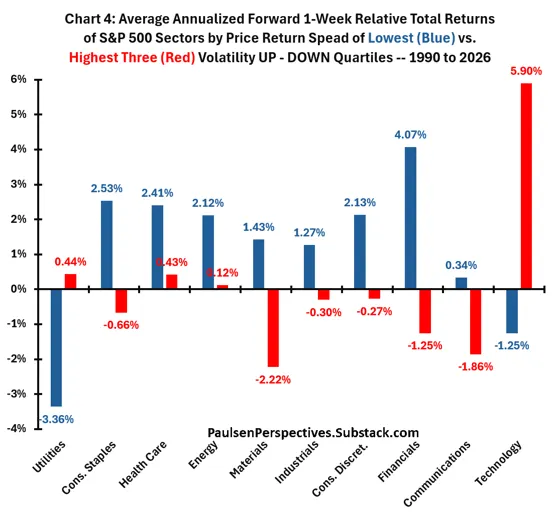
Finally, Chart 4 shows the performance of the top ten sectors of the S&P 500 since 1990 (the Real Estate sector was not considered due to short history), when the low volatility performance spread is in the lowest quartile (blue bars) versus in the highest three quartiles (red bars). Except for the Utilities sector, the lowest quartile results particularly favor the old economy sectors of the S&P 500, while the new economy sectors (i.e., Technology and Communication Services) usually perform much better when the low volatility performance spread is in the upper three quartiles. Therefore, if the low volatility spread remains in the bottom quartile, based on historical experience, investors should not only expect poor S&P 500 performance but should also consider increasing exposure to old economy sectors and be more cautious about overweighting Technology and Communication Services.
Final Comments
This is the first time the new economy trade has shown flaws in this bull market. Although the Technology/Communication sectors are still leading the stock market and recently received a huge boost from the AI story, stock market volatility has increased—the nearly 20% drop in the S&P 500 Index in spring 2025 and the nearly 10% drop in the first quarter of 2026 are proof. Although earnings results—especially for new economy companies—remain excellent, the performance of S&P 500 tech stocks and the Mag 7 Index since mid-2024 has only been slightly better than the market. Additionally, for the first time in this bull market, over the past year, "broader market instruments" such as small-cap stocks, value stocks, and international stocks have performed much closer to new economy stocks.
Investor sentiment indicators show investors are neither overly enthusiastic nor extremely pessimistic. The CNN Fear & Greed Index is slightly below average, and the AAII Sentiment Index is slightly above average.
No one wants to miss the opportunity of AI taking over the world (FOMO?), but many are also increasingly uneasy about high valuations, concentrated holdings, and crazy aggressive future expectations for earnings (NBO?). The result? The performance spread of the low volatility index between up days and down days is negative for the first time in history, reflecting that the stock market seems to be increasingly driven simultaneously and perhaps schizophrenically by FOMO and NBO! This suggests investors may need to proceed with caution in the coming months.
Join TechFlow official community to stay tuned
Telegram:https://t.me/TechFlowDaily
X (Twitter):https://x.com/TechFlowPost
X (Twitter) EN:https://x.com/BlockFlow_News