The Overlooked "Small Money": The Wealth Code Behind Perpetual Contract Funding Rates
TechFlow Selected TechFlow Selected
The Overlooked "Small Money": The Wealth Code Behind Perpetual Contract Funding Rates
How much funding rate in the crypto market has actually been earned?
 Navigating Web3 tides with focused insights
Author: Basit | Σ:
Compilation: TechFlow
20 hours of research turned into 5 minutes of reading.
TL;DR
-
On Hyperliquid, funding rate payments have reached millions of dollars.
-
On Binance, the figure has even reached hundreds of millions of dollars; data from other platforms remains unclear.
-
The calculation method is overly simplistic—skip if you can't understand.
A mechanism once designed to promote fair market participation has now become a goldmine for arbitrageurs.
Introduction
Funding rates are periodic payments made between traders (longs/shorts) to align the premium price of perpetual contracts with the spot price.
These seemingly trivial micro-payments have been transformed by savvy players (yield operators) into revenue streams worth millions of dollars.
Hence, I conducted a study to explore how much money people have actually earned through funding rate "arbitrage." This also means answering: "How much in total have traders paid in funding rates?"
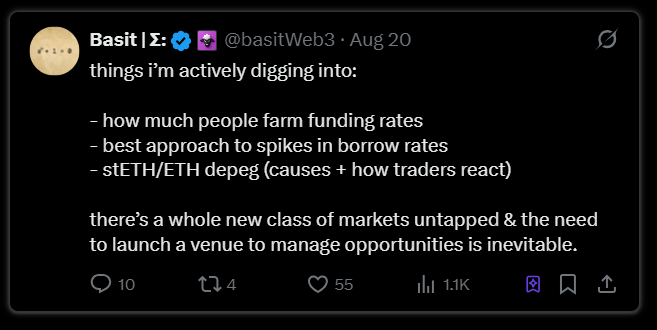
"I'm actively researching the following:
-
How much people earn via funding rate arbitrage
-
Best strategies to handle volatile borrowing rates
-
Reasons behind stETH/ETH de-pegging and trader responses
A completely new market segment remains untapped—launching a platform to manage these opportunities is inevitable."
Original tweet link: Click here
To clarify this, we need to first explain:
-
The historical total amount of funding rates paid across all crypto perpetual markets (this number could be shocking—hundreds of millions or more).
-
The total funding rate amount on a specific exchange (e.g., Binance, Bybit, Hyperliquid, dYdX, etc.).
-
The total funding rate amount for a single asset (e.g., cumulative or annual data since ETH perpetuals launched).
The short answer: there is currently no public statistic showing the "total funding rate payments across all crypto perpetual contracts." Most exchanges and data providers publish funding rates, open interest, and historical data, but no one aggregates funding payment data across every platform into an official total.
But what I will do next:
-
Explain why an exact global total cannot exist;
-
Show a simple and correct way to estimate this number;
-
Provide a transparent rough estimate (range), including:
→ Global annual total funding rate payments;
→ A reasonable estimate for Binance;
→ A reasonable estimate for Hyperliquid.
Why is there no single “historical total funding rate paid” metric?
Funding rate payments are peer-to-peer transfers between longs and shorts, recorded differently across centralized exchanges (CEX), decentralized exchanges (DEX), and on-chain systems.
While data providers (such as @coinglass_com) offer funding rates, open interest, and historical charts, they do not publish a "lifetime total funding payments" statistic covering all platforms and markets. This is because funding payments occur directly between traders, not processed by the platform itself.
To generate such data, we would need to extract time-series data of funding rate × open interest from all relevant platforms and perform reasonable, assumption-based calculations.
In this study, I used $ETH perpetual contracts as the analysis target.
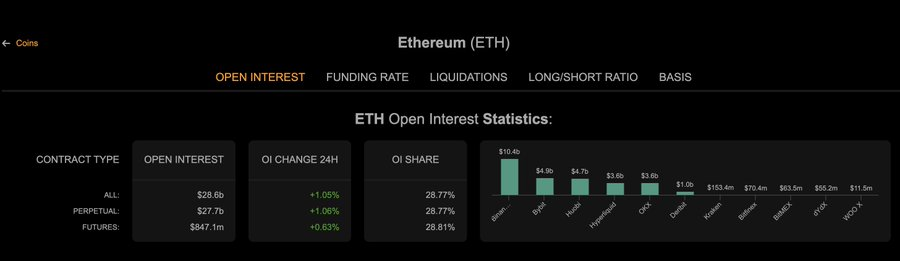
Figure: ETH position size statistics across different platforms
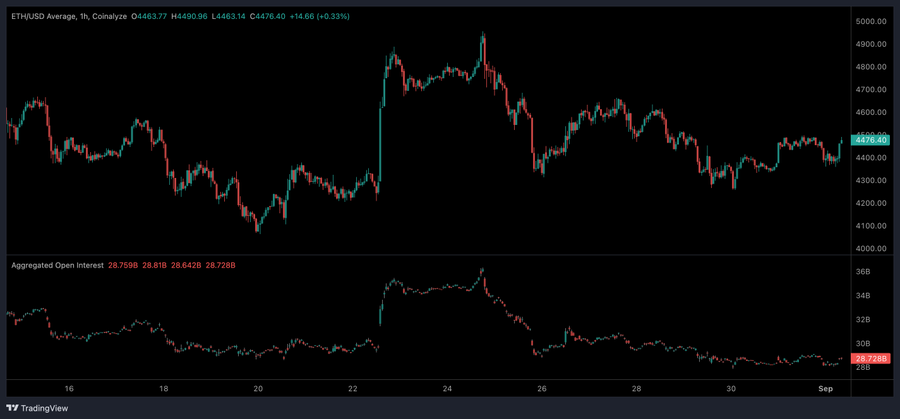
Figure: Aggregated ETH position size chart
Correct Method: How to Calculate Total Funding Rate Payments
For any perpetual market and time window, we can calculate using the formula:
Total funding rate payments ≈ funding_rate(t) × open_interest(t) × Δt
Where:
-
funding_rate(t) is the actual funding rate at timestamp (t);
-
open_interest(t) is the nominal open interest value (in USD) at timestamp (t);
-
Δt is the length of the funding payment interval (typically 8 hours → most CEXs have 3 payment intervals per day).
By integrating historical data sequences from CoinGlass, we can compute a precise total funding payment amount.
My Estimation Approach: Transparent and Assumption-Based
I used assumptions ranging from conservative to liberal to derive a range instead of a false single number:
Common Parameters:
-
Current date/timeframe: From start of this year, i.e., January 1, 2025 → August 27, 2025, totaling 239 days (3 funding intervals per day → 717 intervals).
-
Funding payment interval: Every 8 hours (3 times daily, applicable to Binance and many perpetuals).
-
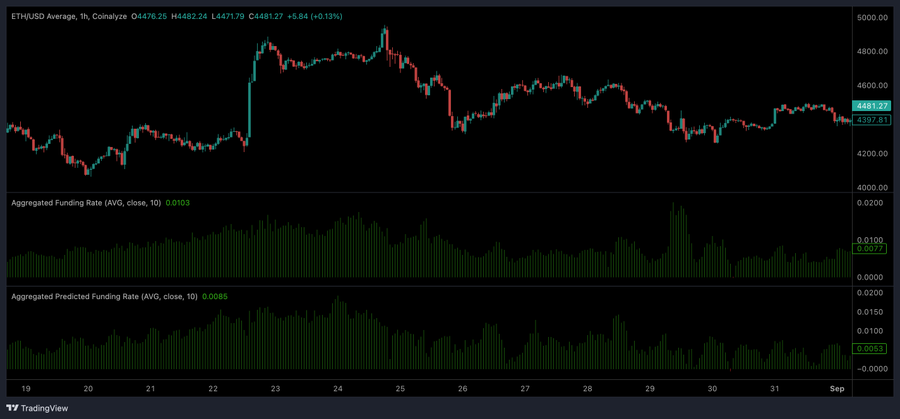
Broad market open interest for ETH perpetuals (nominal value): I used three scenarios: average open interest of $20B, $27.6B, and $30B (these numbers reflect low→high historical averages depending on market cycles and whether all exchanges are included).
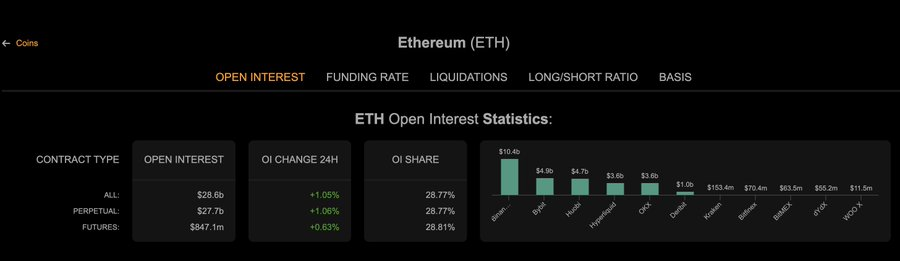
Figure: As seen, the average ETH open interest across all perpetuals is $27.7B.
-
Average funding rate per interval (weighted by open interest):
For this, I used an aggregated funding rate: 0.000103 (0.0103%) per 8-hour interval.
Funding rates are positive for longs and negative for shorts (usually close to zero, but occasionally spike). These assumptions yield conservative → aggressive results.
Using the formula (for annual window):
Annual total funding payments ≈ average open interest × average funding rate per interval × (239 × 3)
Results - Global (Annual Rough Range)
(Calculated using the above formula, over 239 days)
-
Low scenario ($20B open interest, average funding rate 0.000103) → ≈ $1.48B
-
Mid scenario (current $ETH open interest $27.6B, average funding rate 0.000103) → ≈ $2.04B
-
High scenario ($30B open interest, average funding rate 0.000103) → ≈ $2.2B
Interpretation:
The realistic mid-range (based on current $ETH open interest) is around several billion dollars annually; during extreme leverage periods (very high funding rates + very high open interest), the annual total could reach tens of billions.
This is only a rough aggregate estimate (not a precise measurement), as we used averaged assumptions across the market (for $ETH). The same methods and examples apply to other markets like $BTC or $HYPE.
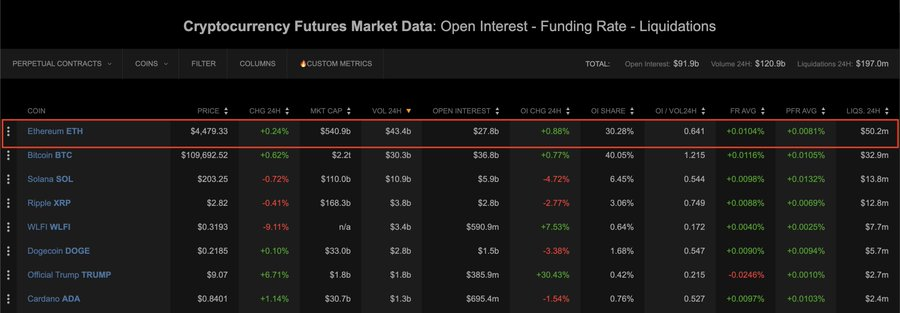
Figure: Average funding rates - $ETH
Results - Binance (Estimated Market Share)
Binance holds a large share of perpetual trading volume (I use approximately 17% as reference; adjust as needed):
Applying 17% market share to the above global estimates:
-
Low scenario → ≈ $251M (over 239 days)
-
Mid scenario → ≈ $347M
-
High scenario → ≈ $377M
It looks like a huge number, but it's actually quite reasonable.
Results - Hyperliquid
Hyperliquid is significantly smaller than Binance (though I believe this may change soon).
Assuming Hyperliquid’s average $ETH perpetual open interest share is roughly 5.3% (a very rough estimate). Using the same global estimate scenarios:
Calculation (global estimate × ~5.3% market share):
-
Low scenario ($1.48B) → ≈ $78.3M (over 239 days)
-
Mid scenario ($2.04B) → ≈ $108M
-
High scenario ($2.22B) → ≈ $117.4M
Summary
There is currently no single public figure that accurately captures total funding rate payments; anyone claiming "total funding payments were $X" is actually relying on multiple sources and assumptions—just like I did.
The actual annual global funding payments likely range from several billion (low end) to tens of billions (high end), depending on market conditions (my median estimate is roughly $2B–$5B/year under reasonable assumptions).
Binance’s annual funding payments (or participating fund transfers) could reach hundreds of millions of dollars, depending on market share and funding rate volatility.
Hyperliquid, by comparison, is smaller, with annual payments possibly ranging from tens of millions to low hundreds of millions, depending on its average open interest.
This was an interesting study full of assumptions.
If you've read this far, you're a true research enthusiast. Many probably didn't even make it through the first summary.
Your brain might be "overheated"... Sorry :)
Join TechFlow official community to stay tuned
Telegram:https://t.me/TechFlowDaily
X (Twitter):https://x.com/TechFlowPost
X (Twitter) EN:https://x.com/BlockFlow_News
 @basitWeb3