Coinbase Monthly Outlook: Bitcoin and COIN50 Both Lose Key Support—How Far Until the Market Bounces Back?
TechFlow Selected TechFlow Selected
Coinbase Monthly Outlook: Bitcoin and COIN50 Both Lose Key Support—How Far Until the Market Bounces Back?
Bitcoin and the COIN50 index have recently fallen below their respective 200-day moving averages, signaling a potential shift into a bear market for the crypto market.
 Navigating Web3 tides with focused insights
Author: David Duong, CFA - Global Head of Research
Translation: Daisy, ChainCatcher
Key Takeaways:
-
As of mid-April, the total market capitalization of cryptocurrencies excluding Bitcoin has declined from its December 2024 peak of $1.6 trillion to $950 billion—a 41% drop. Additionally, venture investment in the sector has fallen 50% to 60% compared to 2021–2022 levels.
-
We believe a conservative risk management approach is warranted at this stage. However, we expect crypto prices may stabilize by the latter half of Q2 2025, setting the foundation for a rebound in Q3.
Overview
A confluence of factors may be signaling the onset of a new "crypto winter." With global tariff policies being introduced and potentially escalating, market sentiment has clearly deteriorated. As of mid-April, the total market cap of non-Bitcoin cryptocurrencies has dropped to $950 billion, down 41% from its $1.6 trillion high in December 2024 and 17% year-on-year. Notably, this level is even lower than the market cap seen throughout nearly the entire period from August 2021 to April 2022.
In Q1 2025, venture investment in the crypto industry showed some recovery compared to the previous quarter but remains 50% to 60% below the peak levels seen between 2021 and 2022. This significantly limits new capital inflows into the ecosystem, particularly affecting the altcoin segment. These structural pressures stem largely from ongoing macroeconomic uncertainty. Fiscal tightening and tariff policies continue to weigh on traditional risk assets, causing investment decisions to stall. Although the regulatory environment offers some support, the broader weakness in equity markets poses significant challenges for crypto market recovery.
The interplay of multiple forces presents a challenging cyclical outlook for digital asset markets, warranting caution over the near term (expected over the next 4–6 weeks). Nevertheless, we believe investors should adopt flexible tactical approaches to navigate volatility—because once sentiment begins to repair, any rebound could be swift. We remain optimistic about market performance in the second half of 2025.
Bull vs. Bear Markets
In equities, a common rule of thumb defines a bull or bear market as a 20% rise from a recent low or a 20% fall from a prior high. However, this benchmark is inherently subjective and less applicable to the highly volatile crypto market. Cryptocurrencies often experience price swings exceeding 20% within short timeframes without necessarily indicating a fundamental shift in trend. Historical data shows, for example, that Bitcoin can fall 20% in a single week yet still remain within a long-term upward trajectory—and vice versa.
Moreover, crypto markets operate 24/7, making them a real-time barometer of global risk sentiment during traditional market closures (e.g., nights or weekends). As such, crypto prices tend to react more sharply to global events. For instance, during the Federal Reserve’s aggressive rate-hiking cycle from January to November 2022, U.S. equities (represented by the S&P 500) fell 22% cumulatively; Bitcoin, however, began declining earlier—from November 2021—and posted a 76% drawdown over a similar timeframe, roughly 3.5 times the decline seen in U.S. stocks.
The Truth Amid Contradictions
It's important to note that the traditional "20% rule" used to define bull and bear markets is merely a heuristic with no universally accepted standard. As U.S. Supreme Court Justice Potter Stewart once said when asked to define obscenity: “I know it when I see it.” Similarly, identifying market trends often relies more on experience and intuition than rigid quantitative models.
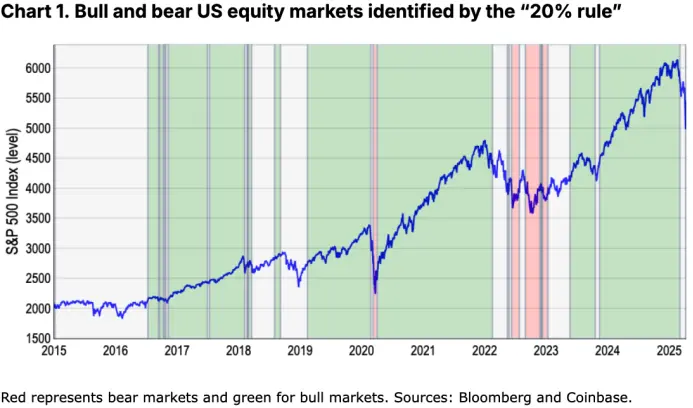
Nonetheless, to systematize our analysis, we reference the rolling one-year window of closing highs and lows in the S&P 500 to identify key market reversals. Using this method, U.S. equities have experienced approximately four bull markets and two bear markets over the past decade—excluding the most recent downturn from late March to early April (our model has already started flashing bearish signals). See Chart 1.
However, the "20% threshold" overlooks at least two significant pullbacks that had major impacts on market sentiment despite falling within the 10%–20% range. These include the volatility spike triggered by China's stock market turmoil at the end of 2015 and the market turbulence caused by escalating global trade tensions in 2018 (as reflected in rising readings of the Federal Reserve's Global Trade Policy Uncertainty Index). See Chart 2.
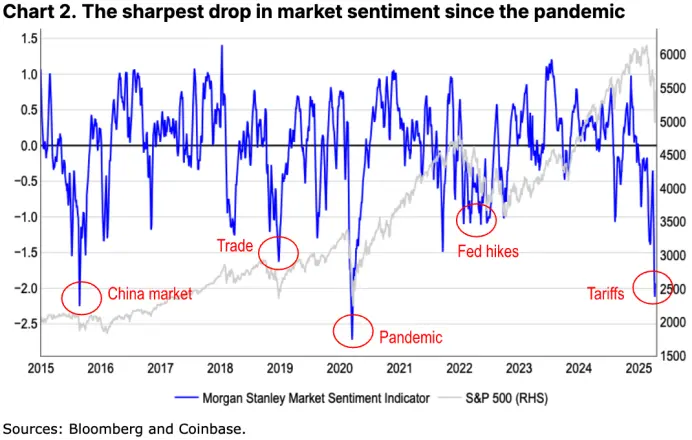
Past experience shows that sentiment-driven market declines often trigger defensive portfolio adjustments—even if they don’t reach the arbitrary 20% threshold. In other words, we believe a bear market fundamentally reflects a structural shift in the market characterized by deteriorating fundamentals and shrinking liquidity, not just the magnitude of price declines. Furthermore, the "20% rule" carries the risk of complacency, as it ignores early warning signs such as weakening market depth and defensive sector rotation—historically precursors to major downturns.
Alternative Indicators
Hence, we seek alternative metrics that more accurately reflect the relationship between price movements and investor psychology—applicable to both equities and crypto assets. Defining a bear market involves not only asset returns but also market sentiment—the perception among investors that a downtrend will persist, prompting strategic shifts. This concept is complex because what we're observing isn't simply consecutive up or down moves, but rather inflection points in long-term trends. The pandemic period serves as a clear example: the market underwent a rapid and severe sell-off followed by a sharp rebound. That bear phase was short-lived largely due to massive fiscal and monetary stimulus rolled out globally, preventing prolonged investor drawdowns.
Rather than relying on heuristics like the "20% rule," we prefer two types of risk-adjusted indicators: (1) risk-adjusted returns measured in standard deviations; and (2) the 200-day moving average (200DMA). For example, from November 2021 to November 2022, Bitcoin underperformed its prior 365-day average by 1.4 standard deviations; over the same period, U.S. equities declined by 1.3 standard deviations. On a risk-adjusted basis, Bitcoin’s 76% drop is thus comparable in severity to the S&P 500’s 22% decline.
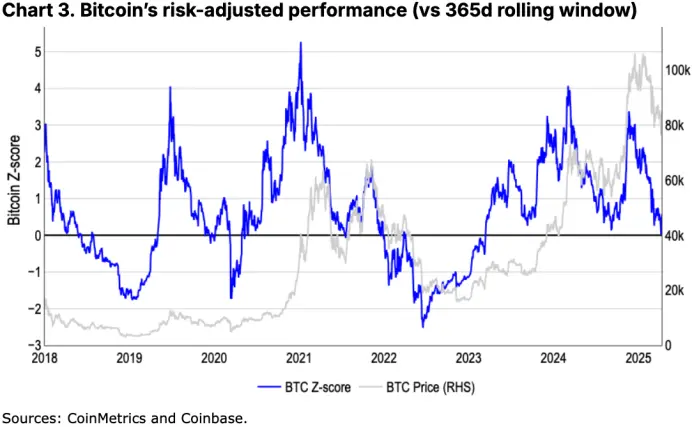
Given that standard deviation naturally accounts for crypto’s high volatility, z-scores are well-suited for analyzing crypto assets. Still, this metric has limitations: it is relatively complex to compute and generates fewer signals during stable periods, potentially lagging in detecting trend changes. For instance, our model indicated the last bull cycle ended in late February, after which the market entered a "neutral" state—highlighting potential delays in capturing turning points during volatile phases.
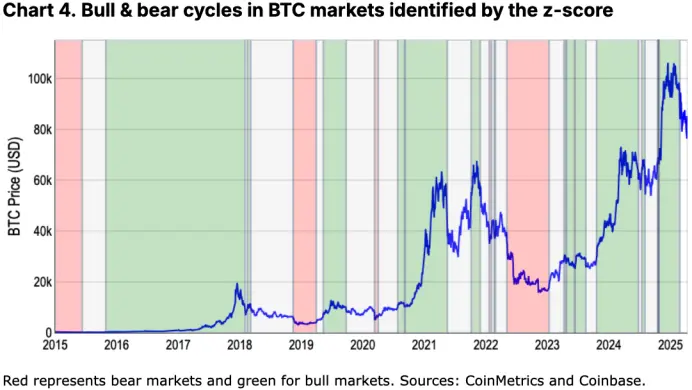
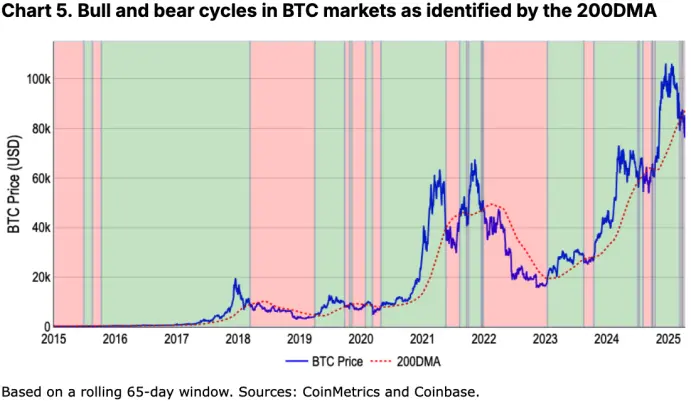
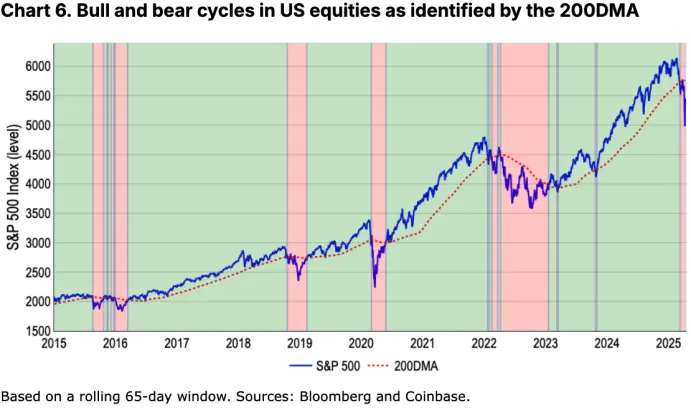
In contrast, the 200-day moving average (200DMA) offers a simpler, more robust method for identifying sustained market trends. Because it is based on longer-term data, it effectively smooths out short-term noise and adapts promptly to recent price action, delivering clearer momentum signals.
The interpretation is straightforward:
-
When prices consistently trade above the 200DMA with positive momentum, it typically indicates a bull market;
-
When prices remain well below the 200DMA with negative momentum, it often signals the emergence of a bear market.
This approach aligns broadly with trend signals from both the "20% rule" and z-score models while enhancing practicality and forward-looking insight in dynamic environments. For example, it successfully captured critical downturns such as the early stages of the pandemic in 2020, the Fed’s rate-hiking cycle from 2022 to 2023, the 2018–2019 crypto winter, and the 2021 correction triggered by China’s mining ban.
In our view, this method not only aligns with broad trend signals from the "20% rule" and z-score models but also improves the precision of actionable insights in fast-moving markets.
Additionally, we find that the 200DMA better captures extreme shifts in investor sentiment across different periods. See Charts 5 and 6.
Crypto Winter?
Are we now entering a crypto bear market? Our previous analysis has focused primarily on Bitcoin due to its sufficient historical data, enabling meaningful comparisons with traditional markets like U.S. equities. However, as the crypto asset class expands into emerging sectors (e.g., meme coins, DeFi, DePIN, AI agents), Bitcoin alone increasingly fails to represent overall market dynamics.
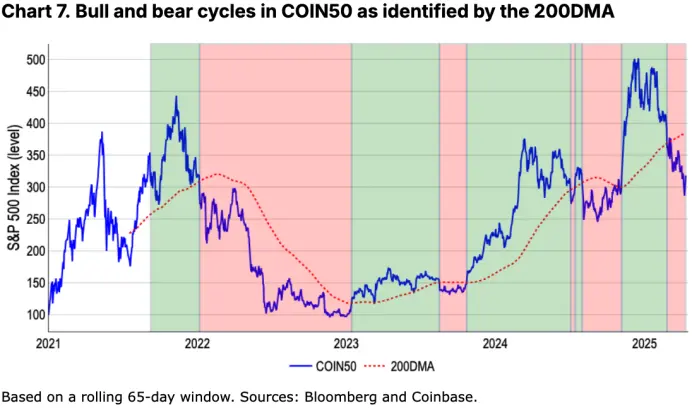
For instance, Bitcoin’s 200DMA model indicates that its sharp pullback since late March has placed it firmly in bear territory. Applying the same model to the COIN50 Index (which tracks the top 50 tokens by market cap) reveals that these assets collectively entered a bear market as early as late February. This aligns with the 41% decline in the total market cap of non-Bitcoin cryptocurrencies—from $1.6 trillion in December 2024 to $950 billion today—while Bitcoin’s decline over the same period remains below 20%. This divergence highlights the higher volatility and risk premium embedded in altcoins at the tail end of the risk curve.
Conclusion
As Bitcoin strengthens its role as a "store of value," we believe a more systematic and comprehensive framework is needed to evaluate the overall crypto market and accurately determine its bull or bear status—especially amid growing asset diversity. Nonetheless, both Bitcoin and the COIN50 Index have now fallen below their respective 200DMAs, signaling that the market may be in the early stages of a prolonged downtrend. This corresponds with declining market capitalization and shrinking venture investment—key hallmarks suggesting an impending "crypto winter."
Therefore, we recommend maintaining a defensive risk management posture at present. While we still anticipate that crypto asset prices may stabilize by the latter half of Q2 2025, laying the groundwork for improvement in Q3, the current complex macro backdrop demands continued vigilance from investors.
Join TechFlow official community to stay tuned
Telegram:https://t.me/TechFlowDaily
X (Twitter):https://x.com/TechFlowPost
X (Twitter) EN:https://x.com/BlockFlow_News