Bull Market Detection 01 | AICoin & Bitget Research: Analyzing Key Bull Market Indicators, How to Bottom-Pick and Top-Exit?
TechFlow Selected TechFlow Selected
Bull Market Detection 01 | AICoin & Bitget Research: Analyzing Key Bull Market Indicators, How to Bottom-Pick and Top-Exit?
Buy opportunities can be captured through OBV bottom divergence signals for timing the market bottom, while sell opportunities for topping out can be considered via OBV top divergence signals by reducing positions or closing positions.
 Navigating Web3 tides with focused insights
In the volatile cryptocurrency market, investors often struggle with timing the bottom and exiting at the top. To help investors seize key opportunities during bull markets, AICoin Research Institute and Bitget Research Institute have jointly conducted a series of classic strategy studies, aiming to assist users in making informed decisions through deep analysis of core indicators and avoiding blind operations.
In this study, we focus on an important yet frequently overlooked indicator: OBV (On-Balance Volume). By combining trading volume with price movements, OBV offers an alternative perspective for interpreting market trends. Its uniqueness lies in not relying solely on price changes but incorporating volume shifts, thereby providing signals for potential trend reversals. Both AICoin and Bitget platforms support the OBV indicator within their K-line charts, aiding investors in investment analysis.
Overall, OBV has several classic applications: confirming trends, timing exits and entries, identifying institutional behavior. It is often used alongside moving averages to predict market movements, combined with price moving averages to identify key breakout points, or paired with volume moving averages to detect institutional accumulation.
1. Usage Methods
(1) Confirming Trends
● Uptrend: When OBV rises along with rising prices, it indicates strong bullish momentum;
● Downtrend: When OBV falls as prices decline, it reflects strong bearish pressure.
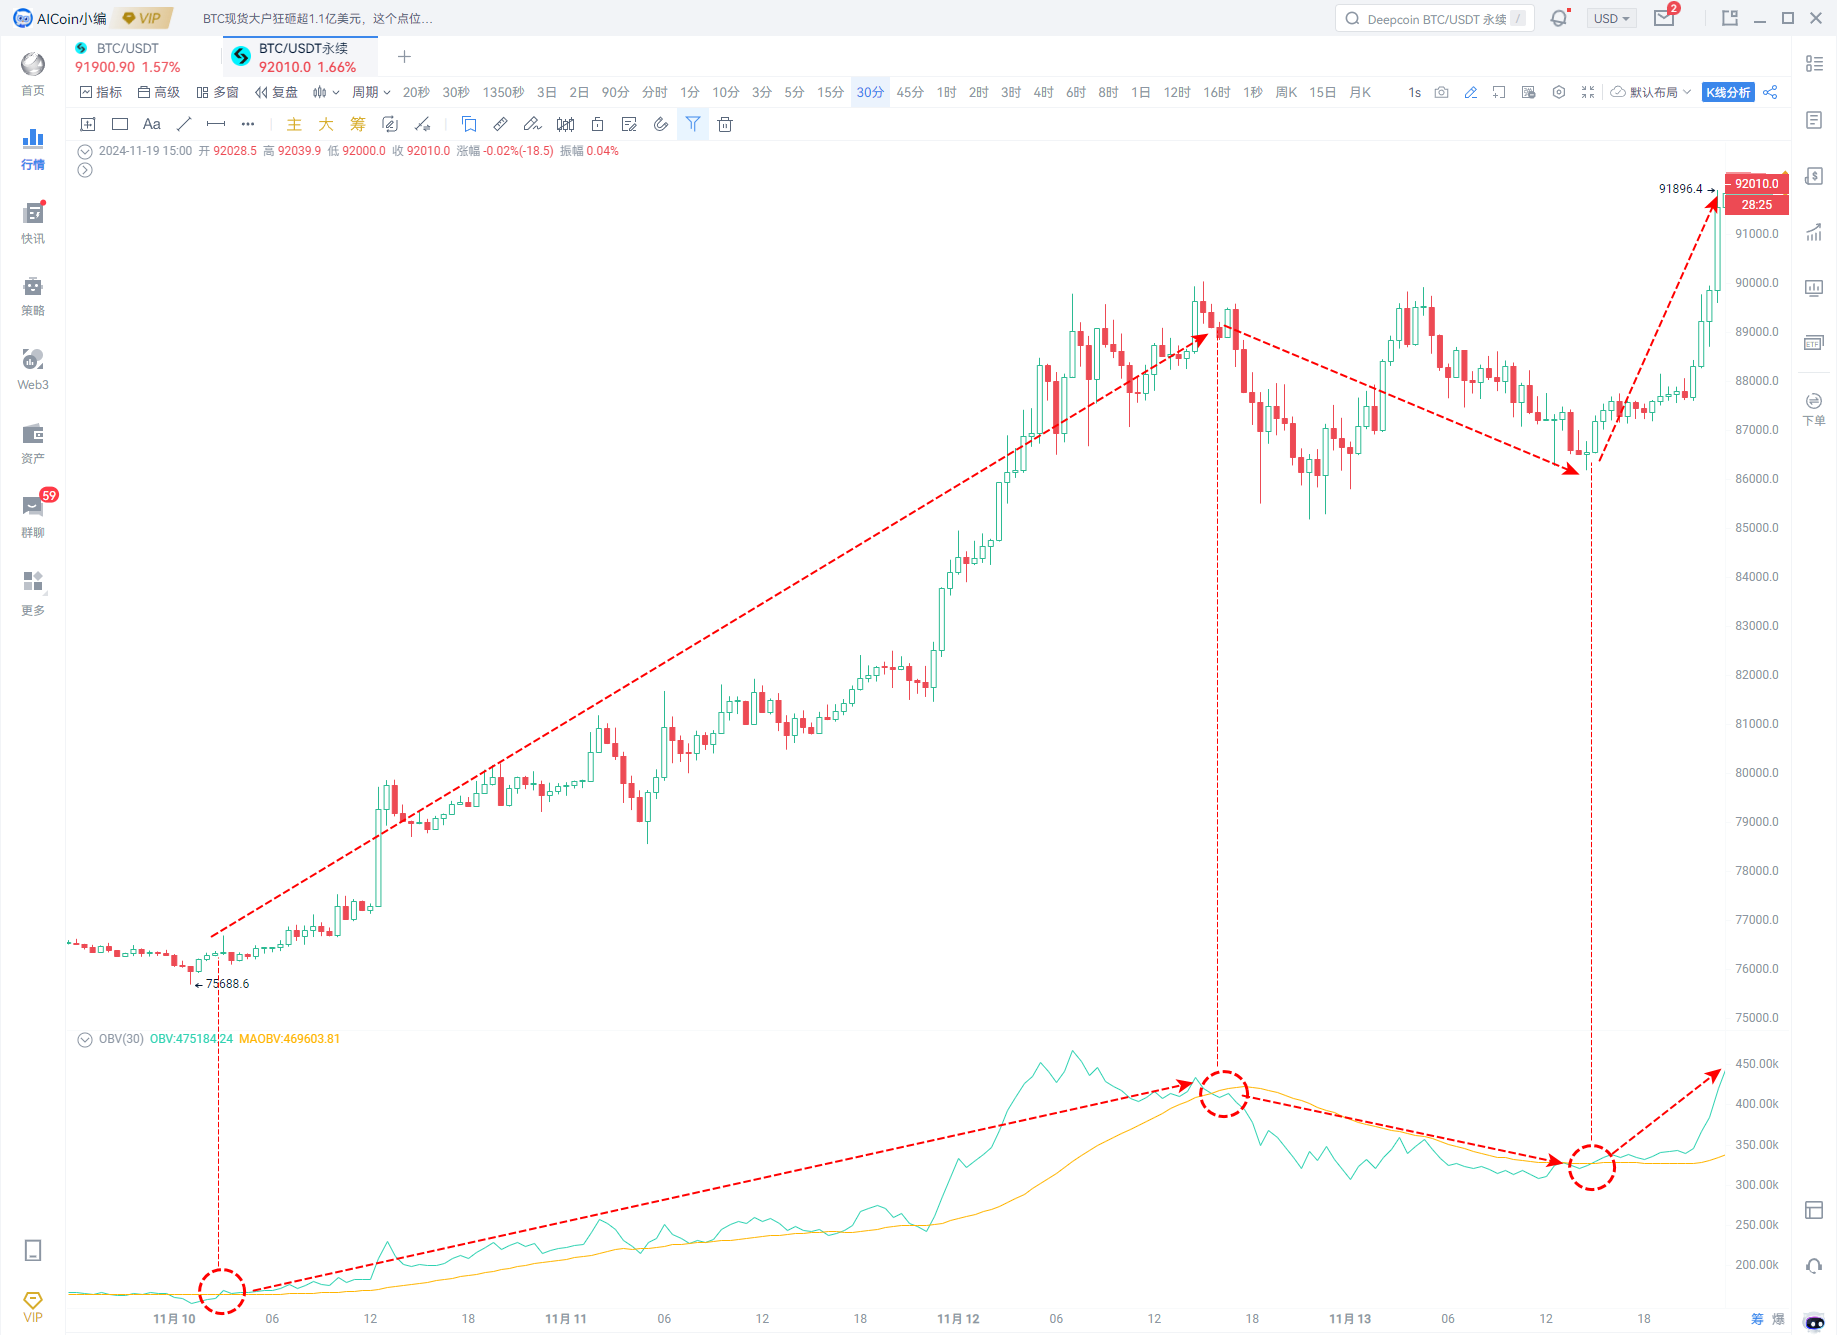
(2) Identifying Institutional Behavior
1. Institutional Pump-and-Dump
A sharp rise in the OBV line suggests that buying power is nearly exhausted—indicating institutions are driving prices up before offloading positions—and serves as a sell signal. This effect is more pronounced when occurring late in a trend.
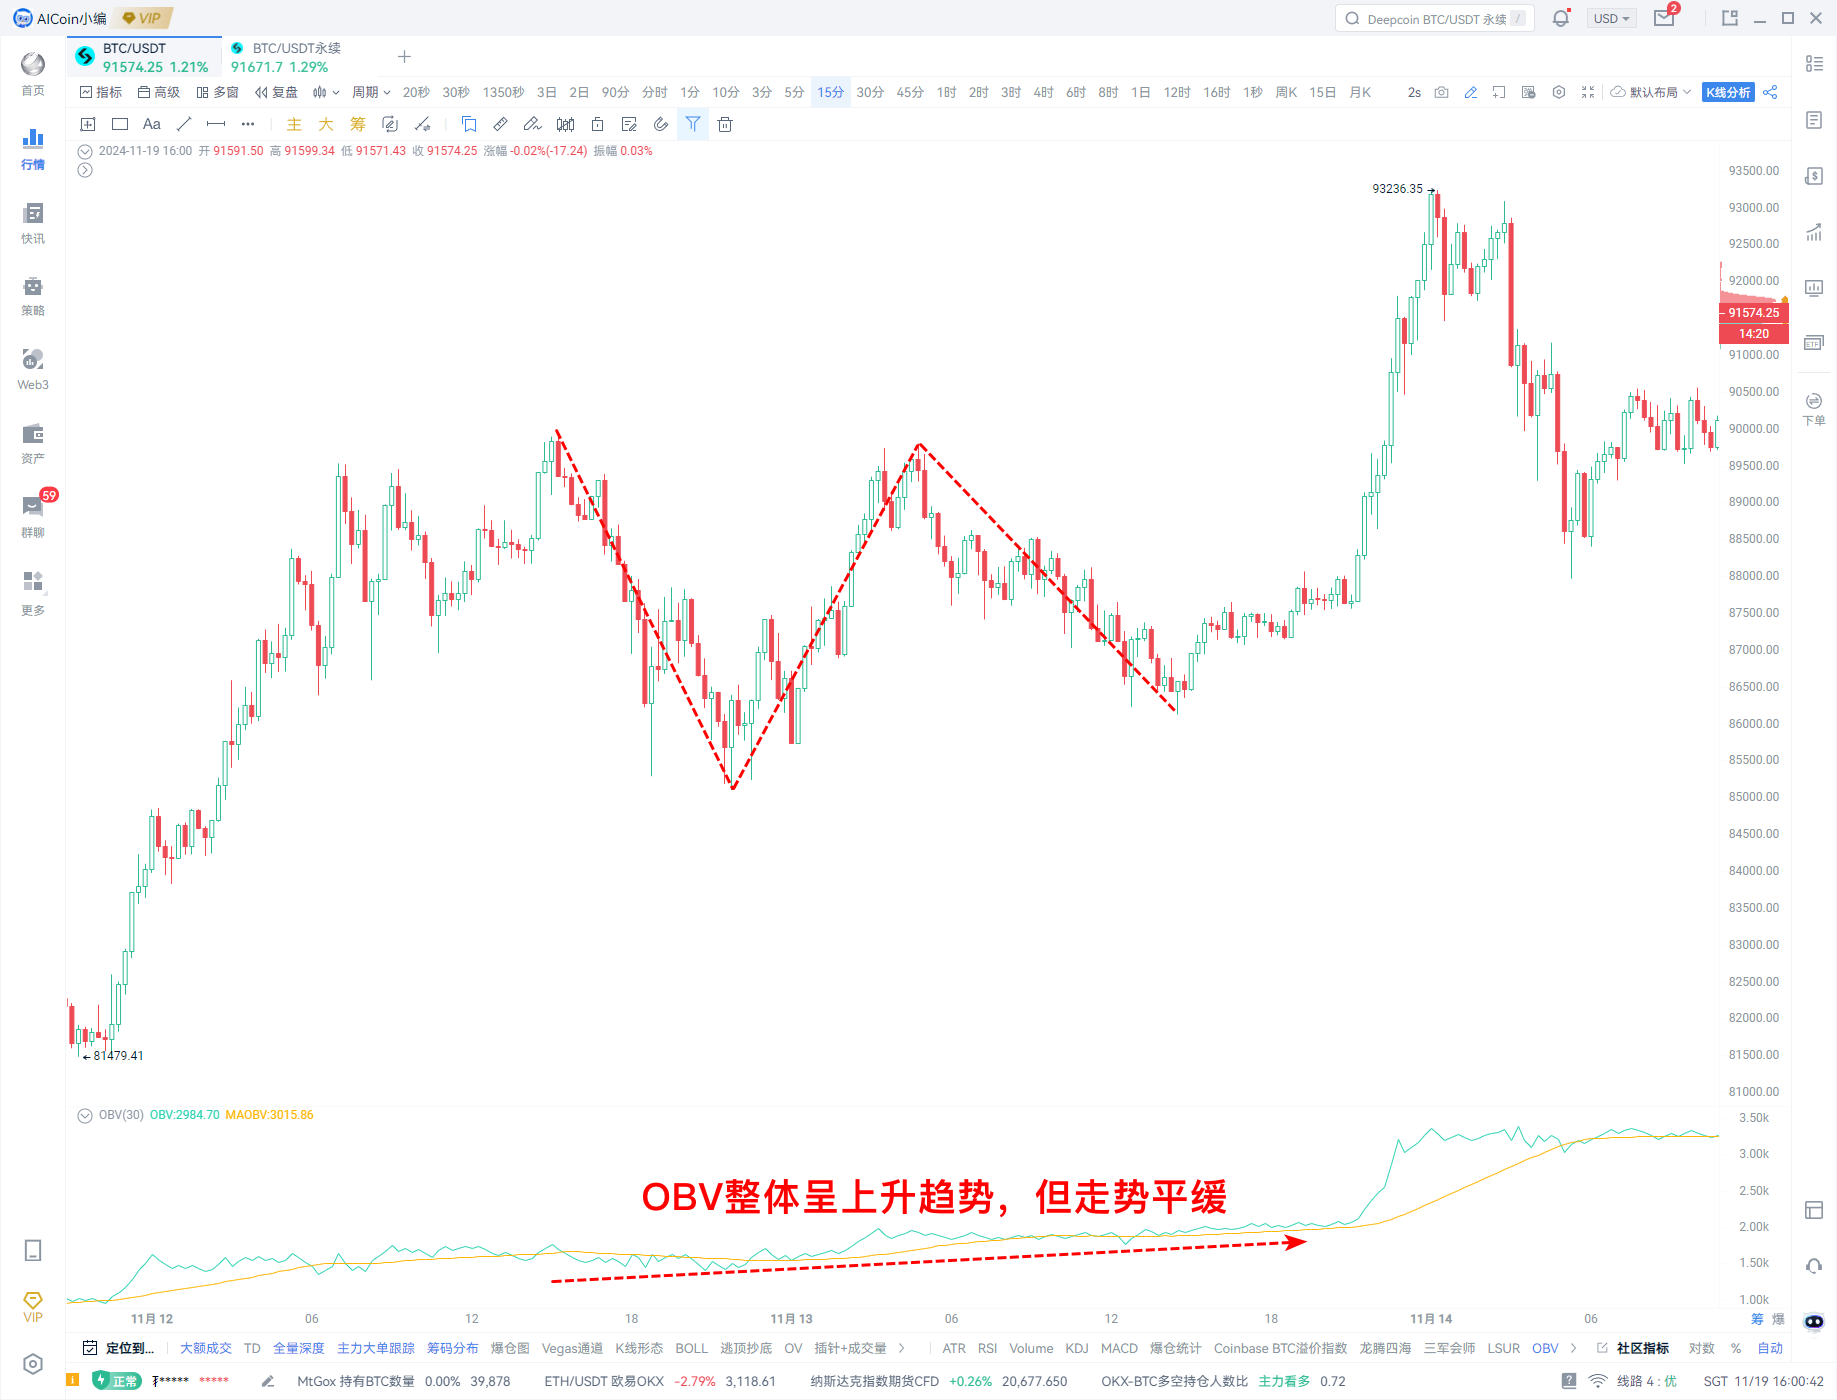
2. Institutional Price Suppression
When prices fall but OBV rises, it indicates strong buying interest, suggesting institutions are accumulating at lower levels, which may lead to a reversal and upward movement.
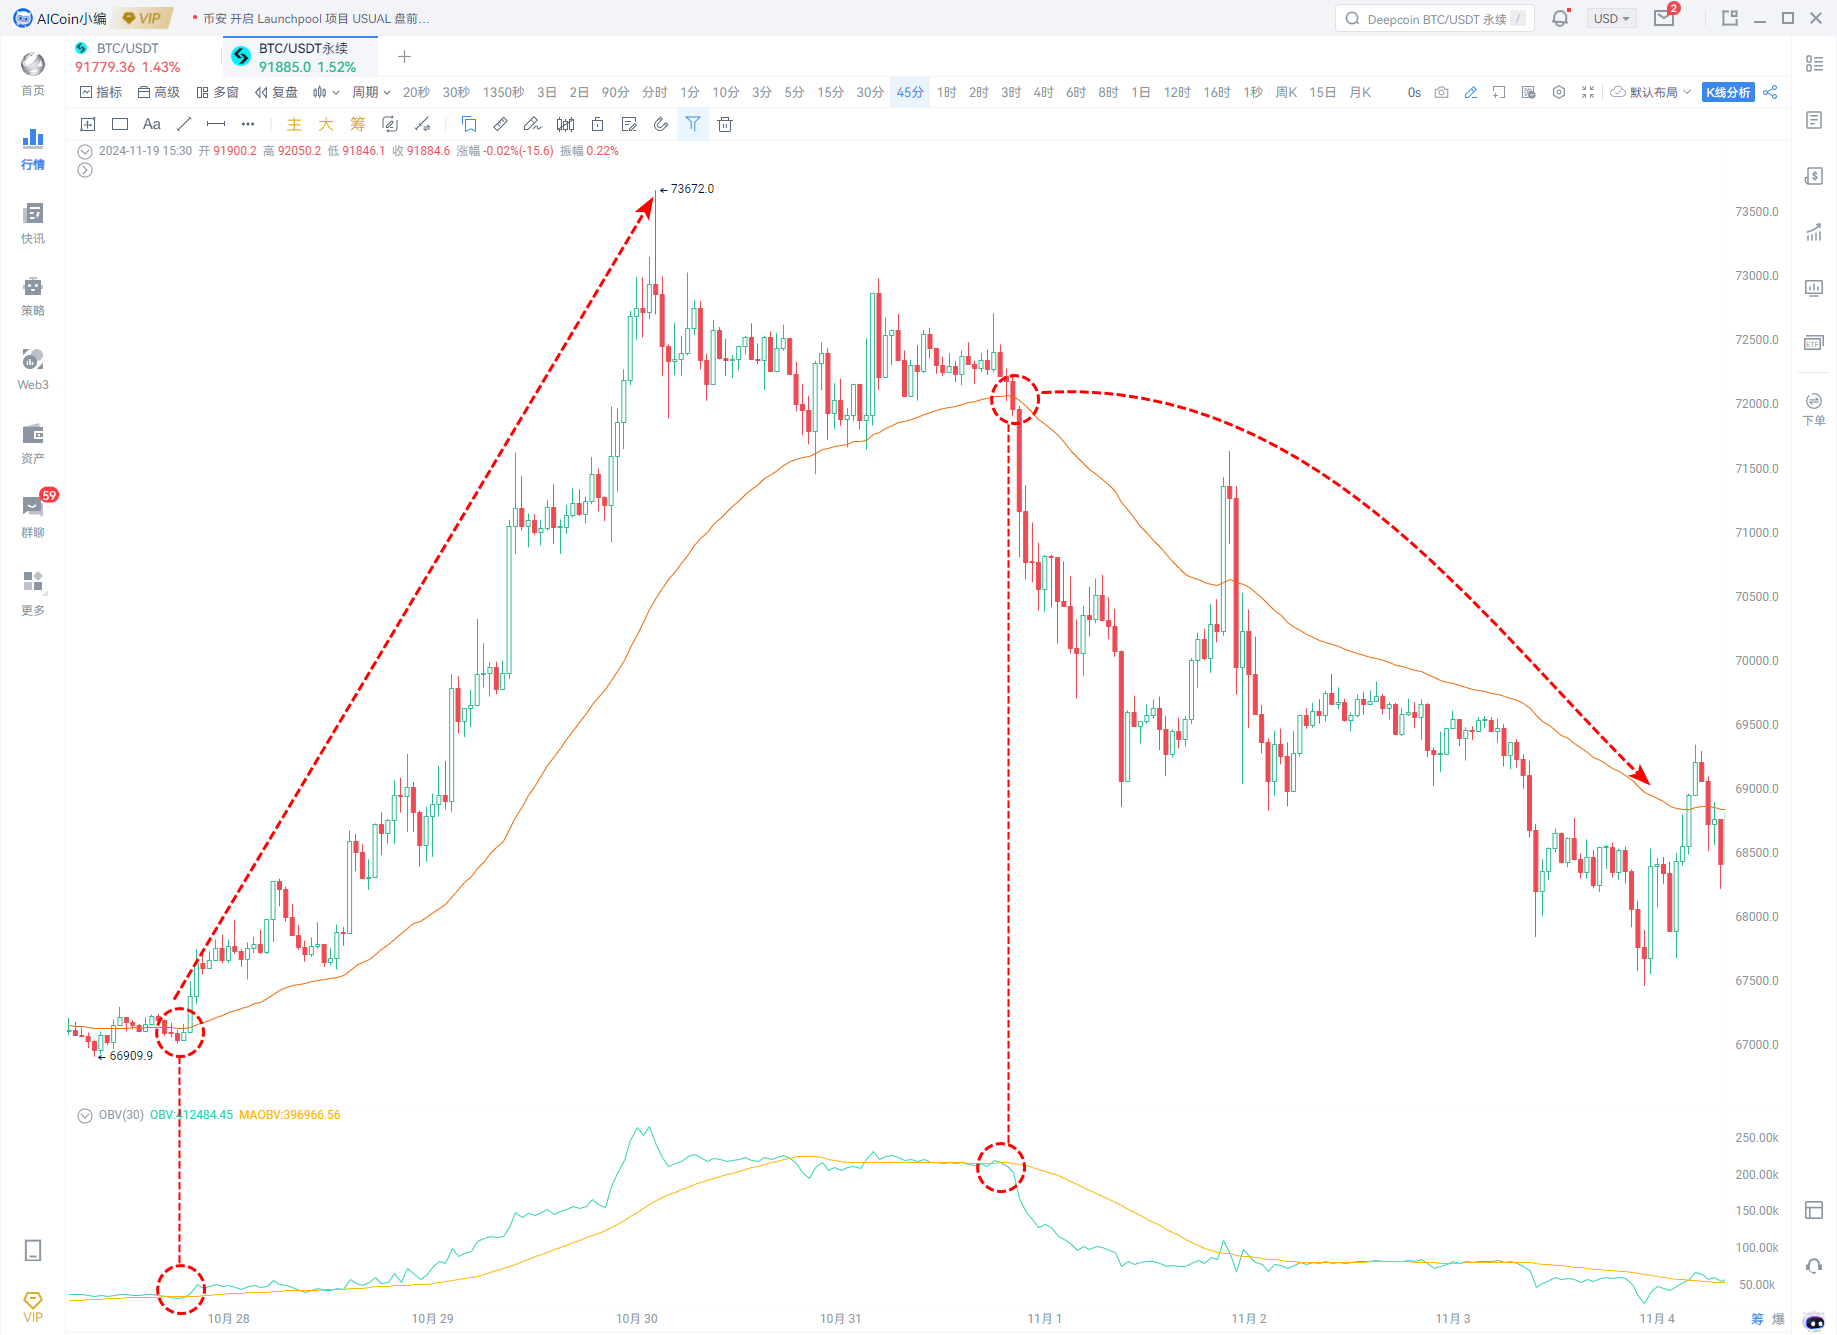
3. Institutional Washout
When the OBV line rises gradually while prices remain highly volatile, it implies increasing buyer strength and can be viewed as a buy signal.
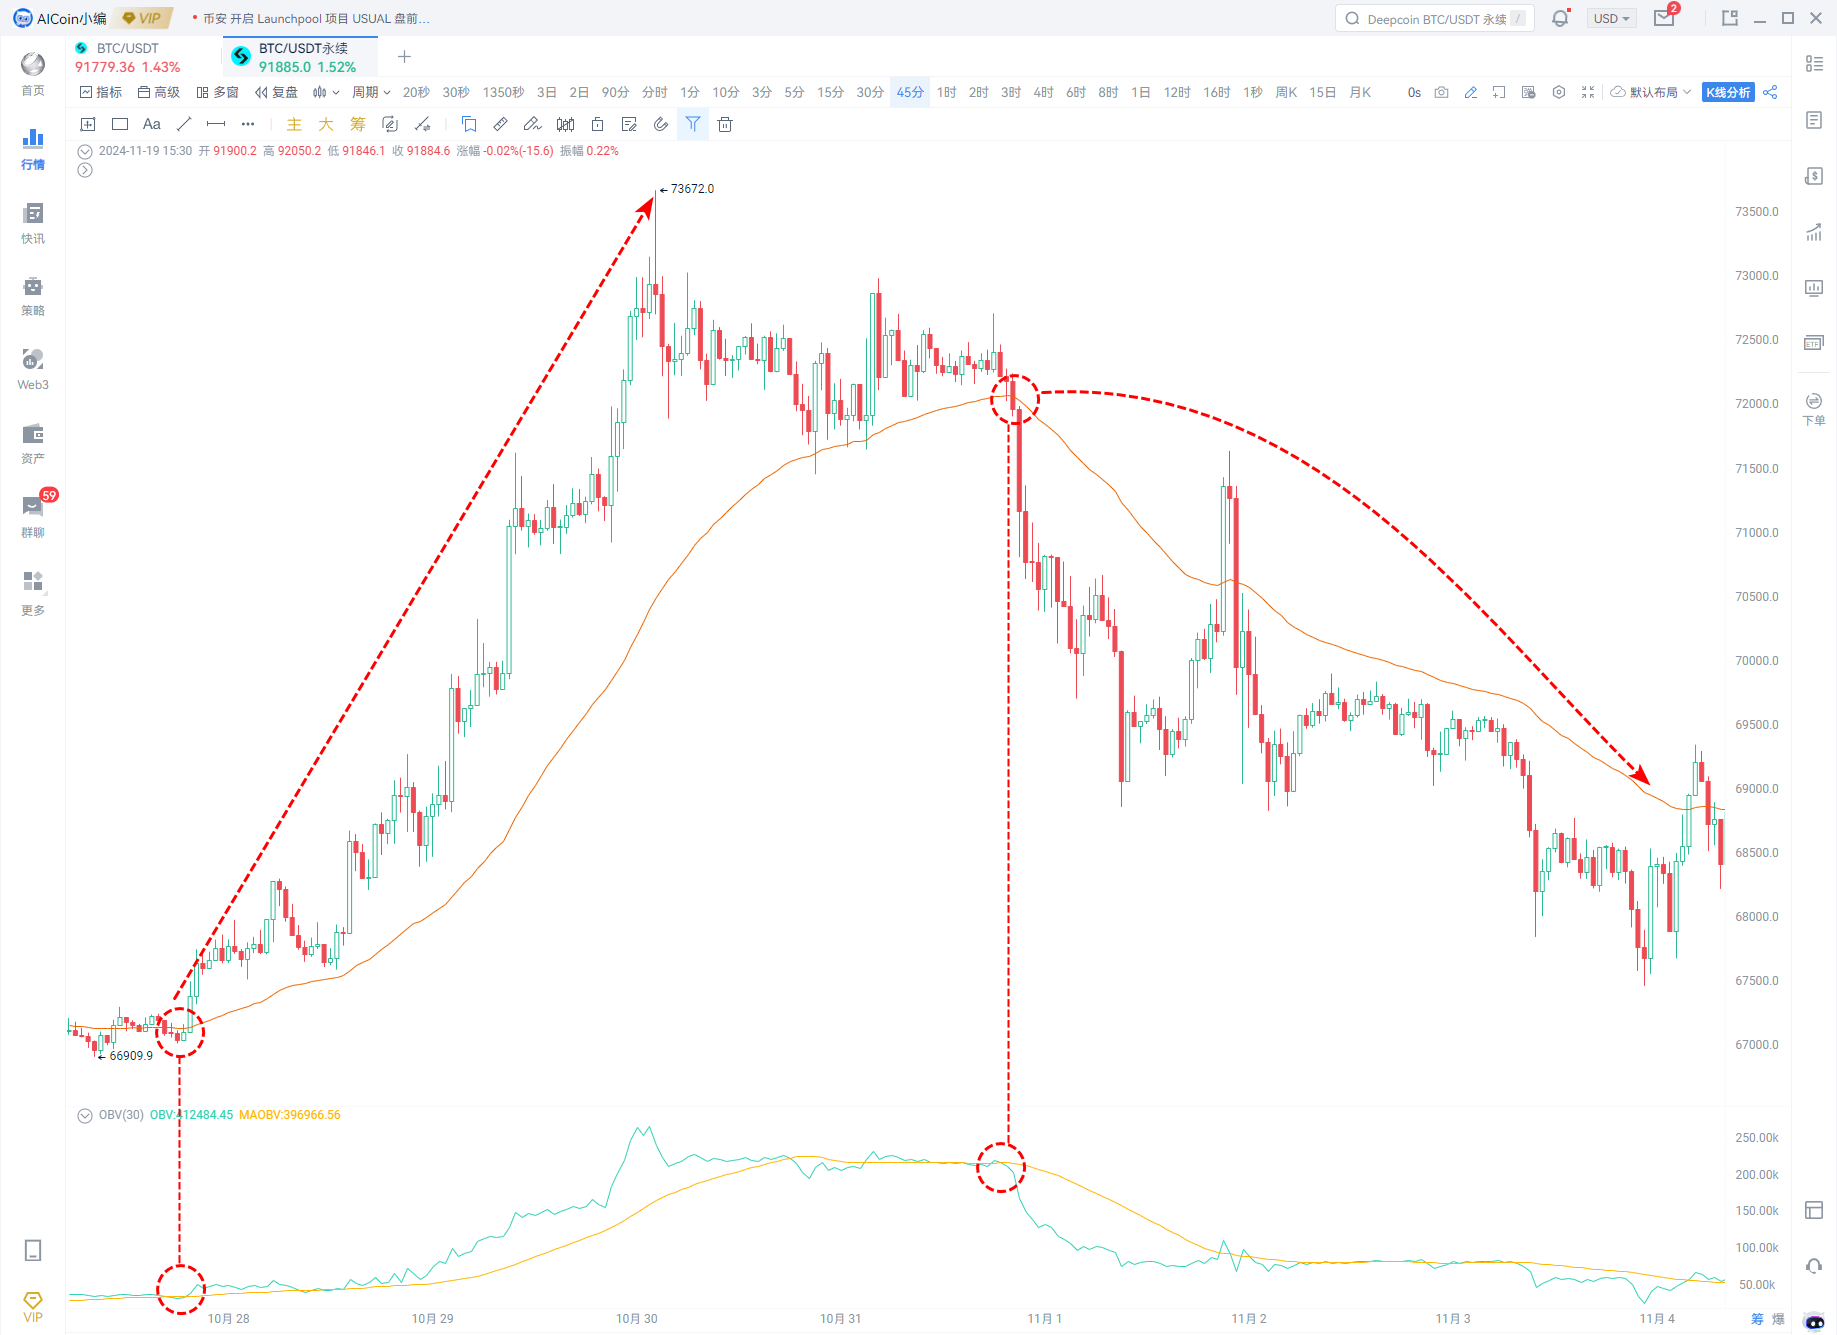
(3) Combining with Other Indicators
1. Combined with Moving Averages
Moving averages such as simple moving average (SMA) can be selected, with specific parameters adjustable based on individual preferences. Taking EMA52 + OBV as an example:
● When OBV is rising and price remains above the EMA52, it signifies a bullish trend;
● When OBV peaks and turns downward, and price breaks below and stays under the moving average, it signals a bearish trend.
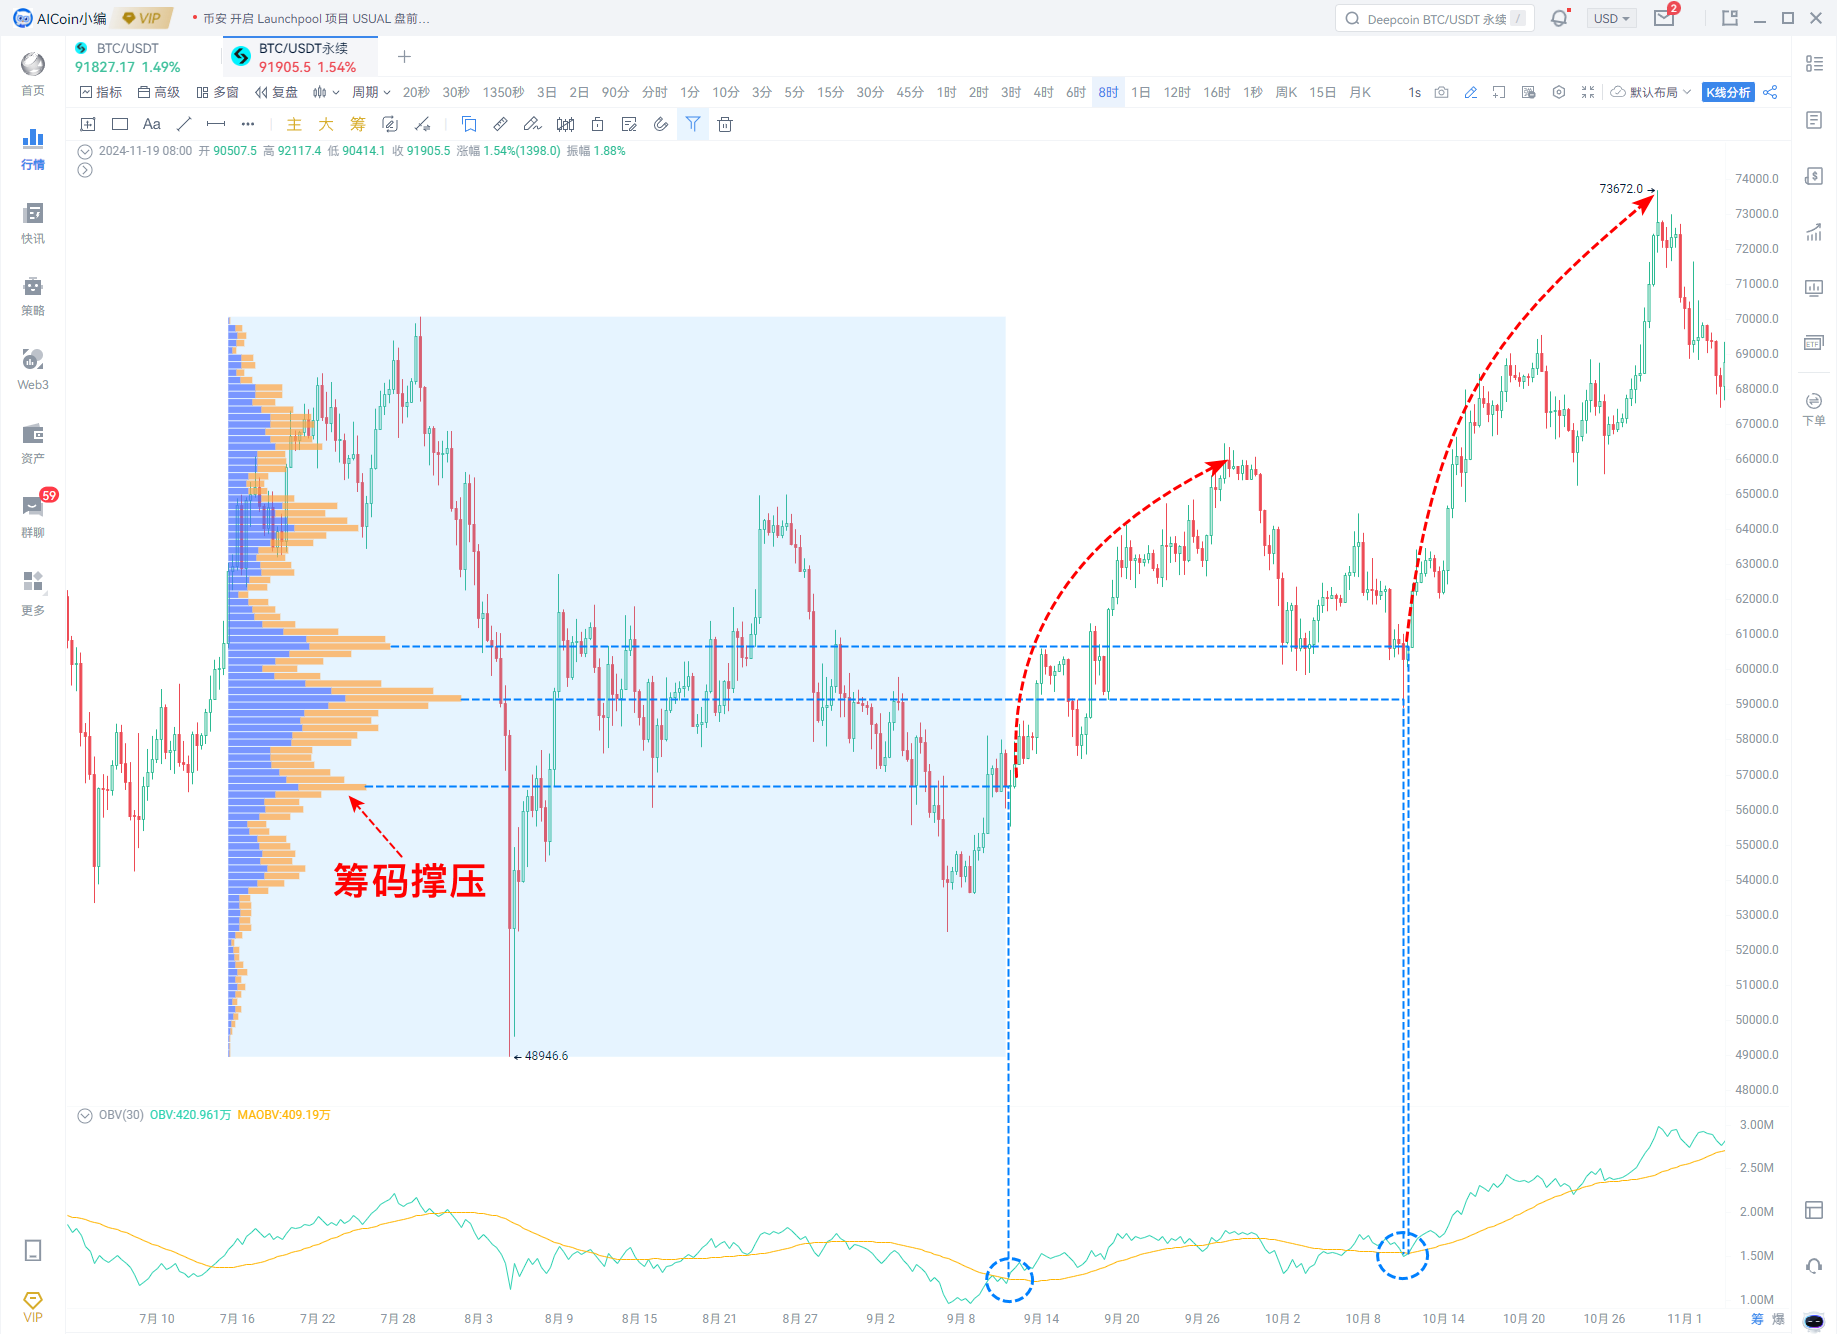
2. Breaking Key Support and Resistance Levels
● Buy Signal: When price breaks above resistance or retests support without breaking it, accompanied by an OBV breakout, this is considered a bullish signal;
● Sell Signal: When price breaks below support or fails to突破resistance, along with OBV breaking down, this is seen as a bearish signal.
3. Combined with Trading Volume
a. Volume
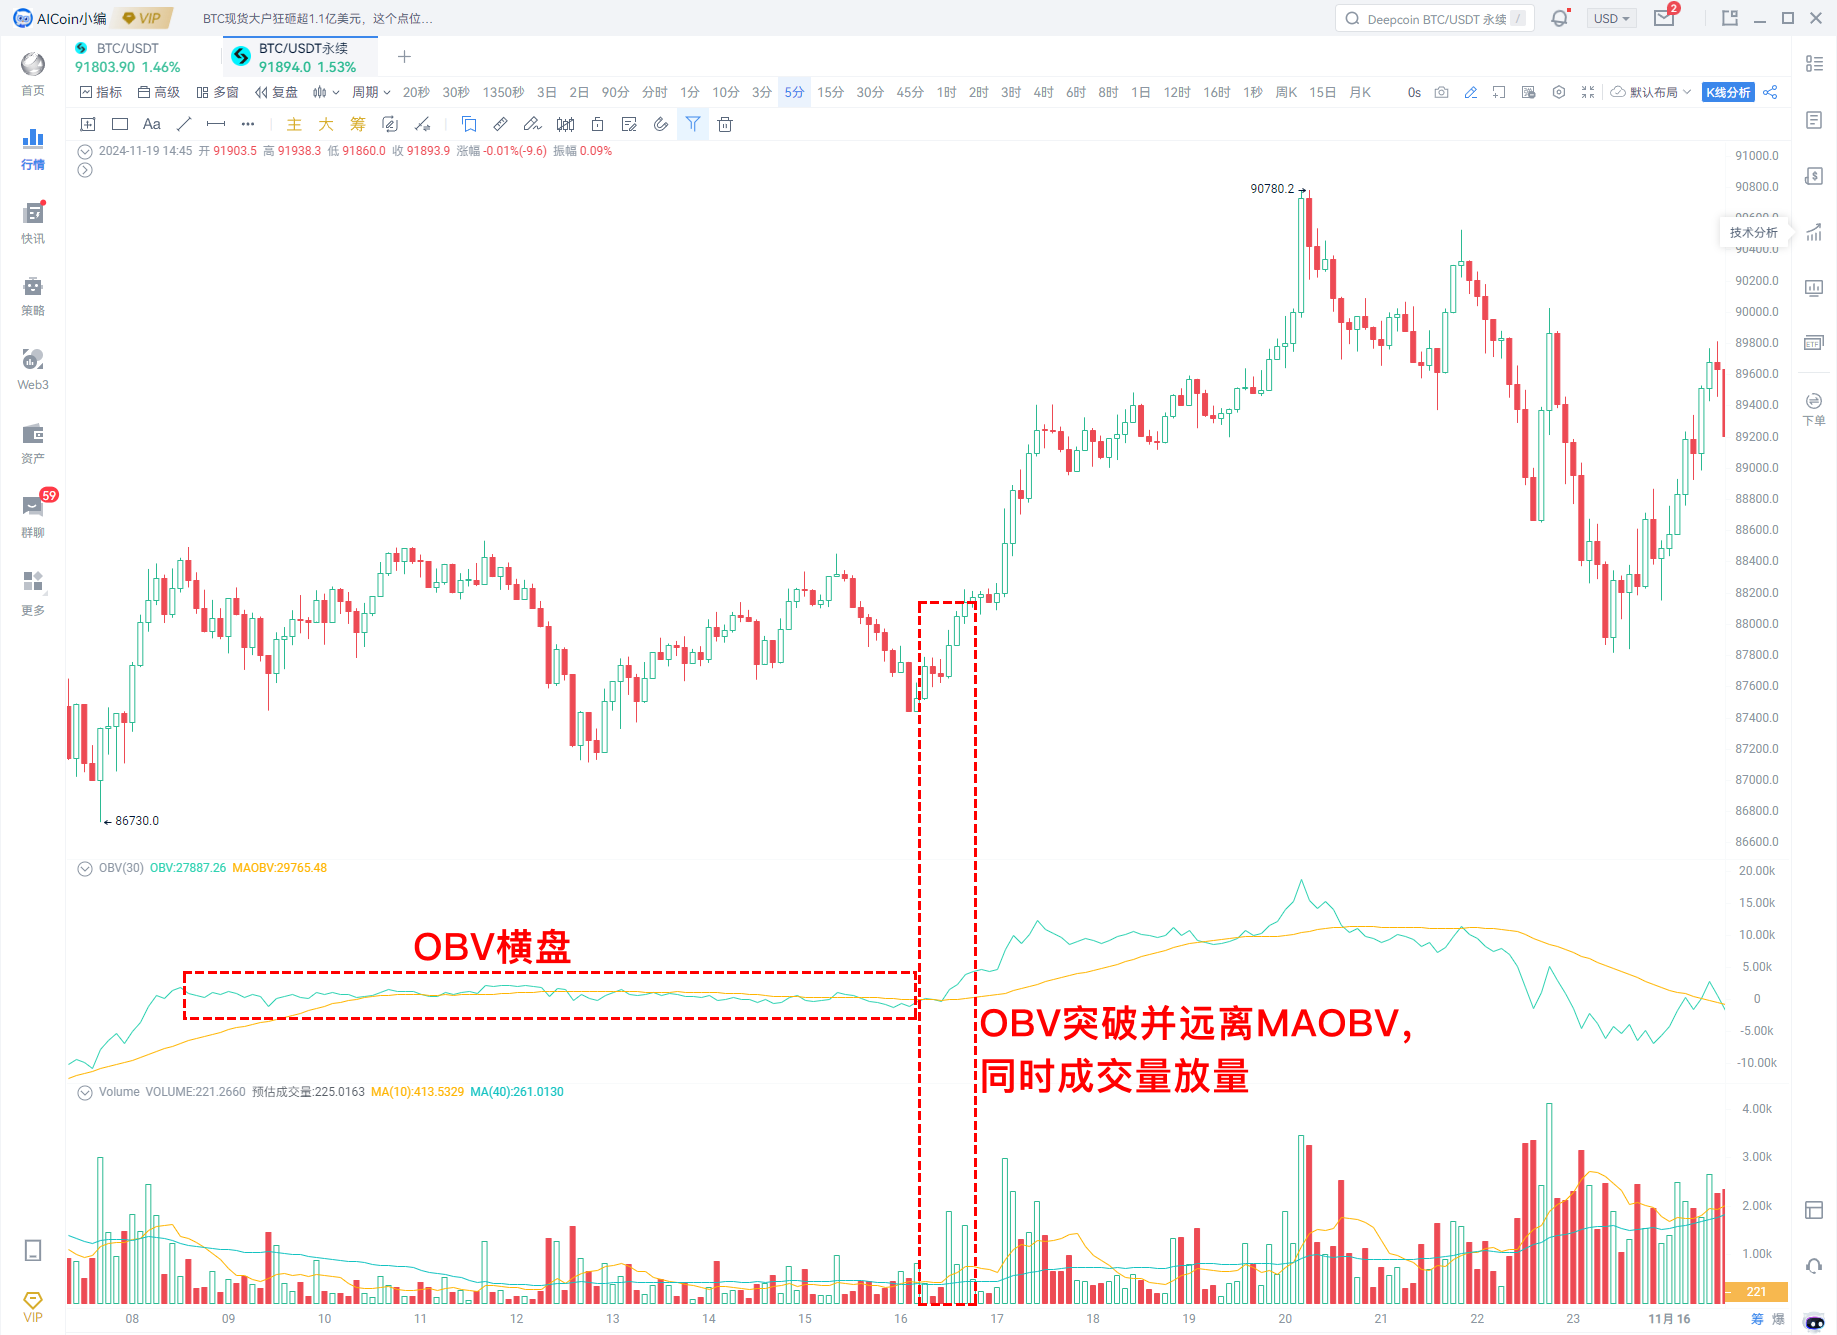
After a period of OBV consolidation, if OBV breaks above its moving average (MAOBV) and volume surges, it presents an excellent buying opportunity.
b. Volume Moving Average
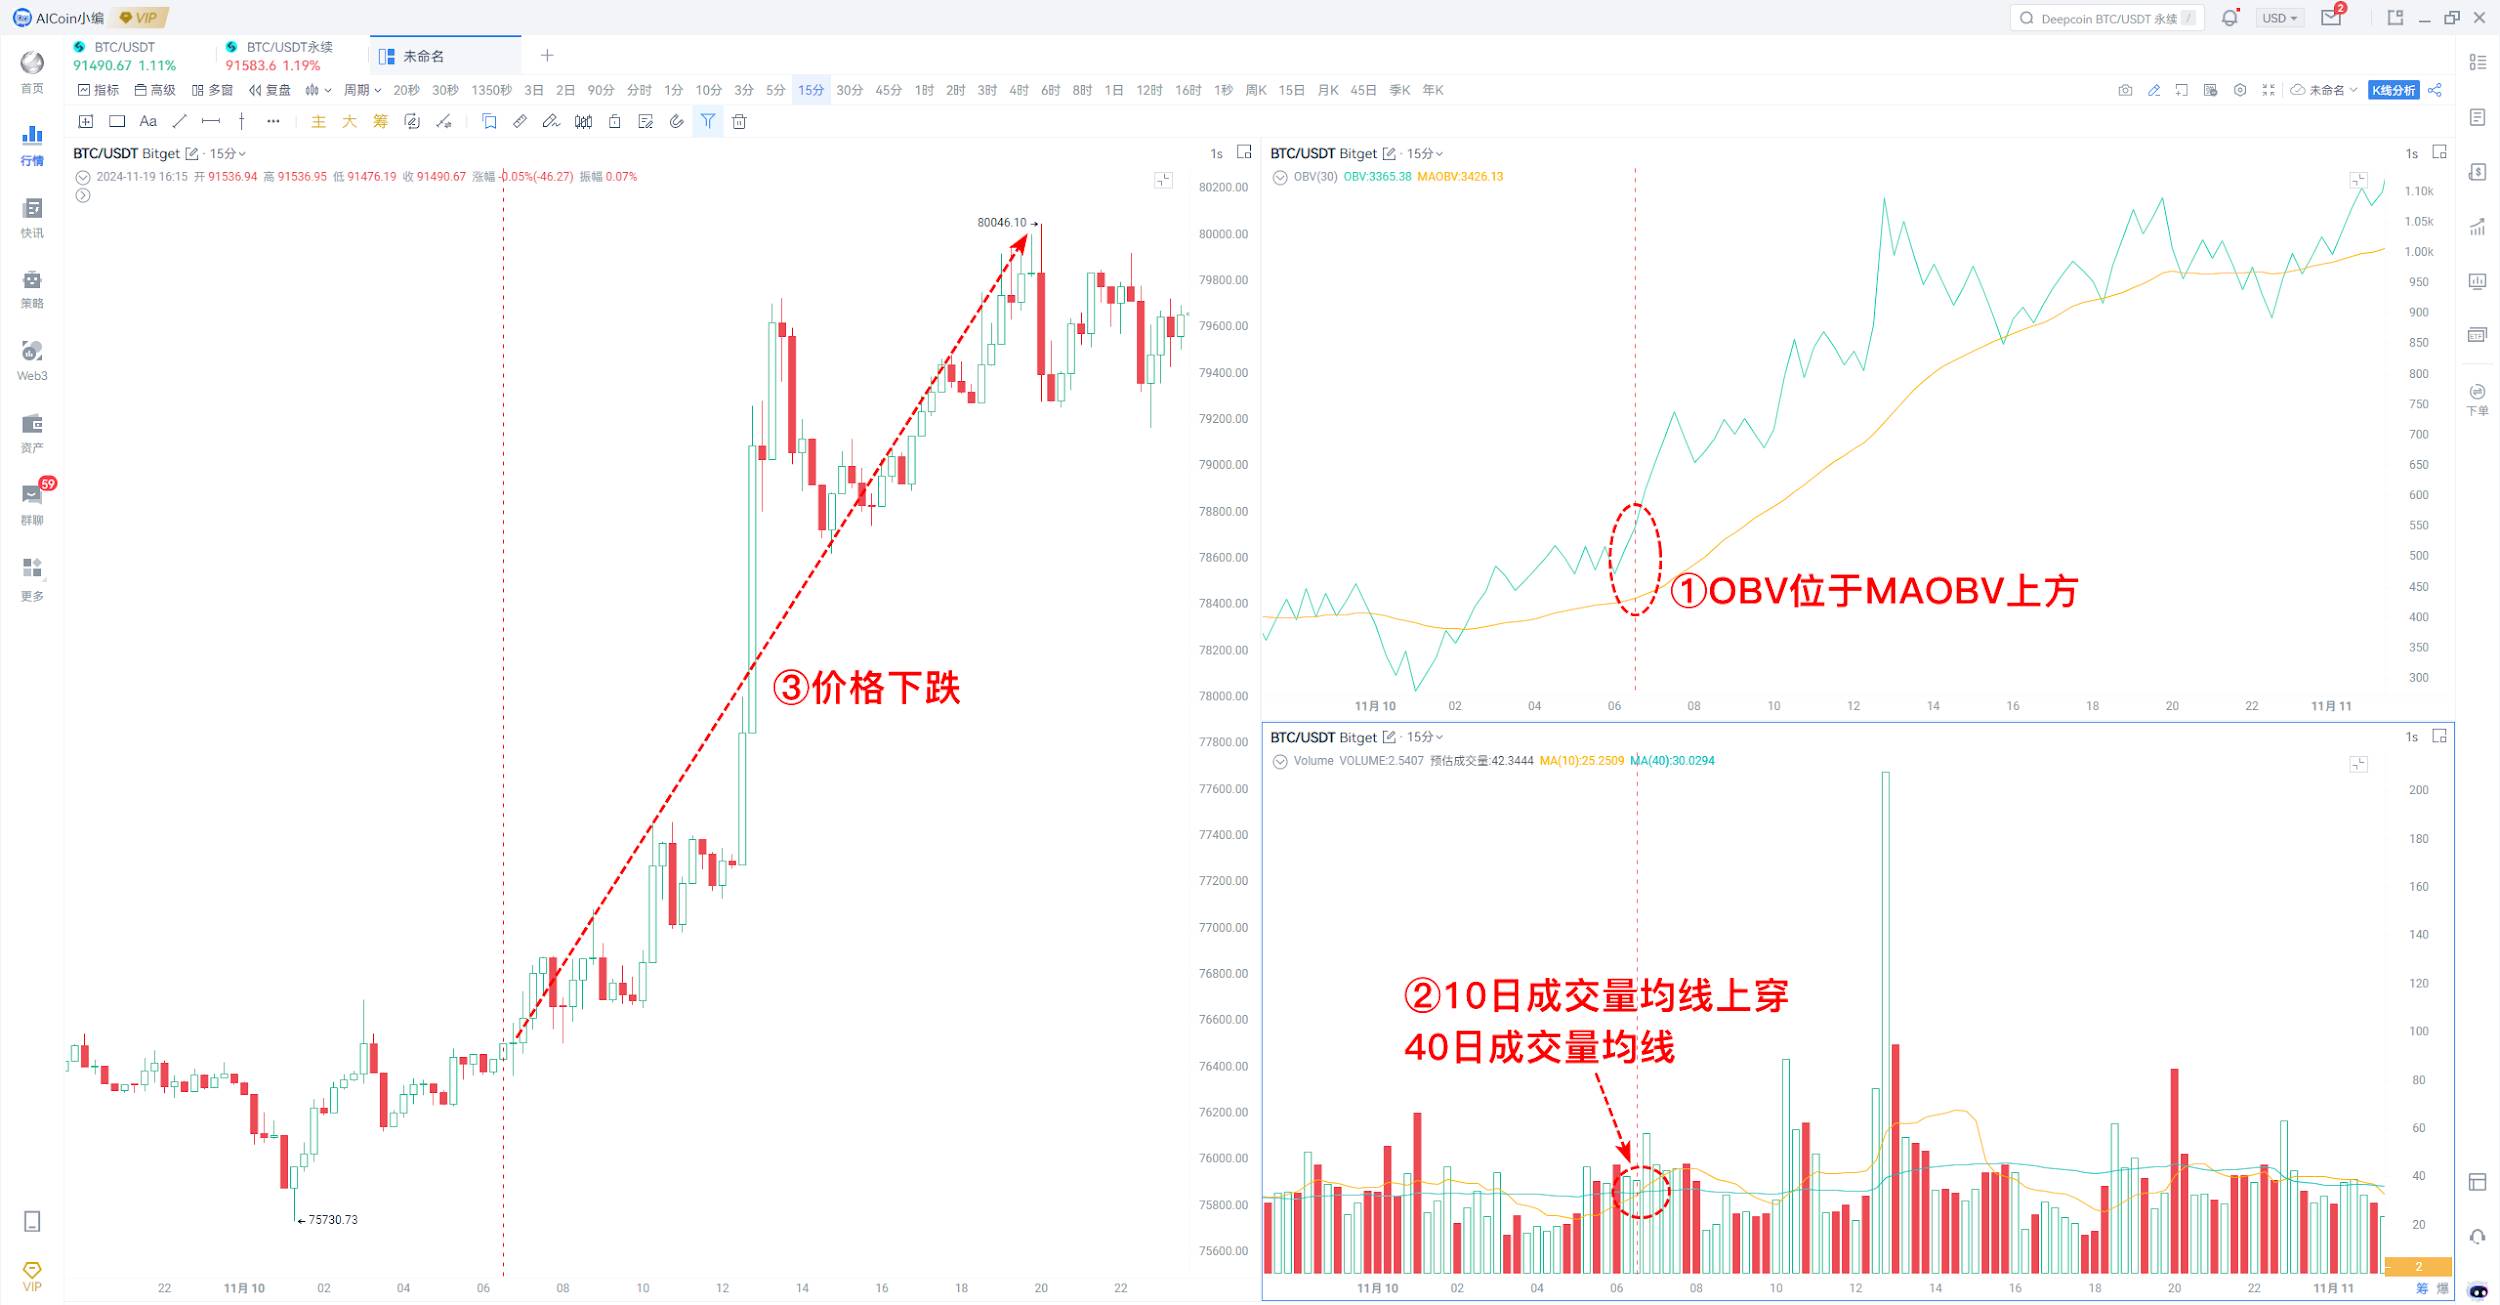
The volume moving average can use MA10 and MA40, though parameters may vary based on personal preference.
● Buy Signal: OBV is rising, and the 10-day volume crosses above the 40-day volume line.
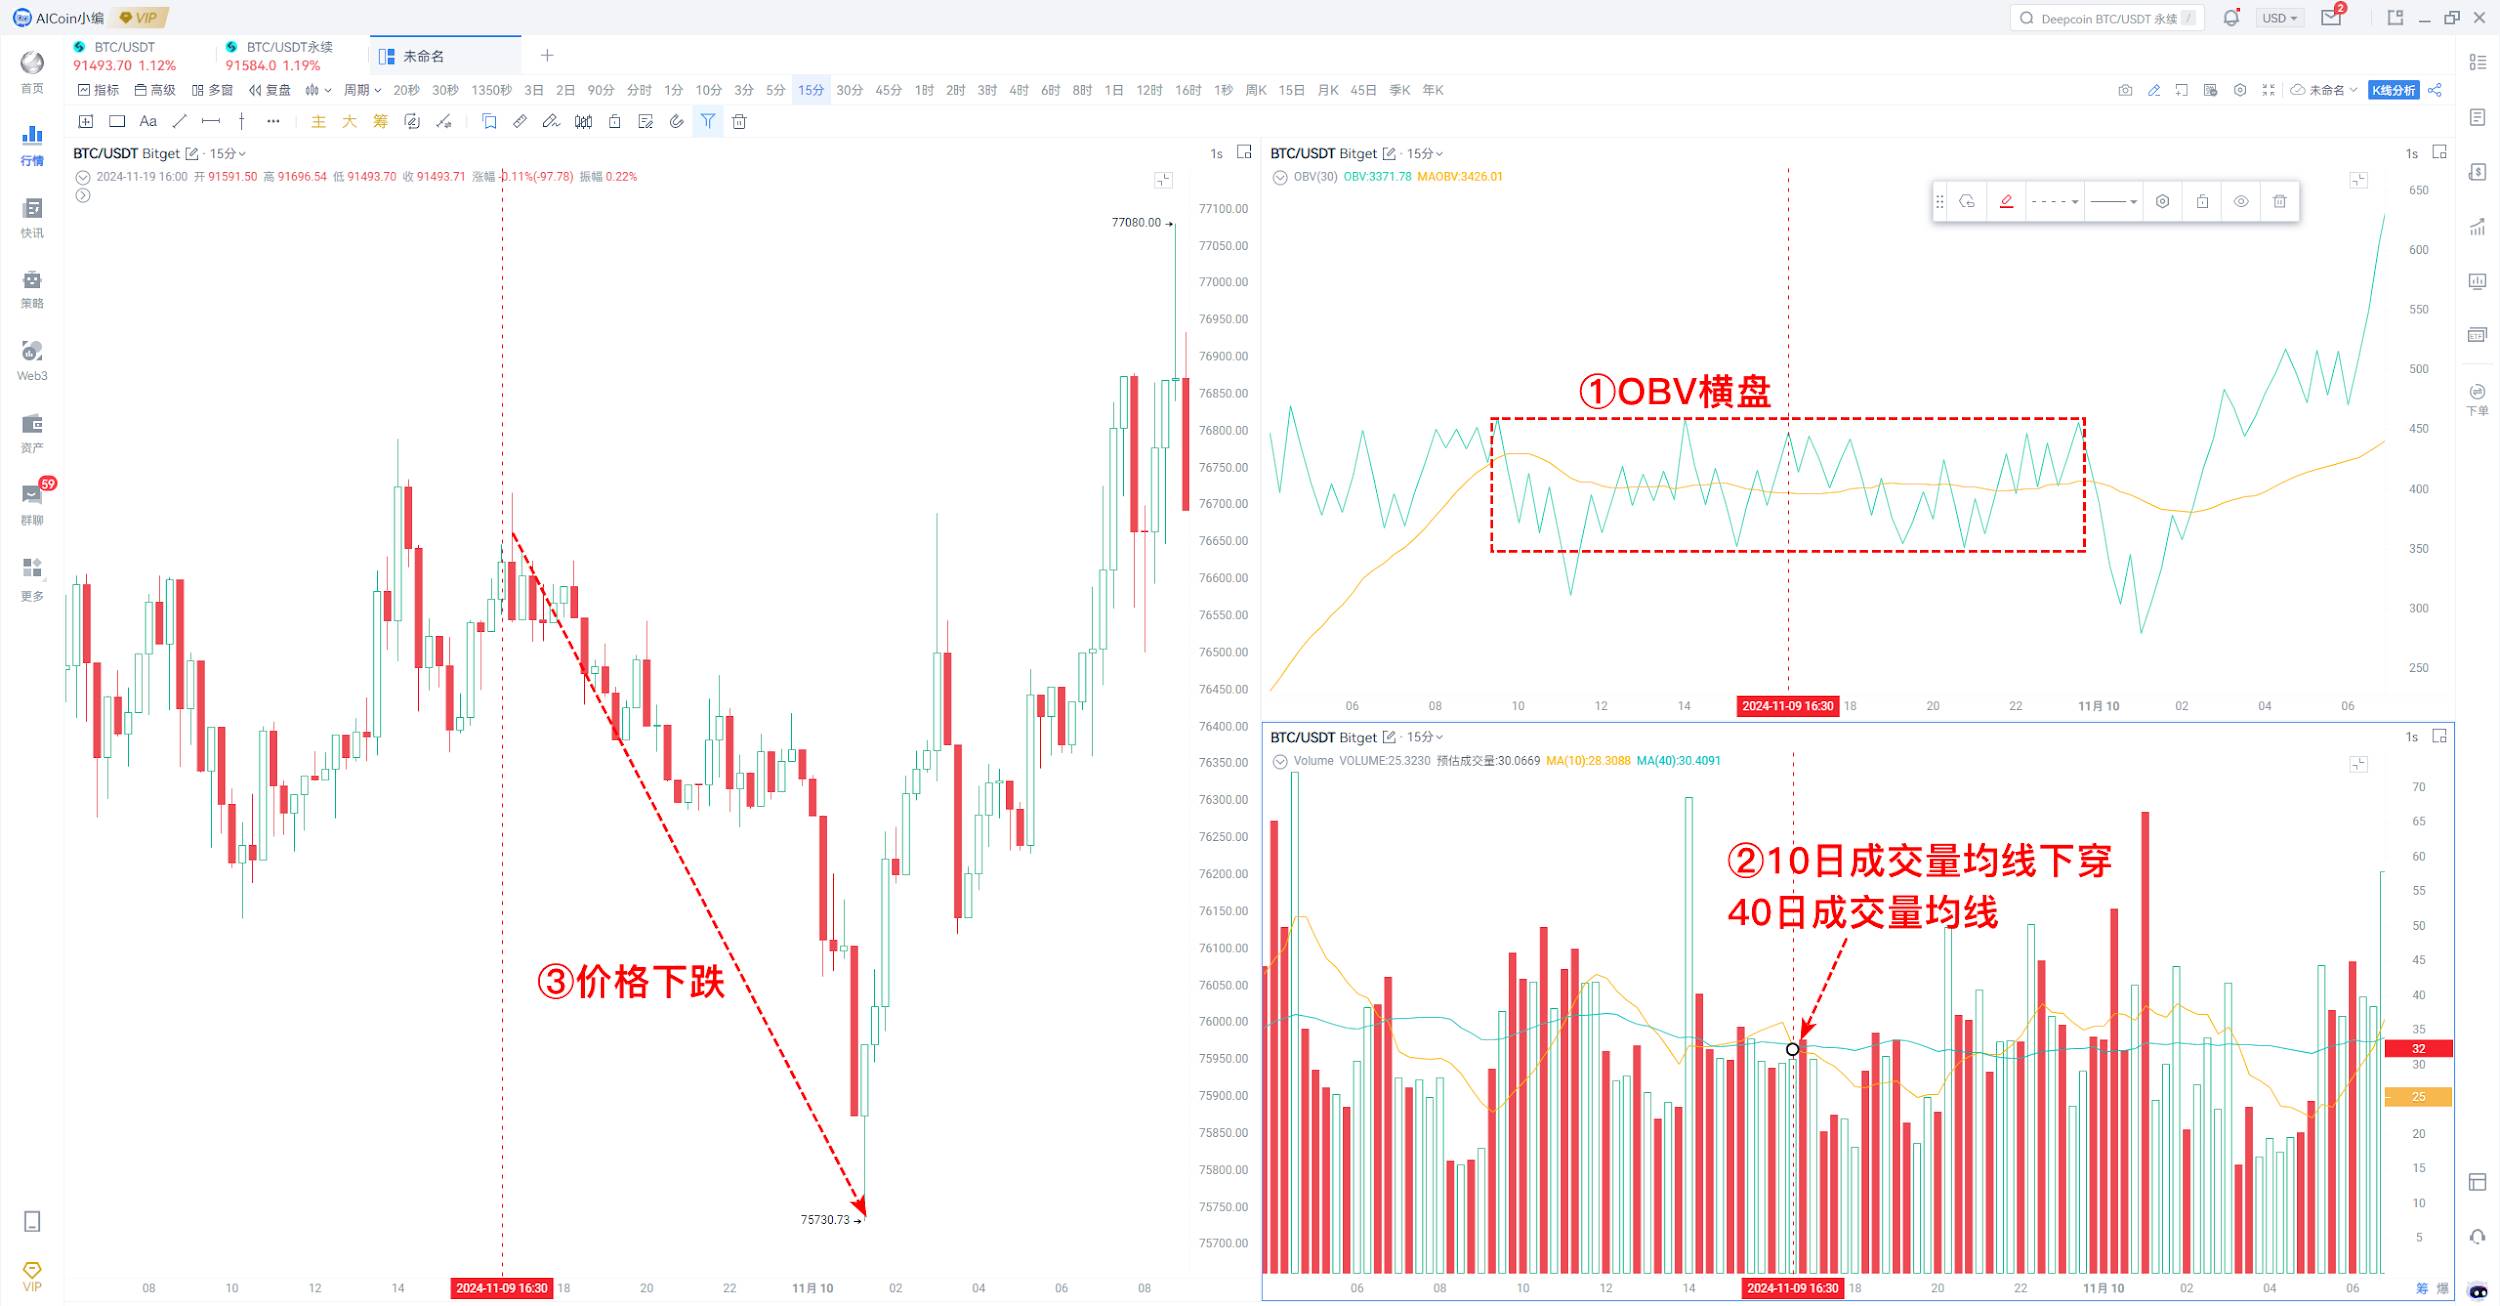
● Sell Signal: OBV shows no clear trend, and the 10-day volume crosses below the 40-day volume line.
2. Timing Market Tops and Bottoms
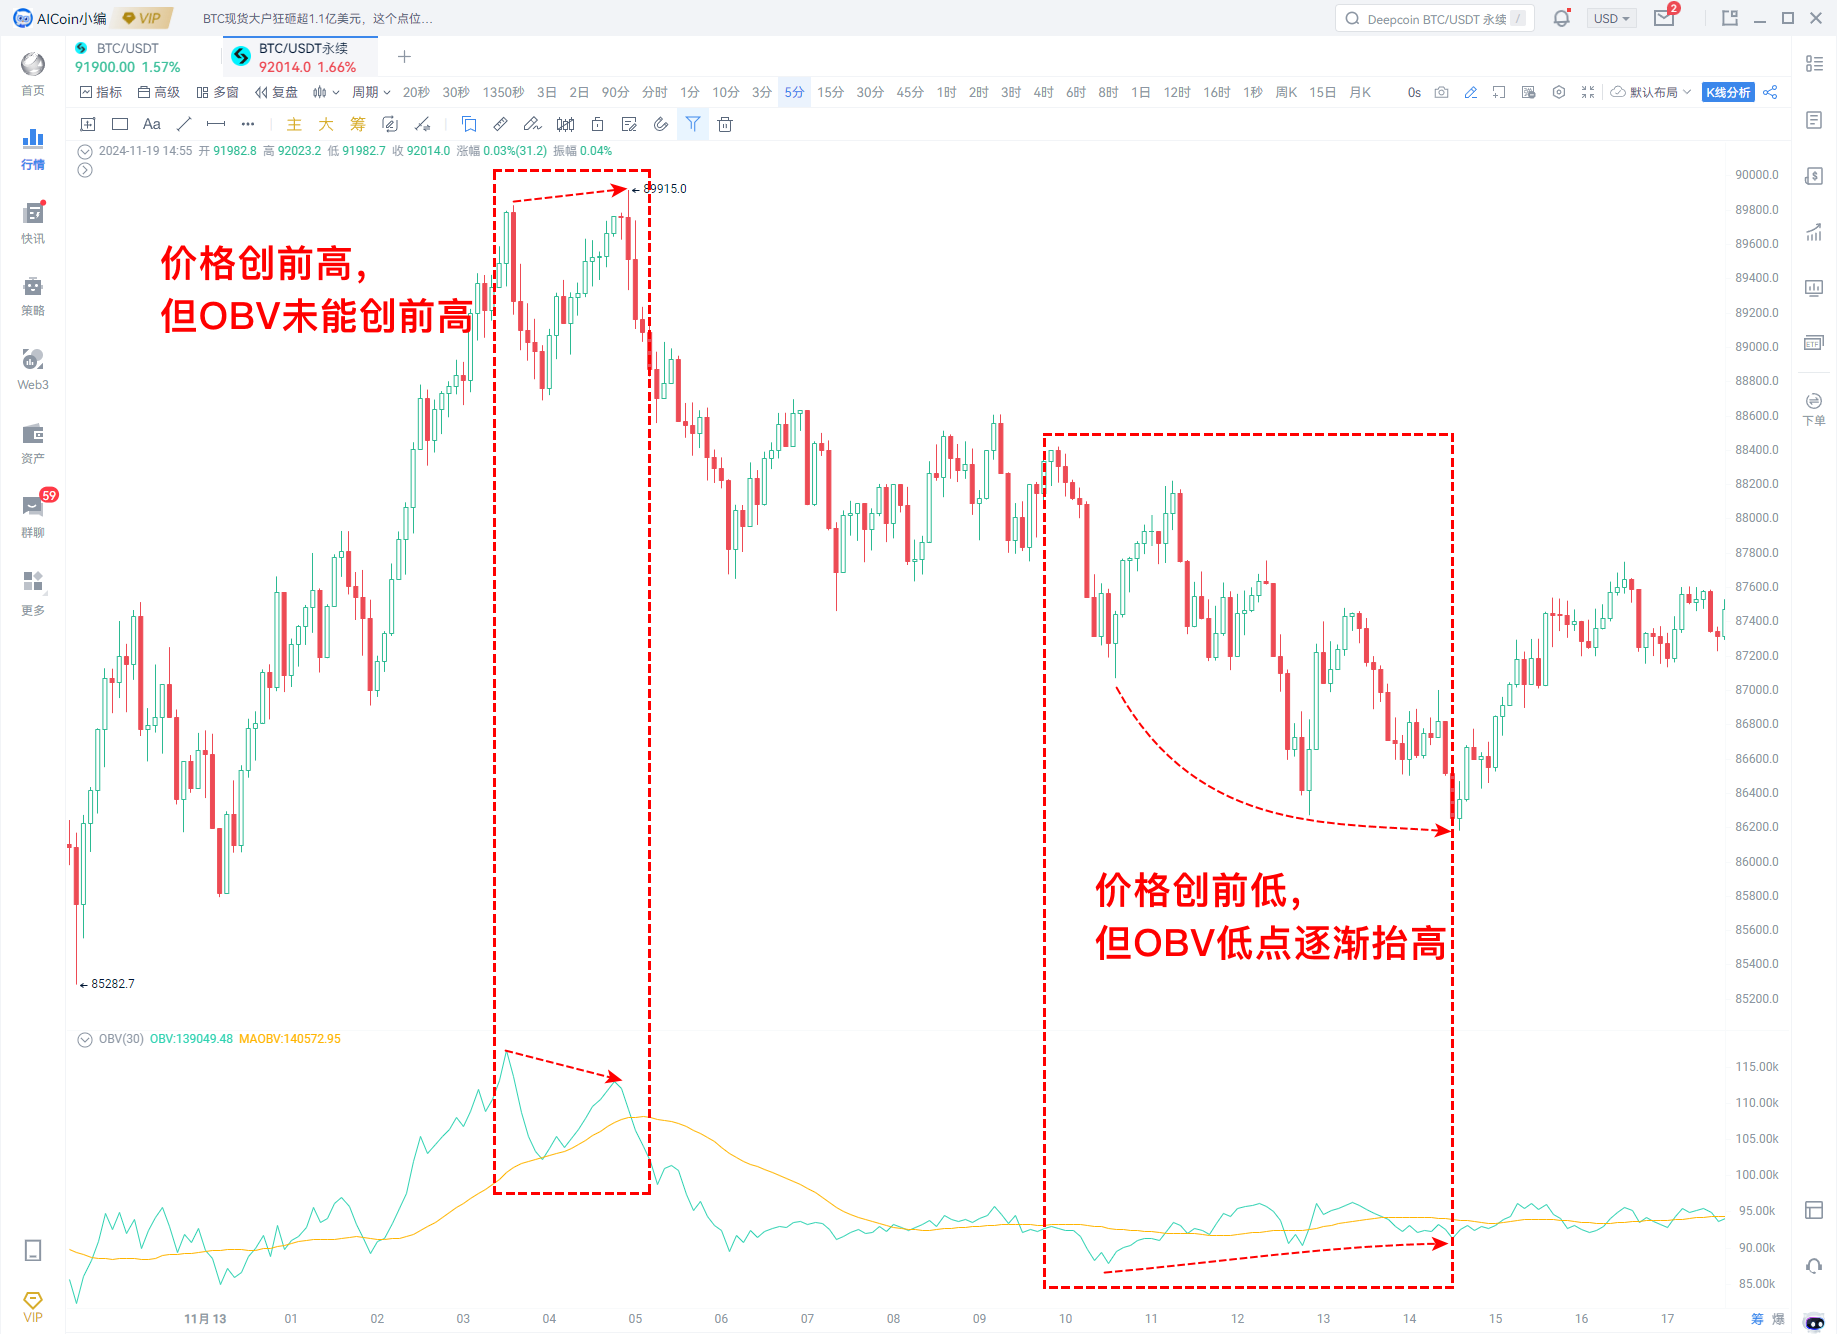
1. Buying the Dip – OBV Bullish Divergence
Description: Price makes a new low, but OBV fails to make a corresponding new low.
Interpretation: Selling pressure is weakening, indicating insufficient downward momentum. This typically suggests a potential upward reversal and serves as a buy signal. OBV demonstrates strong capability in identifying bottoming signals. During a downtrend, if OBV stops making new lows—known as "bullish divergence"—it usually indicates diminishing bearish momentum and the possible emergence of a buying opportunity.
2. Exiting at the Top – OBV Bearish Divergence
Description: Price reaches a new high, but OBV fails to reach a new high.
Interpretation: Despite rising prices, volume does not increase, signaling weakening bullish strength. This often foreshadows a price pullback and serves as a signal to sell or reduce holdings. Similar to catching bottoms, when price hits a new high but OBV does not follow suit, forming a "bearish divergence," it may indicate exhaustion in the uptrend—an alert for investors to consider exiting. At the peak of a bull market, investor sentiment can easily become overly optimistic, but abnormal OBV movements serve as early warnings, helping investors reassess their positions.
3. OBV Indicator Backtesting
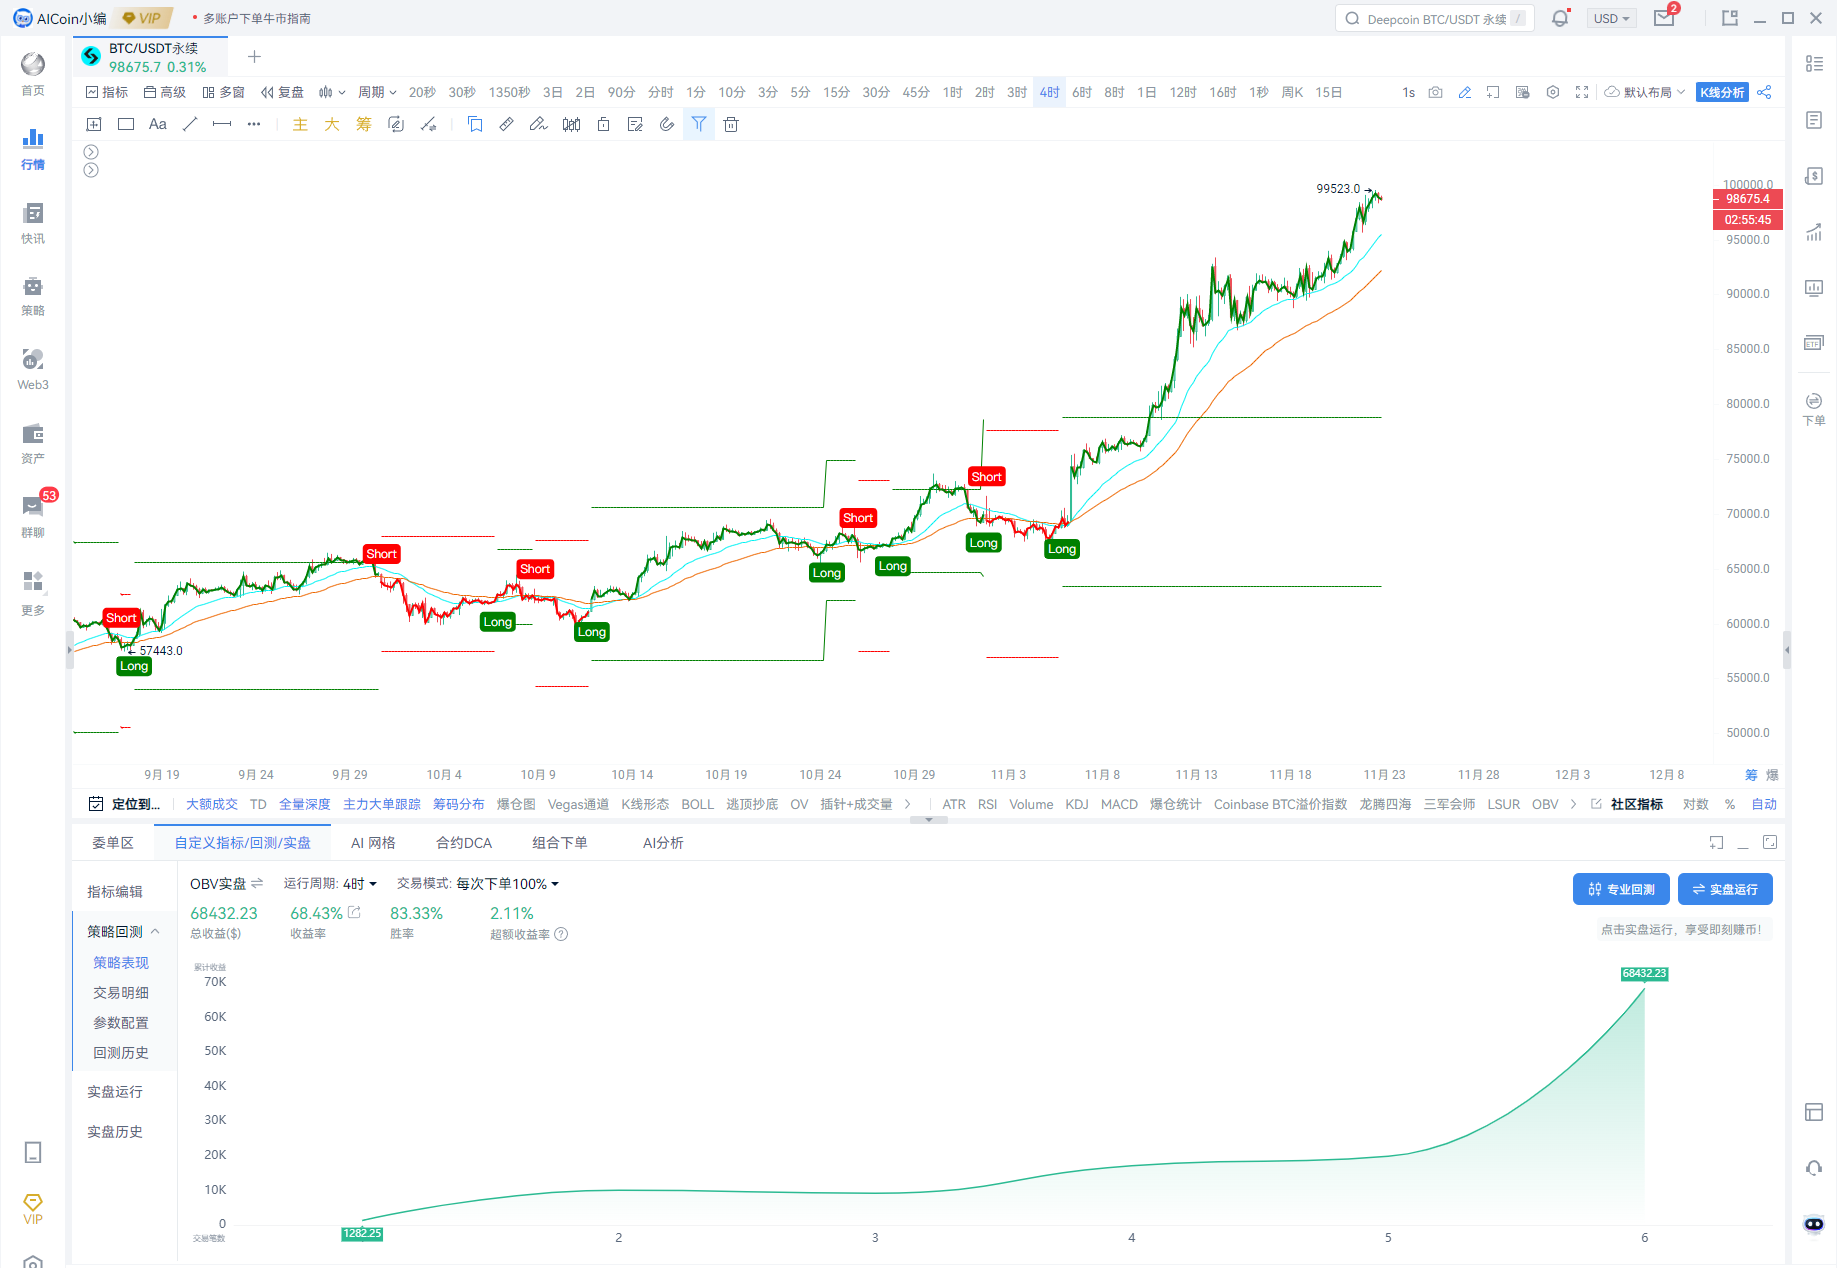
This phase includes backtesting three models based on the OBV indicator:
Model 1: OBV buy/sell signals in a sideways market over a 1-hour cycle
Win rate: 20%, Return: -0.34%
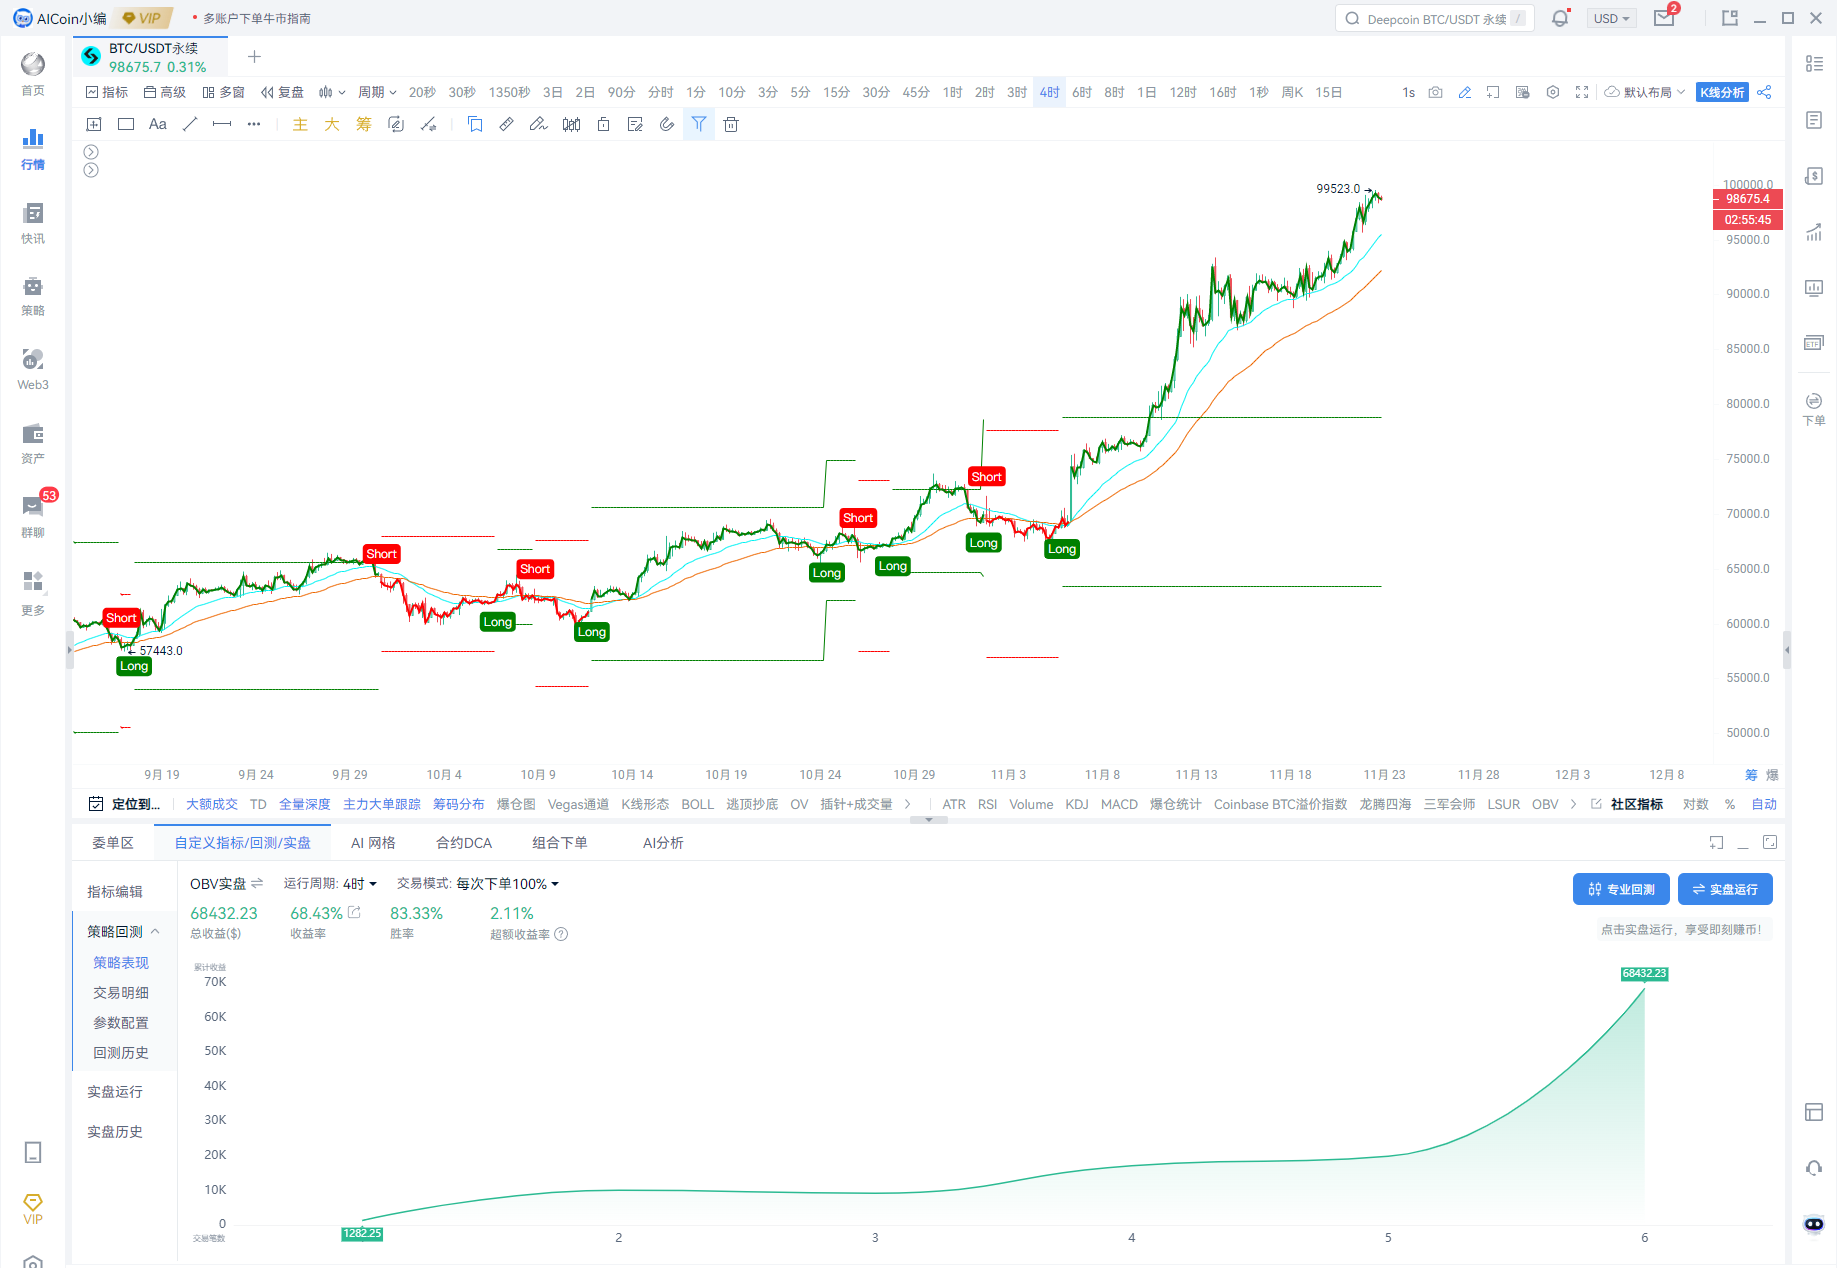
Model 2: OBV buy/sell signals in an uptrend over a 4-hour cycle
Win rate: 83.33%, Return: 68.43%
Model 3: OBV buy/sell signals in a downtrend over a 4-hour cycle
Insufficient data—excluded from statistics
According to AICoin’s backtest results, the OBV indicator performs well in rising markets, generating frequent signals with relatively stable win rates and returns.
Note: The underlying logic of the above strategies is based on OBV + EMA52 moving average
4. Analysis and Summary
In summary, the OBV indicator holds significant value in the dynamic cryptocurrency market. Investors should flexibly apply OBV strategies according to different market conditions:
● Bottom-Timing Opportunity: When price hits a new low but OBV does not, forming a bullish divergence, it indicates weakening selling pressure and presents a strong buying opportunity.
● Top-Timing Opportunity: When price hits a new high but OBV fails to confirm it, forming a bearish divergence, it signals weakening bullish momentum, suggesting investors consider reducing or closing positions to avoid potential downside risk.
● Trend Confirmation: OBV moving in tandem with price helps effectively assess market strength.
Through this joint research, we aim to equip users with the skills to use the OBV indicator for identifying optimal entry and exit points, enhancing trading efficiency during bull markets. In the future, AICoin and Bitget will continue collaborating to explore more classic trading strategies, delivering valuable market insights and helping investors navigate the cryptocurrency market with greater confidence.
About AICoin's OBV Indicator and Custom Indicators
(1) AICoin OBV Indicator:
1. Download and log in to AICoin
2. Enable the OBV indicator from the indicator library on the market K-line page
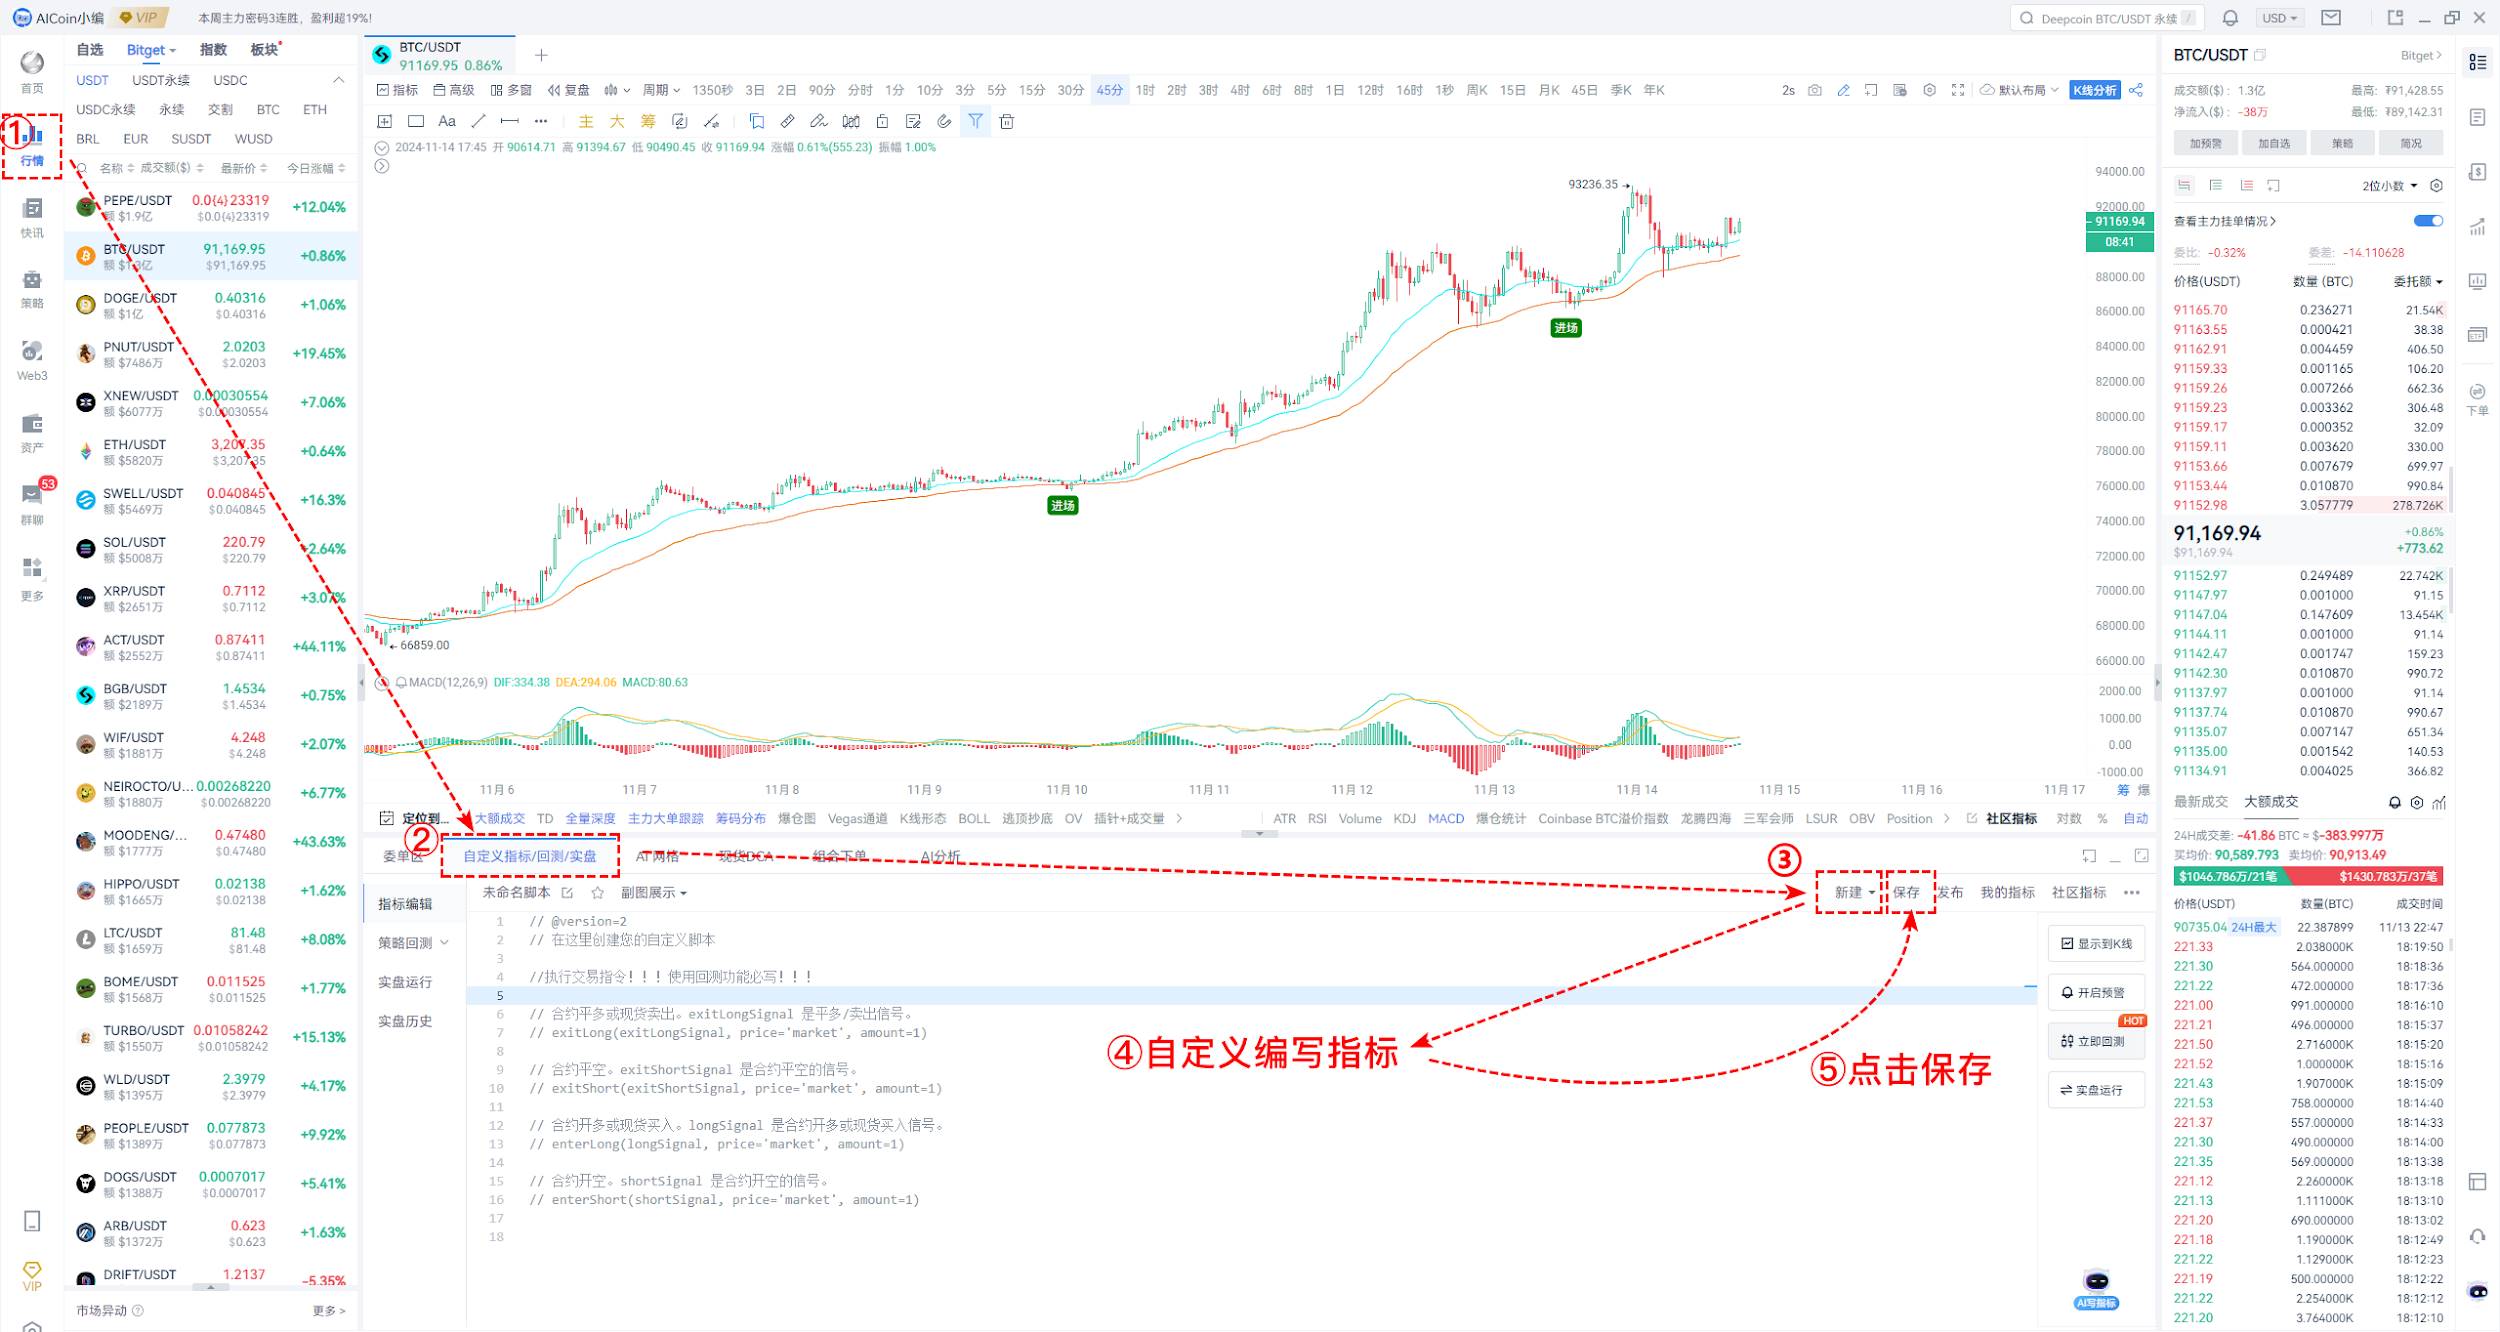
(2) AICoin Custom Indicators: Enable Quantitative Trading Across All Coins on Bitget!
AICoin’s custom indicators allow users to deeply tailor them according to their own trading strategies and risk preferences. Whether tracking market trends, quantifying signals, or setting specific trading conditions, users can easily create personalized indicators through simple adjustments!
Moreover, AICoin’s custom indicators fully support all cryptocurrencies available on the Bitget platform. From major coins to emerging hot assets, users can seamlessly apply customized indicators for analysis and trading, ensuring confidence in every trade.
Choose AICoin’s custom indicators to start your quantitative trading journey, capture every market opportunity, and achieve more efficient investment returns!
About Bitget's OBV Indicator and Copy Trading Products
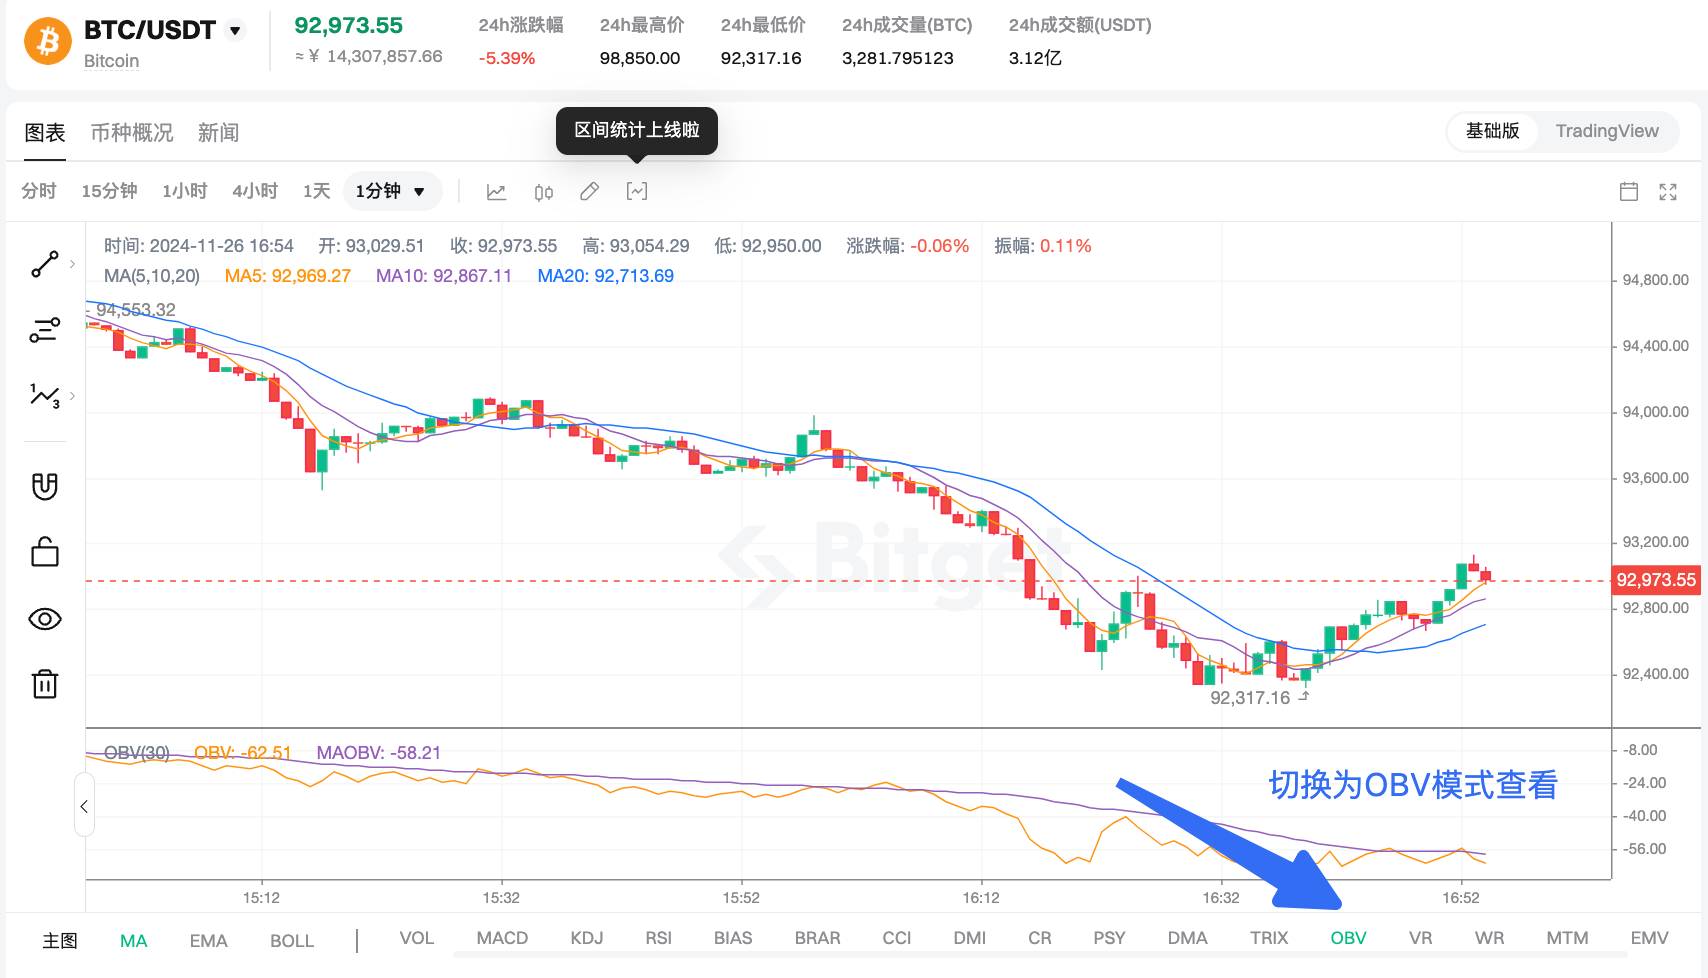
(1) Bitget OBV Indicator
1. Download and log in to Bitget
2. On the market K-line page, switch to view OBV—available on both web and mobile platforms
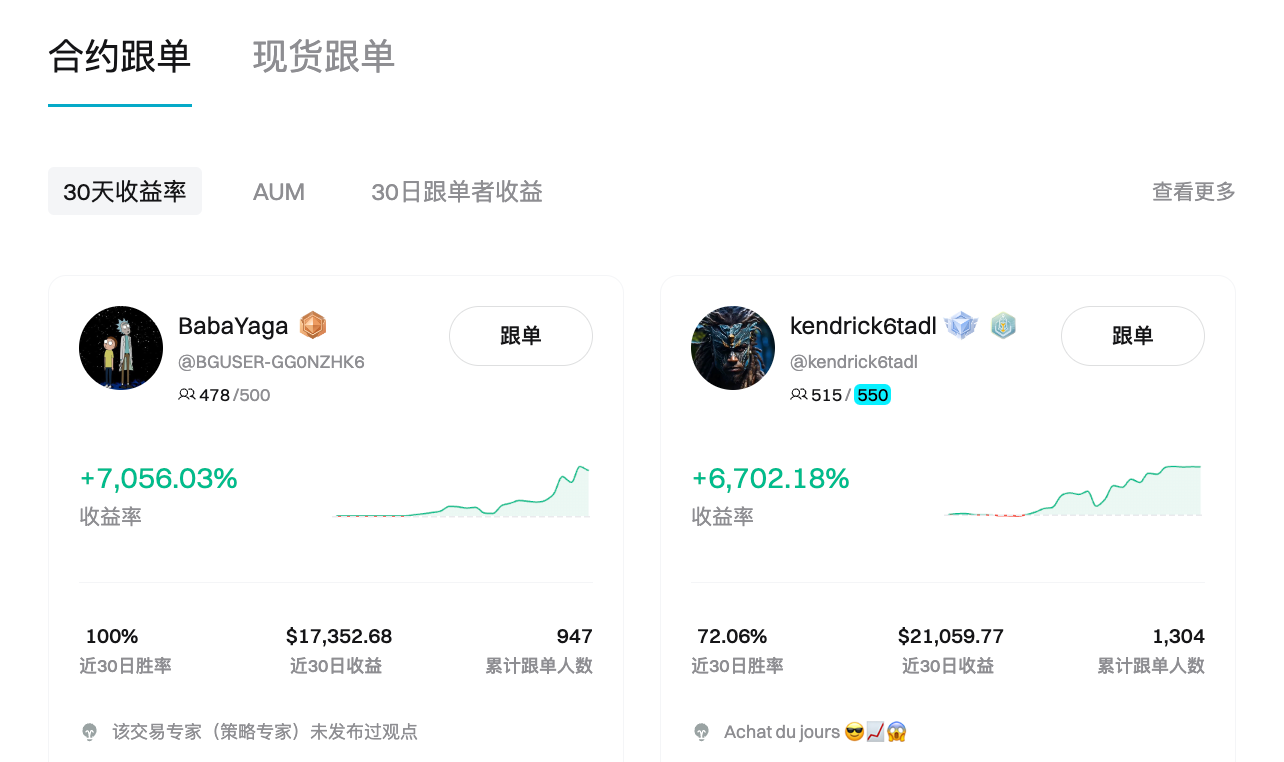
(2) About Bitget Copy Trading: Navigate Market Volatility, Accurately Capture Bullish and Bearish Trends
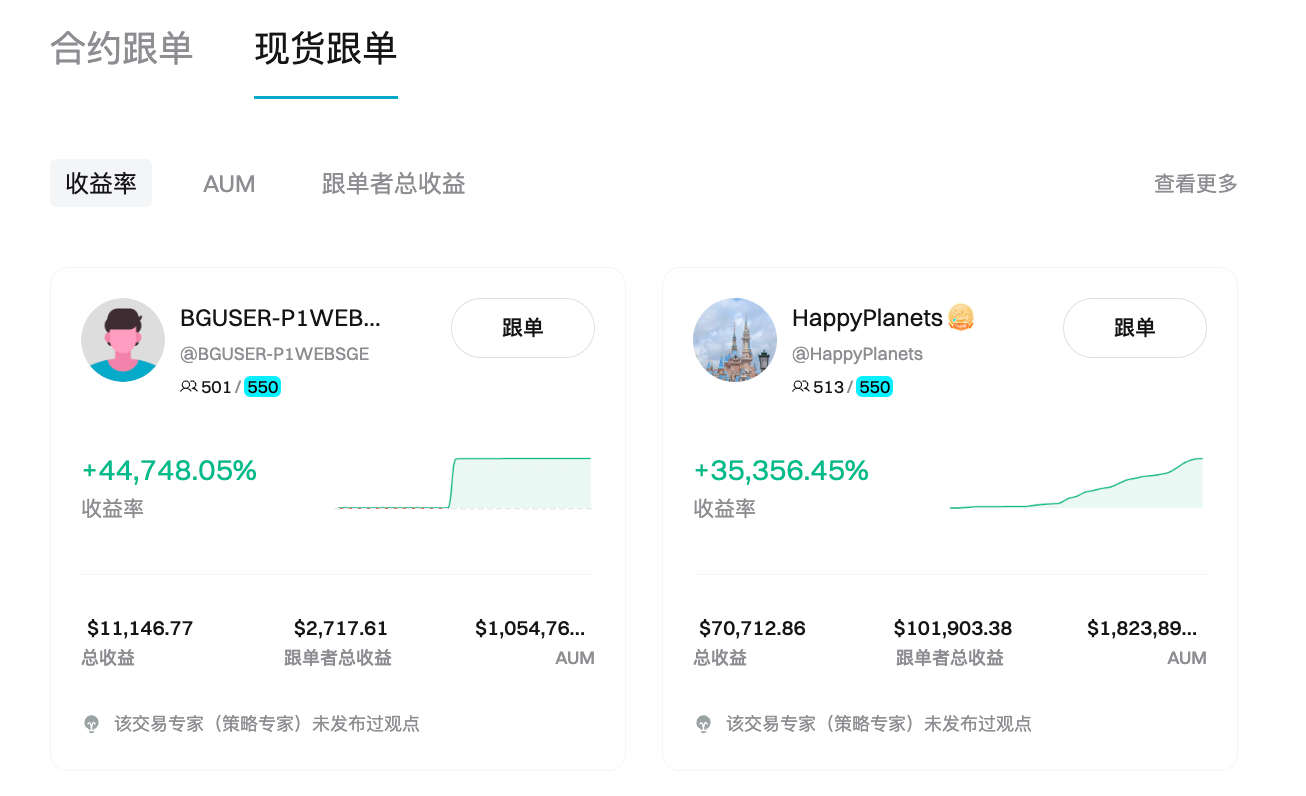
Bitget was the first cryptocurrency exchange to introduce copy trading, officially launching the service in May 2020. Currently, Bitget supports both spot and futures copy trading. Novice traders can review expert portfolios and historical performance, then subscribe to strategies that match their return expectations and risk tolerance, accessing insights shared by top traders. The platform hosts over 180,000 trading experts and 800,000 followers, with more than 90 million successful trades executed.
Disclaimer
This article is for informational purposes only and represents the author's personal views. It does not reflect the positions of Bitget or AICoin. We do not provide any form of investment advice, including but not limited to specific investment recommendations, digital asset trading suggestions, or financial, legal, and tax guidance. The information provided may contain inaccuracies or omissions. Therefore, please carefully evaluate relevant risks before investing. Digital asset trading and holding may involve significant price volatility. Always consider whether participation is suitable based on your personal financial situation.
Join TechFlow official community to stay tuned
Telegram:https://t.me/TechFlowDaily
X (Twitter):https://x.com/TechFlowPost
X (Twitter) EN:https://x.com/BlockFlow_News