The Theoretical Foundation of Building a Robust Cryptocurrency Investment Portfolio Using Multi-Factor Strategies
TechFlow Selected TechFlow Selected
The Theoretical Foundation of Building a Robust Cryptocurrency Investment Portfolio Using Multi-Factor Strategies
A "factor" refers to an "indicator" in technical analysis or a "feature" in artificial intelligence and machine learning, serving as the underlying reason determining the rise or fall of cryptocurrency returns.
 Navigating Web3 tides with focused insights
Preface
Last June, I proposed a preliminary idea for selecting cryptocurrencies using a multifactor model.
A year later, we have begun developing multifactor strategies tailored to the crypto asset market and formalized our overall framework into a series titled "Building Robust Crypto Investment Portfolios with Multifactor Strategies".
The general structure of this series is as follows (subject to minor adjustments):
I. Theoretical Foundations of Multifactor Models
II. Single-Factor Construction
-
Factor Data Preprocessing
-
Data filtering
-
Outlier handling: extreme values, errors, missing values
-
Standardization
-
Neutralization: sector, market, market cap
-
-
Assessing Factor Effectiveness
- Information coefficient (IC), returns, Sharpe ratio, turnover rate
III. Composite Factor Construction
-
Multicollinearity analysis among factors
-
Orthogonalization to eliminate multicollinearity
-
Classical weighting methods → composite factor
-
Equal-weighted, rolling IC-weighted, IC_IR-weighted
-
Composite factor testing: returns, grouped returns, factor-value weighted returns, composite factor IC, grouped turnover rate
-
-
Other weighting methods (when nonlinear relationships exist between factors and returns): machine learning, reinforcement learning (not considered due to the unique nature of the cryptocurrency industry)
IV. Risk Portfolio Optimization
Below is the main content of the first article, "Theoretical Foundations".
I. What Is a "Factor"?
A "factor" corresponds to an "indicator" in technical analysis or a "feature" in artificial intelligence and machine learning—it represents the reason behind the rise and fall of cryptocurrency returns.
Our team categorizes common types of factors in the cryptocurrency domain into fundamental factors, on-chain factors, price-volume factors, derivatives factors, alternative data factors, and macroeconomic factors.
The ultimate goal of discovering and calculating "factors" is to accurately estimate an asset's expected return.
II. How Factors Are Calculated
(1) Derivation of Multifactor Models
Origin: Single-Factor Model—CAPM
Factor research dates back to the 1960s with the introduction of the Capital Asset Pricing Model (CAPM), which quantified how risk affects a company’s cost of capital and thus its expected return. According to CAPM theory, the expected excess return of a single asset can be determined by the following univariate linear model:
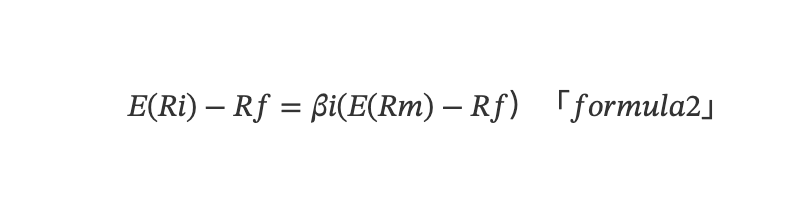
E(Ri) denotes the mathematical expectation, Ri is the asset's return, Rf is the risk-free rate, Rm is the return of the market portfolio, and βi = Cov(Ri,Rm)/Var(Rm) reflects the sensitivity of the asset’s return to the market return—also known as the asset's exposure to market risk.
Additional clarification:
-
In financial markets, "risk" and "return" are essentially two sides of the same coin.
-
A statistical perspective on βi
CAPM can be viewed as a bivariate regression model without an intercept term: Yi = β1 + β2 · X (β1 = 0). Using ordinary least squares (OLS), we estimate the model parameters, where β1 = β2 = Σ(X−μX)(Y−μY) / Σ(X−μX)² = Cov(X,Y)/Var(X).
β1 measures the average change in the dependent variable (asset i’s return) for a one-unit change in the independent variable (market return). In finance, this is interpreted as the "sensitivity" or "exposure" of Y to X.
β > 1 amplifies market volatility
β = 1 matches market volatility exactly
0 < β < 1 moves in the same direction as the market but with smaller fluctuations
β ≤ 0 moves inversely to the market
1. A financial perspective on βi: risk and return
There are two types of risks in a portfolio: systematic risk (market risk, non-diversifiable) and unsystematic risk (diversifiable). βi represents systematic risk, which is inherent to the system and cannot be eliminated regardless of portfolio construction. The αi mentioned below refers to unsystematic risk, which can be hedged through different strategies.
The CAPM is the simplest linear factor model, stating that an asset’s excess return depends only on the expected excess return of the market portfolio (market factor) and the asset’s exposure to market risk. This model laid the theoretical foundation for extensive research into linear multifactor pricing models.
Development: Multifactor Model—APT
Building upon CAPM, researchers found that asset returns are influenced by multiple factors, leading to the development of the Arbitrage Pricing Theory (APT) and linear multifactor models:
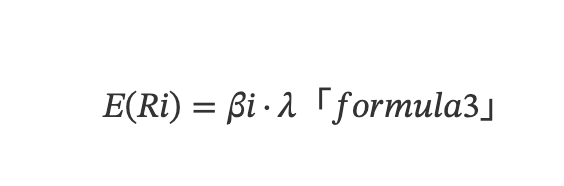
Here, E(Ri) represents the expected return of asset i, and λ denotes the expected factor return (i.e., factor premium). Formula (2) uses E(Ri) instead of E(Ri) − Rf from the CAPM to represent expected return. By constructing market-neutral portfolios using long-short hedging strategies, the risk-free rate Rf cancels out, making E(Ri) more generally applicable as it represents the difference between long and short expected returns.
Maturity: Multifactor Model—Alpha Return & Beta Return
Considering real-world pricing errors and the APT model, from a time-series perspective, the expected return of a single asset is determined by the following multivariate linear model:
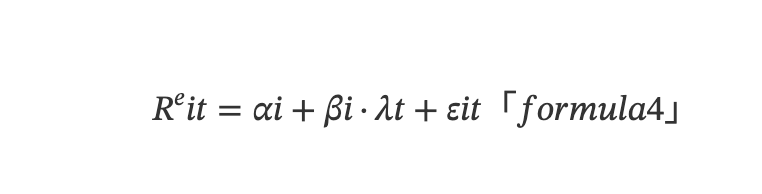
Here, Rᵉit denotes the return of asset i at time t, λt is the factor return at time t (i.e., factor premium), and εit is the random disturbance at time t. αi represents the pricing error—the difference between the actual expected return of asset i and the expected return implied by the multifactor model. If αi is statistically significantly different from zero, it indicates an opportunity for abnormal returns. βi = Cov(Ri,λ)/Var(λ) represents the factor exposure or factor loading of asset i, capturing the sensitivity of the asset’s return to the factor return.
Multifactor models focus on cross-sectional differences in expected returns—they are fundamentally mean models, where expected return is the time-series average of returns. Based on (3), we can derive the following multivariate linear model from a cross-sectional perspective:
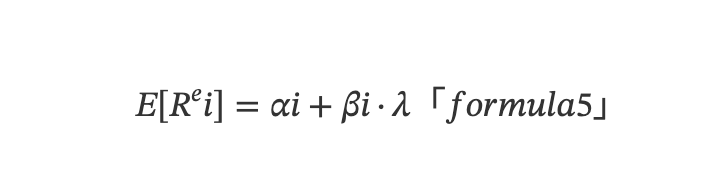
Here, E[Rᵉi] represents the expected excess return of asset i, and since εit averages to zero over time, E(εit) = 0.
Supplementary explanation:
From an academic standpoint, according to market efficiency theory, an efficient portfolio should have zero diversifiable risk, meaning actual return equals expected return, and expected return depends solely on systematic market risk—that is, E[Rᵉi] = βi · λ, implying no abnormal returns (AR), so AR = Ri − E(Rᵉi) = 0. However, real financial markets are often inefficient, allowing for abnormal returns, i.e., AR = α.
Assume a portfolio consists of N assets, and expand the factor return λ for each asset i across different factors, yielding the following multifactor model for portfolio return:
Rp = ∑ᴺᵢ₌₁Wi(αi+∑ᴹⱼ₌₁βᵢⱼfᵢⱼ)
Here, Rp is the portfolio's excess return, Wi is the weight of each asset in the portfolio, βij is the risk exposure of each asset to each factor, λ = ∑ᴹⱼ₌₁βᵢⱼfᵢⱼ, and fᵢⱼ is the factor return per unit factor loading for each factor of each asset.
Combining with statistical knowledge, this model implicitly assumes three conditions:
-
Beta return and Alpha return are uncorrelated for each asset: Cov(αi, βiλ) = 0
-
Idiosyncratic returns across different assets are uncorrelated: Cov(αi, αj) = 0
-
Factors must be correlated with asset returns: Cov(Rᵉi, βiλ) ≠ 0
Integrated explanation of Beta and Alpha returns:
In practical financial markets, βiλ represents the Beta return attributable to overall market performance, while αi represents the Alpha return generated by the asset's unique characteristics—how much it outperforms the market. An asset’s total return consists of both Beta and Alpha components. Investors can use the αi value from the multifactor model to score or weight individual assets when constructing portfolios and hedge the Beta portion via futures to isolate and capture Alpha returns.
(2) Volatility in Multifactor Models
When constructing portfolios, a balance between risk and return must be achieved, requiring transformation of the above model into a constrained optimization problem. Portfolio risk, represented by portfolio volatility σ²p, is derived below. Detailed analysis related to portfolio construction will be covered in the "Risk Portfolio Optimization" section.
Based on the matrix form of equation (3), Rp = W(βΛ + α), the portfolio volatility is given by:
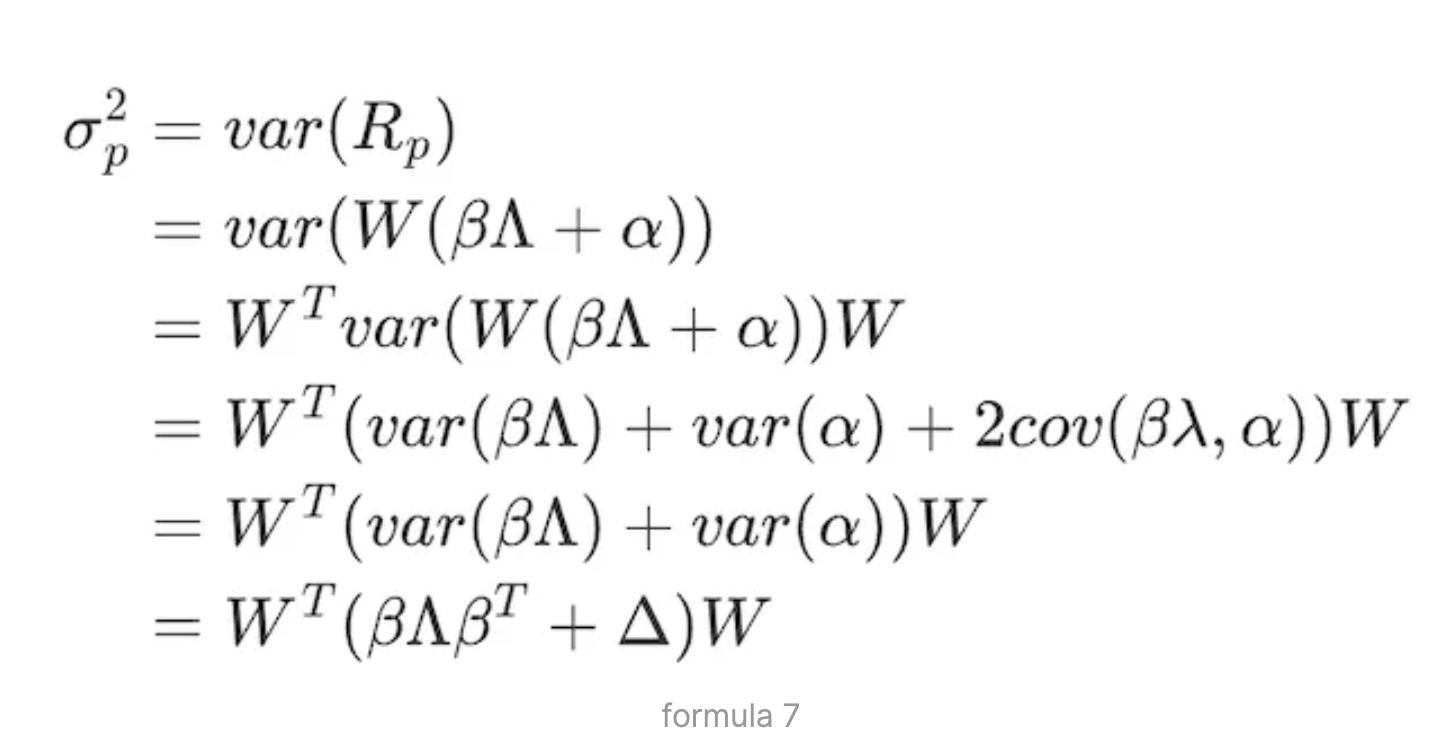
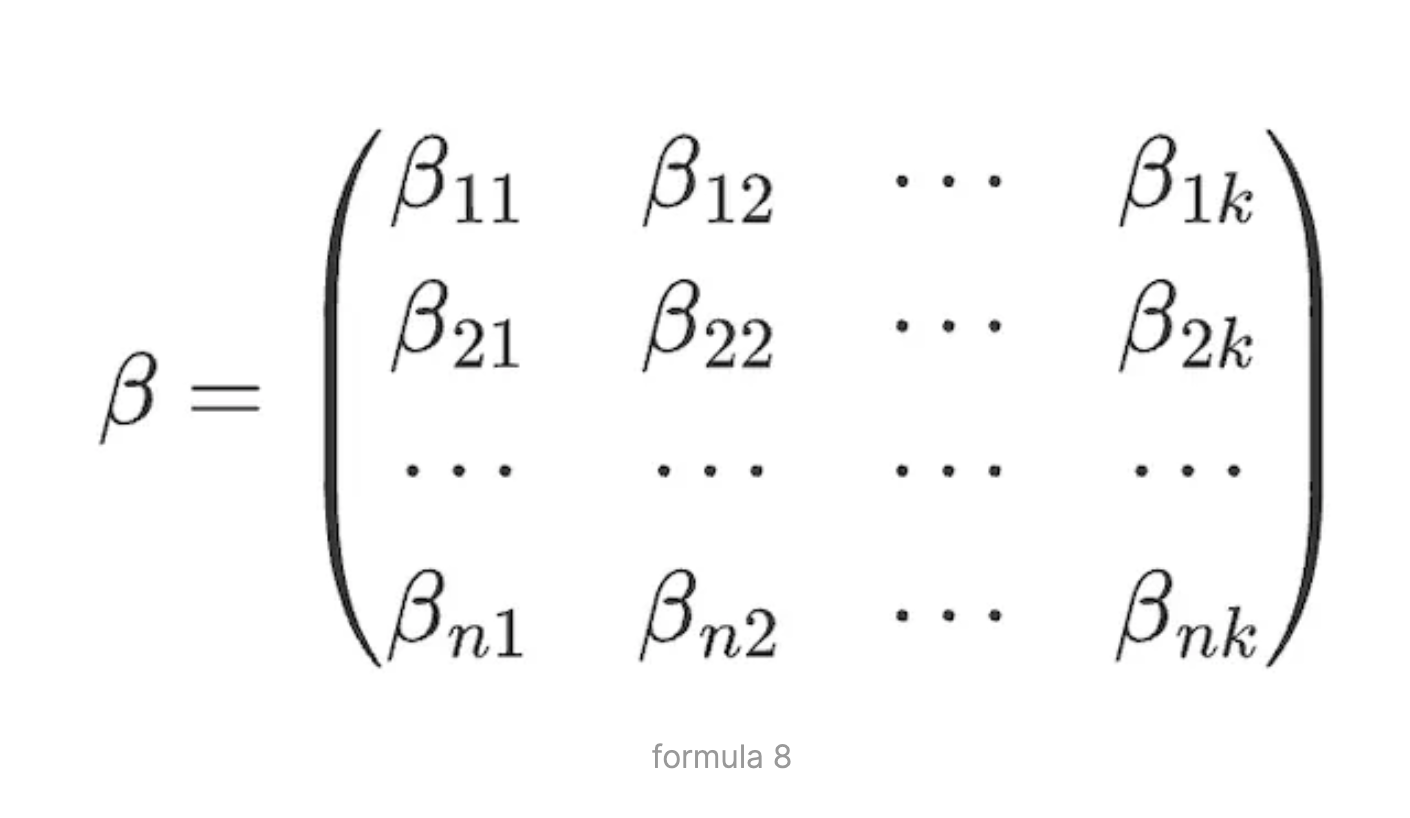
Here, W is the asset weight matrix, β is the factor loading matrix—a N×K matrix representing the loadings of N assets on K risk factors:
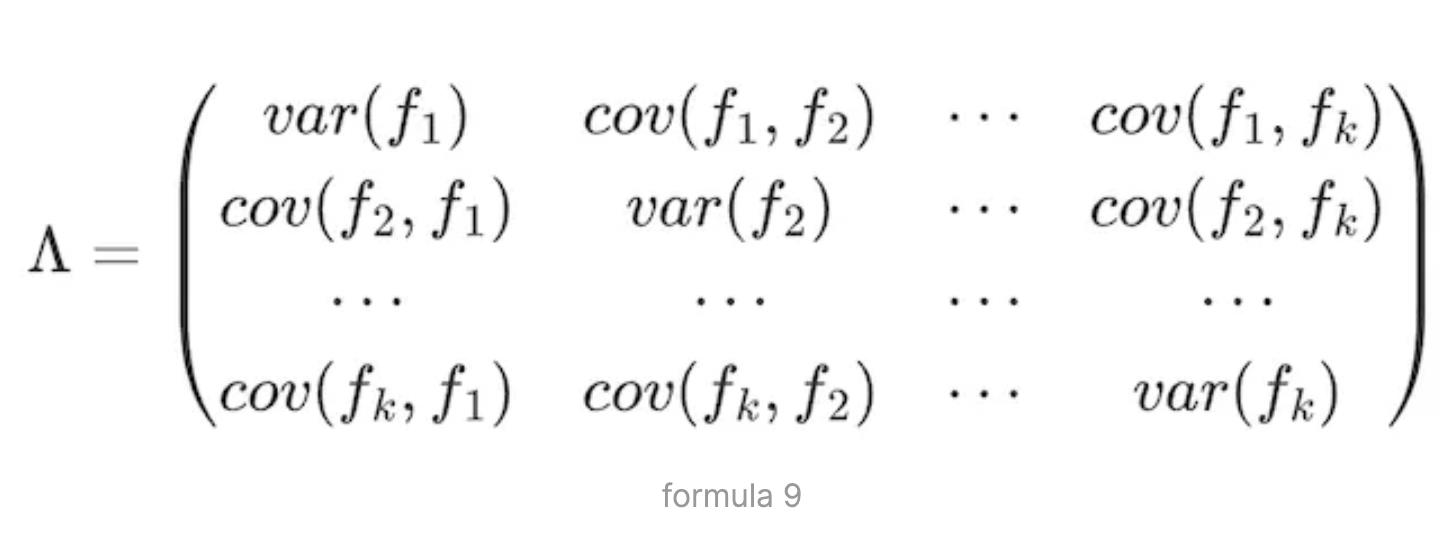
Λ is the K×K covariance matrix of the K factors’ returns:
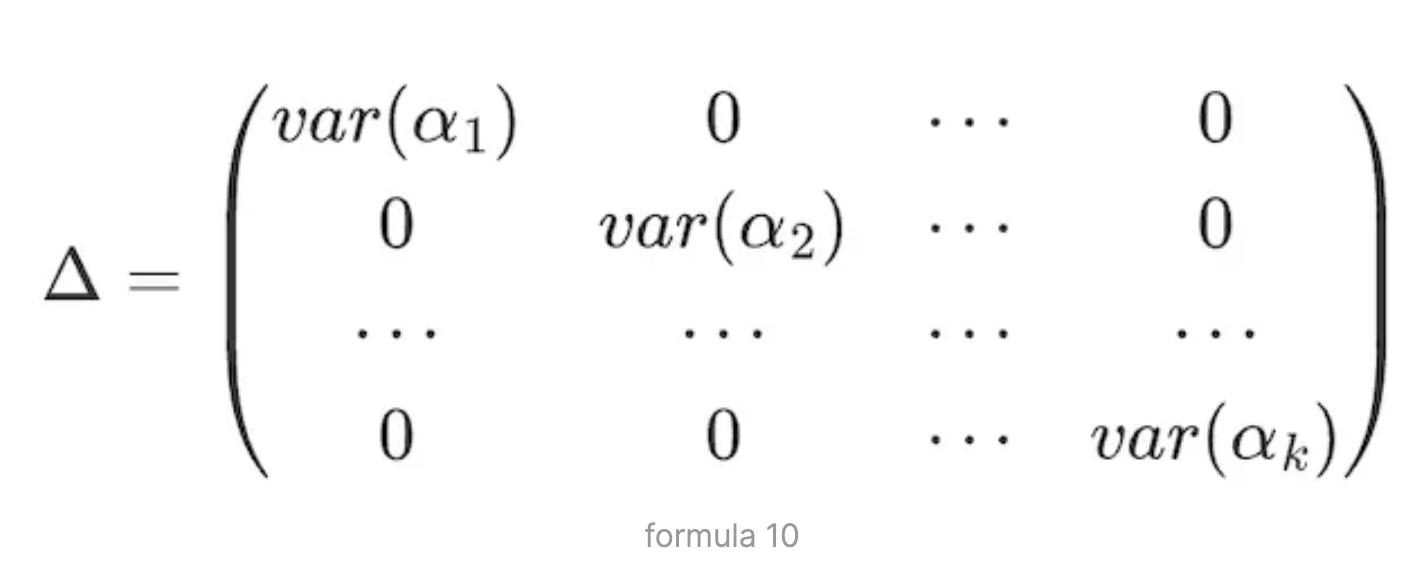
Given assumption 3—that idiosyncratic returns across assets are uncorrelated—the Δ matrix becomes:
Join TechFlow official community to stay tuned
Telegram:https://t.me/TechFlowDaily
X (Twitter):https://x.com/TechFlowPost
X (Twitter) EN:https://x.com/BlockFlow_News
 @lucidafund