IOSG: HIP-3 – An Expensive Entry Ticket, Not a Buyable Moat
Author: Mario Chow, IOSG Ventures
Ten teams have registered their own perpetual markets on Hyperliquid, with most having locked approximately $40M in HYPE for this purpose. One of them accounts for 97.8% of the volume and just saw a single-month decline of 44%. This article answers what the other nine bought into, with all figures drawn directly from chain data, not press releases.
Every figure in this article is taken directly from the Hyperliquid public API: perpDexs, metaAndAssetCtxs, covering the daily candleSnapshot for all 519 registered assets, along with delegatorSummary, userNonFundingLedgerUpdates, and clearinghouseState{dex}.
"30 days" refers to the full UTC calendar days from August 15 to September 13, 2026; "the previous 30 days" refers to July 16 to August 14; "7 days" refers to September 7 to 13. HYPE is priced at $79.73. Routing data in Section 7 is sourced from Flowscan because builder code volume cannot be aggregated from the public API.
Summary
· HIP-3 is once again a minority on Hyperliquid. Markets deployed by builders accounted for 25.8% of perpetual volume over 30 days, down from 57.1% last month. This shift comes primarily from the denominator: core book volume more than doubled, while HIP-3 volume itself declined.
· The leader is contracting. Trade[XYZ] traded $64.60B over 30 days, a 44.2% month-over-month decline, with the 7-day average dropping from a high of $5.36B/day in early August to $2.01B/day. About half of this decline corresponds to lower volume in the underlying real-market storage and AI sectors, while the other half is intrinsic to the venue itself. It hasn't outperformed the core orderbook on any single day since August 18.
· Entropy(io) led for a full week in a head-to-head market before yielding it back. Its share on Nebius followed a trajectory of 8.7%, 53.1%, and 20.4% over three consecutive weeks, and its own volume has declined for three weeks straight. The counter-signal lies in positions: open interest rose counter-trend by 37% to $51.4M.
· Settlement asset remains a make-or-break line, with the record still at 6 versus 6. All venues settling in non-USDC stablecoins have ceased trading; those still active all use USDC.
· Registered assets are not defensible. At the current auction reserve price, an asset slot costs roughly $39,900, meaning buying all of Paragon's online markets would cost around $1.04M, equivalent to two weeks of Trade[XYZ]'s fee revenue.
· No one is competing on price. All equity venues run on deployerFeeScale = 1.0 combined with Growth Mode, resulting in effective fees of Trade[XYZ] 0.427 bp and Entropy 0.400 bp. Collectively, all venues outside the leader—regardless of status—have only ever earned $747,000 in deployer revenue sharing.
The Ten Deployers Present

▲ Daily volume of Trade[XYZ] and all challengers below it. The vertical axis scale of the two charts differs by approximately 100x.

"Number of trades" is calculated by summing the `n` field of daily candlesticks within the window. The public API cannot derive the number of independent traders.
Historically, only ten teams have ever registered perpetual DEXes, with none added to date. Four are actively trading, five have stopped, and one never launched. Trade[XYZ] accounts for 97.8% of HIP-3 volume over 30 days and 97.6% over the past 7 days.
The challengers' situation can be summarized in a few sentences. Entropy traded $1.03B over 26 days across six online markets, relying on a proprietary oracle rather than an asset list. It is the only venue that has actually led in a market where the leader is also quoting. Paragon is the only challenger whose orderbook actually looks like one, operating 26 online markets with well-distributed tail positions, and grew 49.9% during the month even as Trade[XYZ] simultaneously listed five of its target assets. Markets by Kinetiq purchased 23 targets, with 95% of volume concentrated in two index perpetuals. HyENA has concluded: all markets delisted, open interest zeroed out, lifetime earnings of $33,414.
HIP-3's Share, and Why It Is Prone to Misinterpretation

▲ Daily measured share of HIP-3 in Hyperliquid perpetual volume.

The 7-day average crossed 50% in mid-July, peaked near 57% in early August, then dropped below 30% and hasn't recovered since August 20. On August 18, one builder's volume surpassed that of Hyperliquid's entire validator set. It hasn't happened since.
This ratio actually reflects its denominator. The numerator is an equity orderbook, the denominator is a crypto orderbook, and the volatility resides on the crypto side. 57% was read during quiet crypto conditions, while 26% came when the same equity orderbook met a volatile period, coinciding with a 117% surge in core perpetual volume over the same timeframe. The recent seven-day share has even slipped back to 28.6%, while Trade[XYZ] continues to contract. Before citing any HIP-3 share metric, always clarify what the crypto market was doing during that period.
What truly matters is absolute volume, and that is deteriorating. Trade[XYZ] traded $64.60B over 30 days, down 44.2% YoY from last month, with the 7-day average falling from $5.36B/day in early August to $2.01B/day, representing a 62% drawdown in its own orderbook. Its top market, SK Hynix, dropped to $8.50B. Both drivers of the declining share are real. The following section explains that most of the HIP-3 driver is simply not a competitive issue.
The Primary Driver of Volume Decline is Sector Quietness, Not Share Erosion
Reading the 44% drop directly as "the leader is losing" is the most convenient narrative, but the data doesn't support it. The test is straightforward: if the decline were driven by competition, we would see the underlying assets trading normally, with only Trade[XYZ]'s captured share shrinking. In reality, the assets themselves went quiet.
No selling pressure occurred. Using early August—the peak of volume—as a baseline, every major market in the orderbook is trading at higher prices today.

What truly collapsed was how far these targets could move in a single day, and the venue's volume followed almost synchronously.

These figures use trading-day conventions only, as stock markets close on weekends while Trade[XYZ] operates continuously; including weekends would significantly inflate this correlation. Looking solely at weekdays, the correlation coefficient between the storage sector's average daily volatility and the venue's daily volume is +0.47 across a 45-day sample. Gold serves as a natural control: it was the only major market this month with rising intraday volatility, and its volume followed suit. Silver is the exception to this pattern.
However, volatility is merely a proxy variable. A more direct test compares the actual stock volumes of the same nine targets, and the answer is: traditional markets only account for roughly half.

Real volume in the storage and AI sectors indeed collapsed by 25.7%, accounting for that half. But XYZ fell 49.7%, nearly double. The remaining 24 percentage points did not come from the broader industry.
Moreover, the largest gaps occur precisely in its core holdings: SanDisk -26.0pp, Micron -25.4pp, Intel -21.5pp, SK Hynix -17.2pp. It actually outperformed the real market on Nvidia (+36.5pp) and Nebius (+18.6pp), but those orderbooks are very small.
Competition also fails to explain this gap. Entropy's total SanDisk volume over 30 days was $523M, while XYZ's own SanDisk orderbook lost $6.14B, meaning challengers captured at most ~8% of that loss.
The remainder resembles capital rotation. Over the same period, Hyperliquid core perpetual volume surged 117% while HIP-3 declined, yet the combined total grew by 26%. Money didn't leave Hyperliquid; it simply rotated back from equity orderbooks to crypto orderbooks.
A size anchor. In the same 30-day window, these nine targets traded $2,004.7B on their respective exchanges, while XYZ executed $23.5B on them, representing 1.2%. XYZ's combined $64.60B across all 104 markets equals only 3.2% of the true volume of these nine tickers. Penetration rates peaked at 9.1% for SK Hynix and bottomed at 0.1% for Broadcom. This curve itself reveals what this business is: high penetration for assets crypto-native traders can't reach, low penetration for accessible US large-cap stocks.
Thus, this downturn comprises both factors: roughly half is sector beta, and the other half is intrinsic to the venue. Section 6's calculations rely solely on actual volume, regardless of source, so fee calculations remain unaffected. But separating the two halves is crucial: the sector portion will return, while the venue's portion may not.
The Washout, and the Only Predictive Variable

▲ Daily volume per HIP-3 venue on a log scale. Dashed lines indicate settlements in non-USDC stablecoins; dots mark their final day with execution.
Six venues have ceased trading to date. The variable separating them wasn't asset selection, team capability, or historical volume—it was the settlement stablecoin.
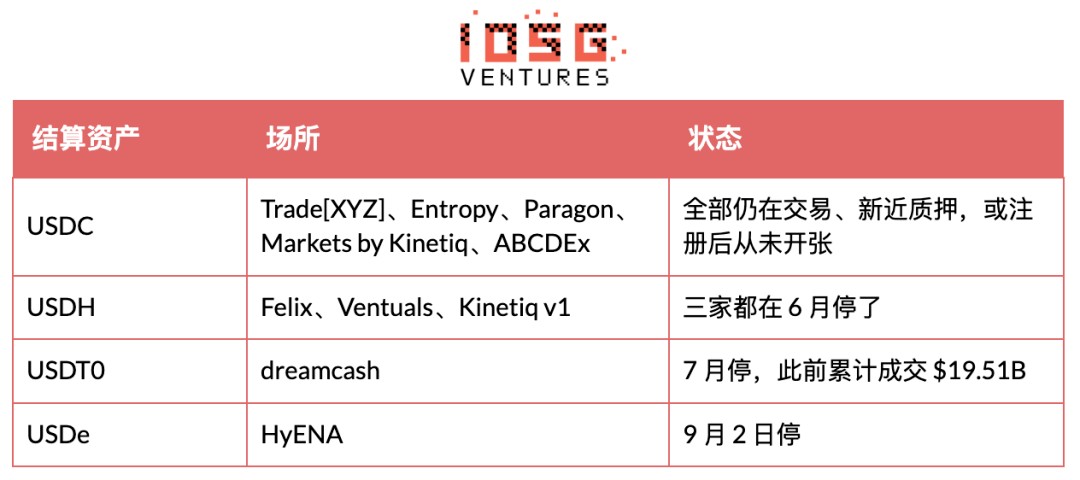
The mechanism itself is simple: traders had to first swap to a specific stablecoin to place their initial order, which they refused to do. Felix is the clearest example. The modest fee incentive that initially supported USDH was completely offset once Growth Mode launched, leaving friction as the sole characteristic of this settlement asset thereafter.
Kinetiq serves as the control group. The only operator that survived after closure cut its USDH venue and relisted identical index products on USDC. Historical volume predicts nothing: dreamcash previously traded $19.51B, surpassing the combined June batch, yet still shut down. Entropy entered in August with more capital than any prior participant, showing no hesitation in choosing USDC.
What Truly Determines Settlement Assets, and What Doesn't
Interpreting USDC's dominance as a protocol directive is natural, but Hyperliquid's own documentation states the opposite. Under Aligned Quote Assets v2 (launched on USDC in late August, with Coinbase as treasury deployer and Circle as technical deployer), approximately 90% of USDC's cost-adjusted reserve yield on Hyperliquid is allocated to the protocol and funneled into the Assistance Fund. Interest accrues in 30-day periods, with payments issued on the 8th day following each period's close, meaning the first distribution arrives in early October, and nothing has arrived yet.
What AQA v2 explicitly avoids is favoring HIP-3. The documentation is blunt: there are no preferential treatment rules for trading fees or volume counting, and other quote assets remain fully supported on HIP-3 perpetuals. Fee benefits belong to AQA v1, which grants lower taker fees, higher maker rebates, and increased volume credit for a venue's collateralized assets. USDC isn't included in AQA v1, nor structurally eligible, as that tier requires stablecoins to be exclusively issued by Hyperliquid. AQA v2's actual privileges target event contracts and verifier-operated perpetuals, pending future upgrades—not this market section.
Thus, settlement assets were determined by liquidity and a corporate-level maneuver, not fee design. USDH went offline on July 17, 2026, with holders redeeming at 1:1 for USDC; Coinbase acquired its brand assets and simultaneously became USDC's treasury deployer. Today, within the stablecoin supply on Hyperliquid, USDC accounts for 98.3%, USDT 1.2%, and remnants of feUSD, USDe, and USDH each sit at roughly 0.1%. A venue settling with alternative assets faces no fee disadvantage. It asks its traders to abandon the only deep liquidity pool available.
Estimating AQA v2's scale requires noting that official figures have never been published. With $6.77bn in USDC on Hyperliquid and SOFR at ~3.6%, assuming a 90% allocation points to roughly $200M annually. Third-party estimates based on a $5bn base range from $135M to $160M. The external unknown is the cost adjustment within AQA rates—a validator-reported oracle whose levels aren't public, meaning every figure here is modeled, not empirical.
HyENA illustrates the second mechanism. Because it listed crypto assets, it was excluded from Growth Mode, quoting ~5 bp on identical targets while the core book beneath quoted ~3 bp, resulting in worse execution quality. It spent ~$0.88M on asset slots and earned only $33,414 over its lifetime.
Shutdown does not equal exit. HyENA has delisted all 25 markets and zeroed out open interest, yet its staking remains at 508,915 HYPE (~$40.6M), with no withdrawal requests submitted in twelve days. Felix and dreamcash fully reclaimed their stakes, now reading zero; Ventuals holds only 7,967. A venue that delists every market but retains $40M on-chain is either experiencing slow liquidations or parking capital to hold this deployment slot for another entity.
Why Ventuals died warrants a dedicated section, as next-generation products are built around addressing this failure. Insufficient liquidity was merely a symptom; the mechanism flaw lay in funding rates: pre-IPO perpetuals lacked a convergence anchor, causing annualized funding rates to spike toward ~8,700%. Regardless of mark price accuracy, long positions faced liquidation. Entropy caps annualized funding rates near 10% and settles against its own TWAP mark price rather than chasing external feeds. Its contract architecture reads essentially as a patch list targeting Ventuals' precise fatal flaws. When evaluating any pre-IPO orderbook, examine funding mechanics and settlement design before reviewing the asset list.
Trade[XYZ]'s Orderbook Composition, and Why It Doesn't List OpenAI
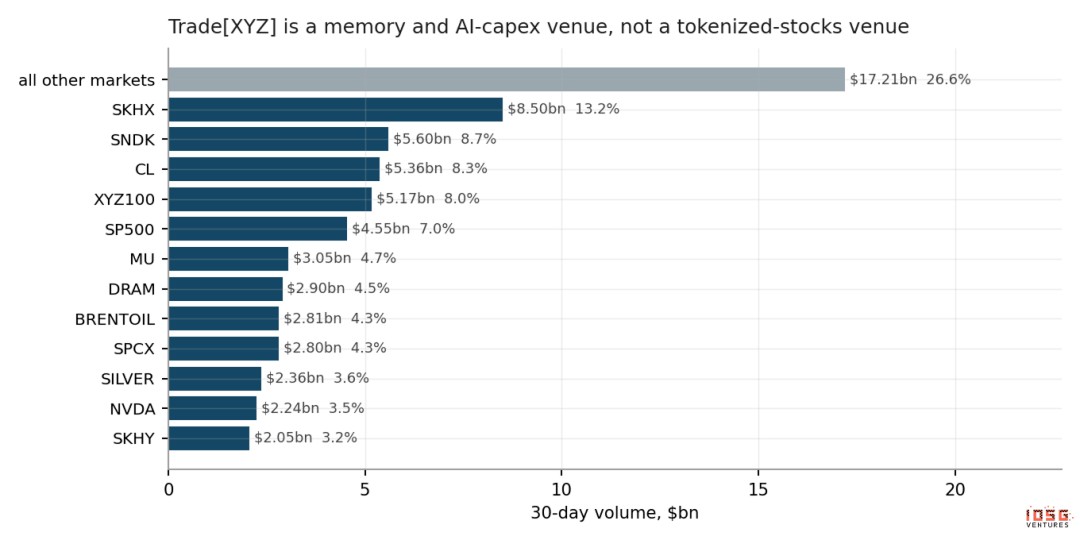
▲ Trade[XYZ]'s highest-volume markets over 30 days.
The top ten markets comprise 66.7% of the orderbook, while the tail beyond the top six alone accounts for $32.4B. Nvidia represents 3.5%. Apple, Tesla, Alphabet, and Microsoft combined account for just 3.3%—only a quarter of SK Hynix alone. The US tech giants favored by tokenized equity narratives do not drive this business.
Trade[XYZ] effectively operates a 24/7 venue focused on storage and AI cap-ex trades, supplemented by crude oil, metals, and index products: Korean/Japanese semis, a synthetic DRAM index, SpaceX, its proprietary XYZ100 basket, and a licensed S&P 500. Its territory consists of assets crypto-native traders won't find elsewhere at 3 AM. This is precisely the turf Entropy chose to attack, targeting SanDisk and Nebius instead of Apple.
Why OpenAI Isn't Listed
The most intuitive answer—that it avoids unlisted companies—is incorrect. Pre-IPO is actually one of its stronger segments. SpaceX alone generated $2.80B over 30 days, claiming 4.3% of the orderbook and ranking ninth. Below that: Unitree $511M, CXMT $317M, Zhipu AI $156M, MiniMax $92M, SHEIN $27M, with YMTC already registered and queued.
These names share a common trait: observable secondary market prices and known share counts. SpaceX conducts regular tender offers yielding explicit per-share valuations; several Chinese firms on this list have active pre-IPO gray markets on the mainland, with share counts verifiable via commercial filings and financing rounds. Thus, this venue can quote on a per-share basis just like any other asset.
OpenAI and Anthropic lack both. Their secondary transactions are trapped within SPVs, trading claims on fund shares and negotiating consolidated enterprise valuations rather than per-share prices. Forcing a per-share quote means inventing a denominator. That's the bottleneck—a matter of quoting convention, not intent. Entropy's solution bypasses per-share quotes entirely, pricing the entities themselves: 1 contract = $1bn market cap, implying current mid-prices near $2.17tn for Anthropic and $1.53tn for OpenAI.
Yet this doesn't form a moat. If the leader wishes to add a market-cap-priced target, it can simply spend ~$39,900 at any time. Moreover, its own roadmap points elsewhere: 16 registered but inactive targets are queued, comprising uranium, aluminum, the dollar index, VIX, corn, wheat, TTF, the Korean won, India's Nifty, Brazil's Ibovespa, Ibiden and KSTR, plus YMTC and H100. These are macro and commodities, not frontier AI labs.
One structural detail deserves note. Trade[XYZ] lacks an oracleUpdater, meaning it pushes mark prices using its own deployer key, whereas Entropy and Felix both point to the same third-party updater at 0x94757f8d… Entropy has publicly stated RedStone sources its Anthropic market prices, explaining why two unrelated venues share an updater address, though the address carries no on-chain label. Proprietary oracles work fine for assets with reference prices, but when mark prices must be "constructed," the nature shifts—which is precisely the business model Entropy selected.
Head-to-Head Competition, and the Week Entropy Led
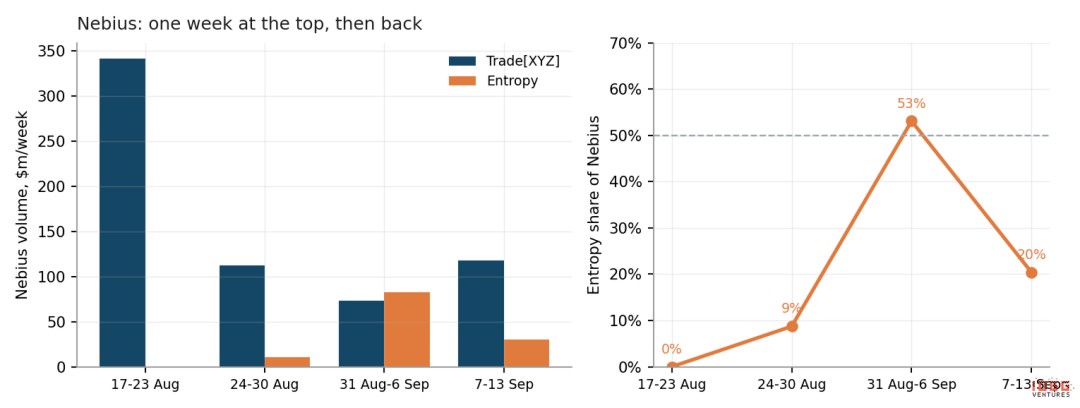
▲ Weekly volume on Nebius and Entropy's share thereof.
Nine targets are currently active across both HIP-3 venues simultaneously. Operators no longer carve out mutually exclusive orderbooks; overlap has become standard practice for any ticker worth listing twice.
Slot Acquisition Erodes Share, Not Orderbook Depth
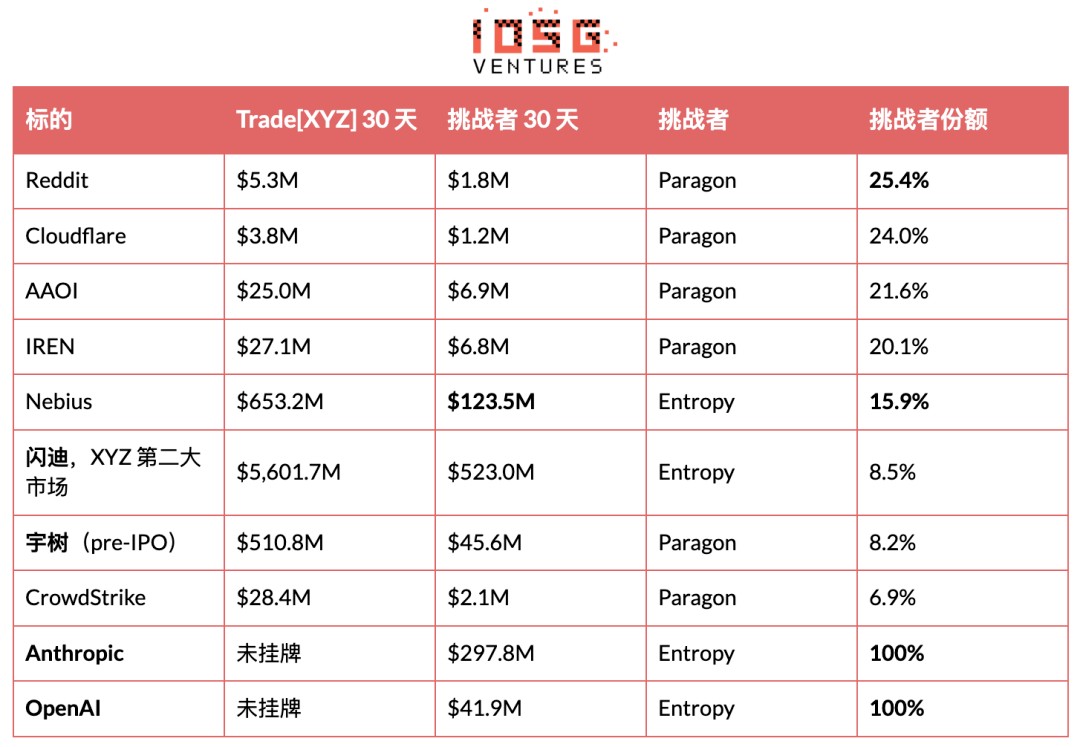
Trade[XYZ] previously registered Paragon's five core targets but kept them inactive. On August 18, it activated all five in a single day and leads across them today. Filling this gap cost roughly three days' worth of fee revenue, completed in one afternoon. Chain data cannot determine whether those targets served as deterrence or were simply queued for activation.
What can be judged is the outcome. Four weeks later, Paragon still commands 20% to 25% share across four of those five, and overall monthly volume grew 49.9%. Unitree best illustrates the mechanism: Trade[XYZ]'s Unitree orderbook is roughly 11x larger than Paragon's, yet Paragon claims just 8.2% of that pair. However, Paragon's own Unitree volume nearly doubled同期. The leader isn't stealing volume from challengers; it's expanding the market around them. Launching a market and owning a market are two entirely different things.
Entropy Leads on Nebius for One Week, Then Yields Back
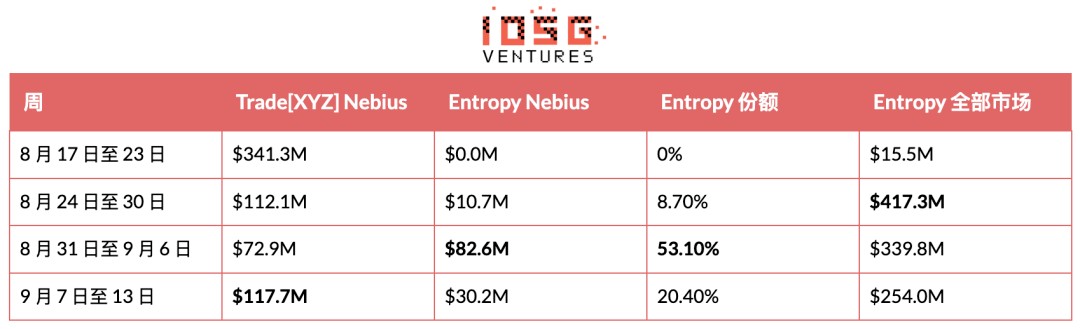
For one week, Entropy's Nebius volume genuinely exceeded Trade[XYZ]'s—an unprecedented feat among HIP-3 challengers. The following week, the leader's Nebius orderbook surged 61% while Entropy dropped 63%, pushing the challenger back to one-fifth of that pair. SanDisk tells the same story, quieter: Entropy's weekly share hovered near 13%, averaging 8.5% over the full 30 days.
Thus, this lead was real but lasted exactly one week. The honest reading: Entropy proved it can penetrate a market where the leader actively quotes, but hasn't proven it can defend it. Total volume has declined for three consecutive weeks, dropping from $417M to $254M.
The counter-signal comes from inventory. As weekly volume retreated 39% from its peak, Entropy's open interest surprisingly rose 37% to $51.4M, with a single Anthropic position accounting for $29.9M. Volume-churning executions cancel out without leaving inventory. Therefore, falling market share alongside accumulating open interest signals genuine positioning rather than noise tracking. These two facts pull in opposite directions; what truly demands attention is the tension itself, not any isolated metric.
This volume requires discounting. Entropy lacks a token and has confirmed no airdrop, yet its backend exposes a `pointsMultiplier` parameter, and its leaderboard page displays "Launching Soon," implying some traffic chases expectations rather than utilizing the product—externally indistinguishable. Scale must also be acknowledged: Entropy processed ~$1.0B in a month versus Trade[XYZ]'s $64.6B, representing just 1.6% of the leader. It wins individual battles, not this category.
Its registered but inactive targets reveal the next move. Entropy holds EWY, SBE, TCNT, and a DRAM index. That DRAM index is Trade[XYZ]'s fourth-largest offering; EWY tracks South Korea. The upcoming clash appears aimed directly at the leader's core territory, rather than hunting another un contested pre-IPO ticker.
⚠️ Two Counting Rules
Only active orderbooks count. HIP-3 deployers often register targets long before activation. Such targets return oracle markPx, but midPx is null, isDelisted is true, open interest is zero, and K-line history is absent. Trade[XYZ] holds 16, mkts holds 19, Paragon 9, and Entropy 4. HyENA's 25 are different—they were activated and subsequently closed.
Ticker strings do not equal targets. para:STX is Seagate (mid-price 799); core STX is Stacks (mid-price 0.27). Force-matching by string fabricates a tenth confrontation market that doesn't exist. Always verify mid-prices before pairing.
Economics: Venue Costs vs. Layer Revenue
No One Competes on Price Because Fees Have Hit Bottom
Everything hinges on two per-asset parameters publicly exposed in metaAndAssetCtxs: growthMode and deployerFeeScale. The all-in fee is base × (1 + s), where base is the standard perpetual schedule and s is the deployer coefficient, configurable from 0 to 3.00, capped at 1.00 under Growth Mode. The deployer takes s / (1 + s), making s = 1.00 split the difference. Growth Mode further slashes the all-in figure by at least 90%, conditional on the market being completely distinct from verifier-operated perpetuals, thereby excluding crypto assets and crypto indices.
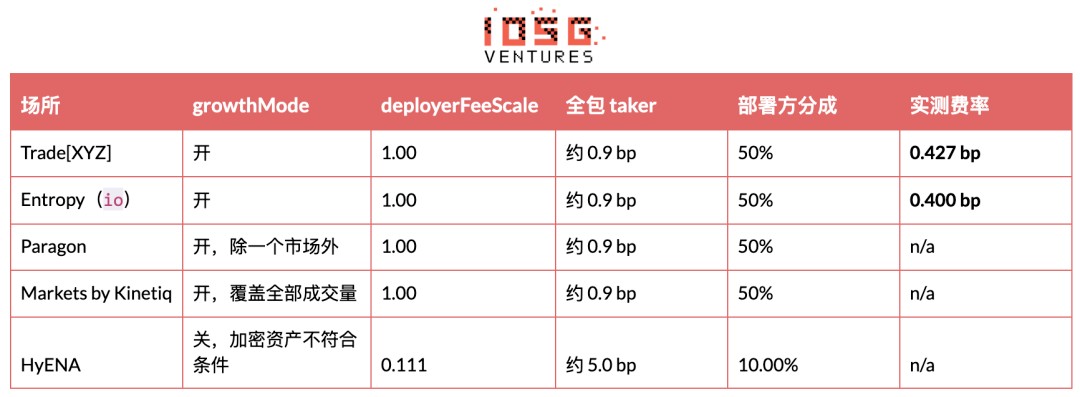
All equity-focused venues independently converged on identical configurations: maxed deployer splits with Growth Mode enabled. Even Entropy, armed with differentiated products and VC backing, refrained from undercutting. The sole outlier is precisely the venue that just halted trading.
Deployer splits can be accurately computed without any aggregators. Fee revenue accumulates in sub-accounts tied to the fee-receiving address: clearinghouseState with the dex field reveals unsettled balances, while transfers manifest in userNonFundingLedgerUpdates as sends where sourceDex matches the venue name. Payouts are highly irregular, necessitating measurements between intervals. Since its August 27 payout, Trade[XYZ] has accrued $1,380,592 against $32.30B in volume, equating to 0.427 bp or ~$79,000 daily. Entropy has never initiated a transfer, so its cumulative fees read directly: $41,468 on $1.036B volume, yielding 0.400 bp.
Two Expenditures, Radically Different Nature
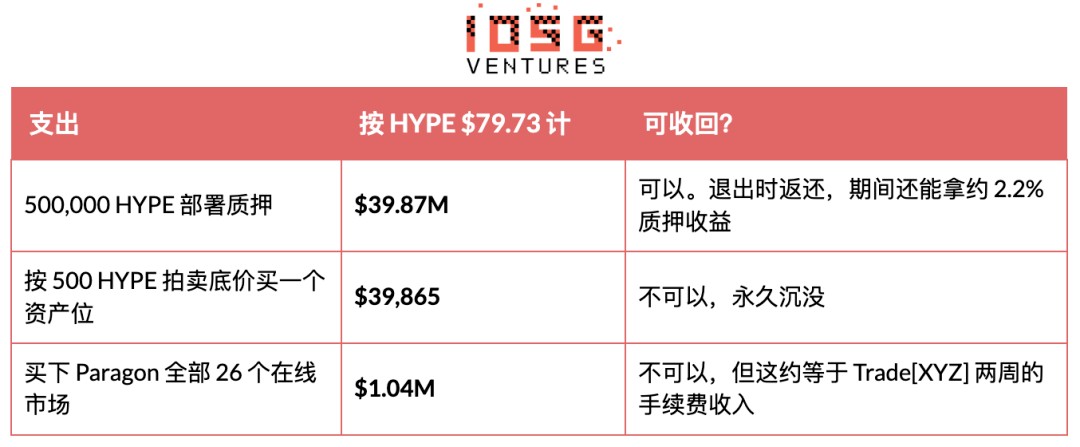
Staking represents the most intimidating figure, yet it returns intact. No one confiscates it. Entrusted to validators, it continuously generates staking rewards and refunds principal upon exit. Locked for a minimum of 183 days post-deployment, it faces slashing risk via weighted validator votes for malicious market operations (e.g., propagating faulty oracle prices), with slashing possible throughout the 7-day unstaking queue, meaning a clean exit requires at least ~190 days. Felix and dreamcash fully reclaimed theirs; current balances read zero.
Current active stakes: Entropy 500,973, Paragon 500,712, HyENA 508,915 (trading halted but unstaked pending), Kinetiq 588,489 (single stake covers both km and mkts), Trade[XYZ] 500,488 plus 500,269 on another address. ABCDEx holds merely 1,004 HYPE and has never staked.
Asset slot capital is the unfundamental expenditure—money that doesn't return. The first three assets on any perpetual DEX are free; thereafter, each additional market must be purchased via a 31-hour Dutch auction denominated in HYPE, starting at twice the last trade price and linearly decaying to a 500 HYPE floor. The auction entering September 14 opened and closed at the 500 floor, fixing an asset slot at ~$39,900. Slot demand has cooled from last week's clearance price of 582 HYPE.
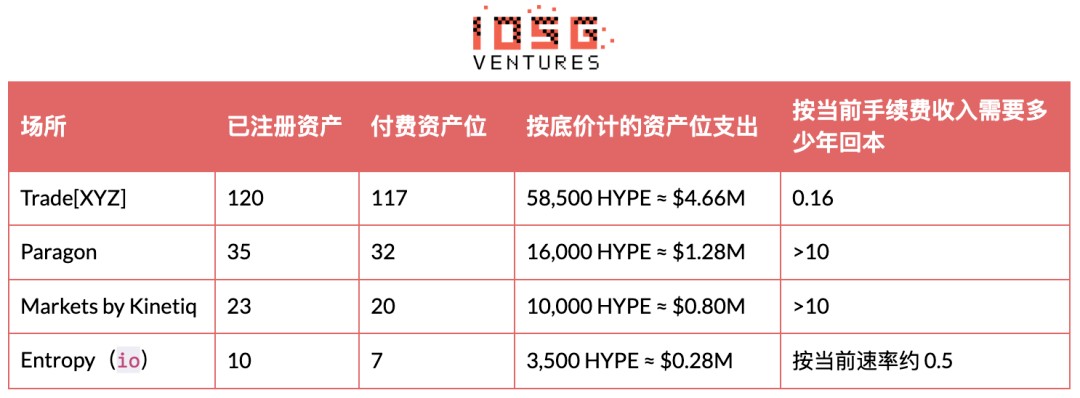
The final column contains the crux. Trade[XYZ] clears all listing liabilities with roughly eight weeks' fees. Every challenger except Entropy faces payback periods exceeding HIP-3's tenure; Entropy survives only because it purchased seven slots rather than thirty.
Time will amplify this asymmetry. Pausing a market is free and reversible; paid asset slots can be archived and relaunched, creating those "pending" targets. Reserve slots accumulate historically via the formula 7 + 0.2 × past auction deployments, granting Trade[XYZ] ~30 instantly usable slots while newcomers receive only 7. A venue launching today planning 20 markets can list 10 immediately; the remainder queues in auctions, one every 31 hours minimum. Entropy's answer ignores this cadence: it listed just five markets and made each count.
The Staking Yield Trap
Excluding Entropy, every challenger earns more passively from staking tickets than from running the exchange. Paragon's lifetime deployer revenue totals $64,281, whereas staking $39.87M at ~2.2% yields ~$877,000 annually—a 14x advantage.
This is hardly comforting. That yield originates from newly minted HYPE in the protocol's future emissions bucket—essentially inflation disguised as revenue, a dilution rebate on a forced-to-hold position, priced in the very asset operators are passively long. A 30% HYPE decline erases $12.0M from this stake, surpassing a decade of profits. Over the past eight days, HYPE fell from $88.37 to $79.73, wiping out ~$4.3M per active stake.
How Much Business Can This Fee Pool Support?
Growth Mode anchors effective fees near 0.4 bp, with deployers capturing half. Trade[XYZ] commands 97.8% share and ~$786B annualized volume, generating roughly $29M in yearly deployer splits. Rather than representing the leader's ceiling, this figure approximates the total layer-wide bonus given current volume and fee floors.
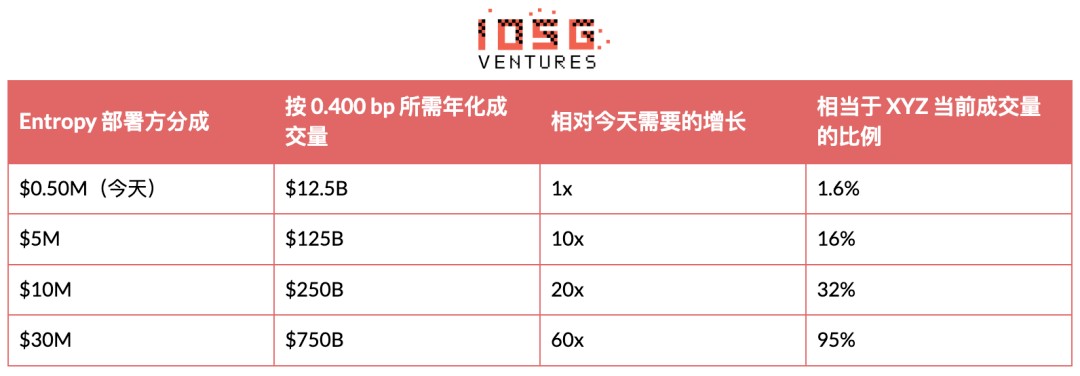
Across venues outside the leader, ~$167M in HYPE sits at risk today, yet collectively—alive or dead—they've earned only $747,000 in deployer splits over lifetimes. Viewed alongside a $14M seed round, this math proves: under current volume and fee floors, HIP-3 operators cannot value themselves via trading fees alone. Challenger value must stem from elsewhere—tokens, frontends, client relationships, or protocol-unpriced product advantages.
What Actually Defends a Position?
HIP-3 intentionally commodifies what a venue could otherwise defend. Staking is purchasable, targets are purchasable, fee floors are shared, and distribution channels are shared too, since every HIP-3 orderbook routes through identical frontends.
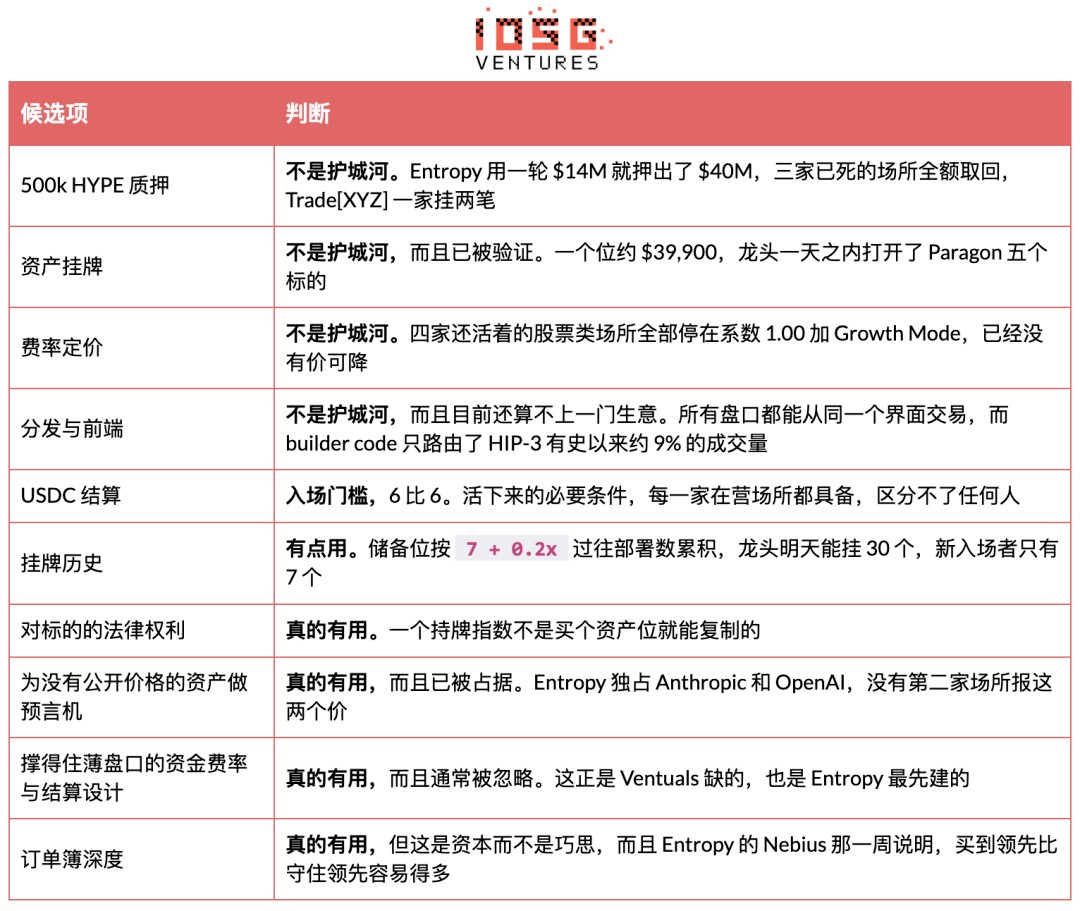
The meaningful filter question isn't "which assets will you list?"—assets are commodity. It's "what do you possess that the leader cannot purchase for the cost of one asset slot?" Among all venues operating on HIP-3, only one answers clearly: an oracle framework paired with a settlement architecture, not an asset roster.
Why Entropy stands out warrants precision, as the answer lies beyond tickers. Founded by researchers and traders from Citadel Securities, Optiver, Millennium, and Polymarket, this pedigree manifests in two places. First, bid depth present on launch day, which ultimately captivated Nebius flows. Second, its funding rate and settlement architecture reads as a direct patch for Ventuals' failure mode. Its $14M seed, led by Ribbit Capital, targets retail brokerage and fintech distribution rather than native DeFi—reflecting ambition to captive clients, not extract protocol yields. Naming caveat: Entropy Advisors (deeply tied to Arbitrum DAO) and a16z-backed custody startup named Entropy are entirely separate entities; do not infer ties to Hyper Foundation from mere nomenclature.
Viewing these pieces together, the lane remains thin. A contracting company holds 97.8% volume. A ring of challengers lock up $167M in HYPE for collectively $747,000 in historical fees. And the sole team demonstrating genuine quoting capability just proved it can capture a market for a week but cannot defend it.
A smoother alternative is claiming half the protocol's fees rather than operator revenue—unlocked, slash-proof, and burden-free. Yet it likewise fails to dominate the Hyperliquid perpetual base, and reality confirms HIP-3 >50% share is merely a calm-market illusion, not a trend.
The Routing Layer, and Actual Traffic Reach
Builder code represents the closest approximation to a "distribution business" on HIP-3. Frontends tag orders they originate, earning builder fees without posting margin. Flowscan counts 819 such tagged streams.
Traffic interception remains low. Routed volume totals ~$52.6B, roughly 9% of HIP-3's all-time $587B; the recent 30-day routed figure is ~$5.3B against $66.09B, or ~8%. Over 90% of traffic bears no frontend tagging, consistent with an orderbook dominated by market makers and API traders.
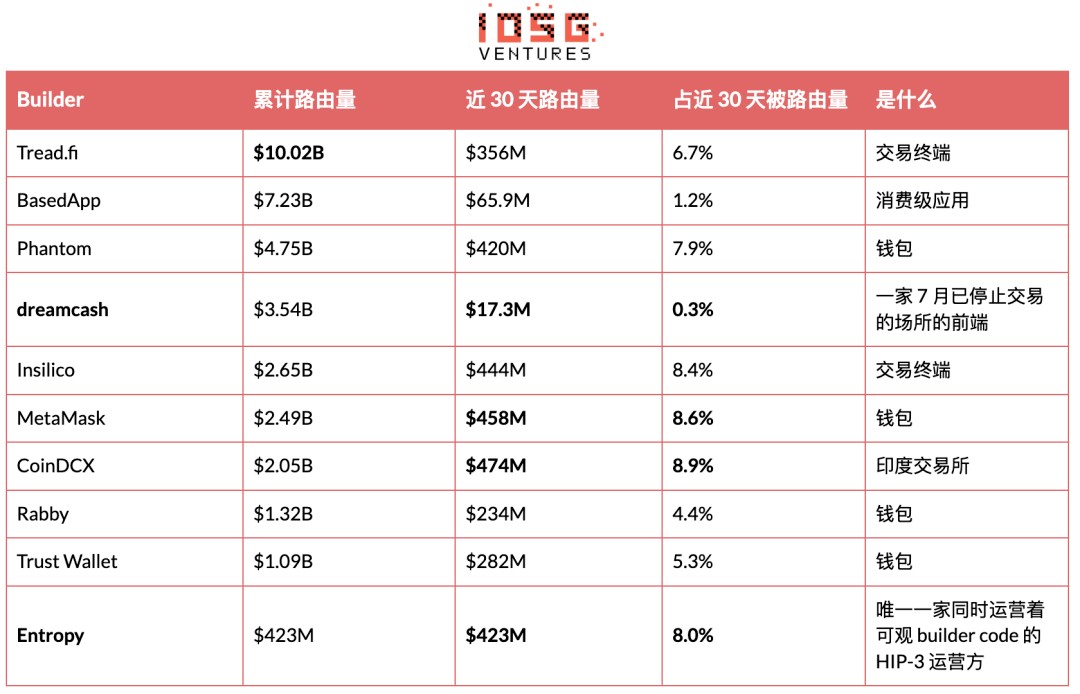
Column four's denominator covers the recent 30-day $5.30B routed exclusively via builder code, not HIP-3's $66.09B total. Switching to the latter, the largest player, CoinDCX, claims just 0.7%. The ten tabled entities aggregate 59.7% of routed volume; given Flowscan's total of 819 builder codes, the trailing 809 divide the remaining 40%.
Two items warrant extraction from this table. Entropy's $423M routed volume occurred entirely within the last 30 days, coinciding with $1.03B on its own venue—meaning ~40% of flow originated from frontend infrastructure it controls. Ribbit's seed-round retail brokerage ambitions materialize in the data, not mere press releases, underscoring a business model fundamentally distinct from "deploying."
Another is dreamcash, a cleaner lesson. Its venue expired July 2, self-orderbook metrics hit zero, yet its builder code routed $17.3M recently and $3.54B cumulatively. Operator businesses and frontend distribution cleanly decouple, yet only one demands $40M entry capital.
Third-party dashboards harbor a common counting trap. Venue leaderboards default to cumulative volume, making months-closed venues appear dominant. dreamcash shows a 3.3% HIP-3 share across full-lifetime views but registers $0 in any recent window. Always verify calculation windows before citing share metrics.
Frontends truly commanding attention mostly aren't deployers. Coinbase unveiled a simplified perpetual interface inside its wallet on September 12, powered by Hyperliquid, covering crypto, tokenized equities, and prediction markets for non-US users. Kraken's parent separately negotiates integrating Hyperliquid perpetuals into a regulated US venue. Neither plans to post that 500,000 HYPE stake.
Conclusion: Hard to Be Optimistic About Additional HIP-3 Deployers
Synthesizing preceding analysis, launching a new HIP-3 venue confronts this arithmetic:
Combined HIP-3 volume outside the leader totals $1.49B over 30 days, ~$18.1B annualized. At empirical 0.400 bp, that yields $725,000 in annual deployer splits distributed across four venues. Those four currently lock ~$167M in HYPE. Passive staking that capital at 2.2% generates $3.67M annually.
In other words, operational earnings from running these exchanges amount to roughly one-fifth of passive staking returns on identical capital.
This isn't an undeveloped market; it's a market priced near zero, with measurable reasons detailed previously. Asset slots cost $39,900 apiece—nothing defended by listings alone. Fee floors are shared—no room to undercut. Distribution is shared—builder code captures only 9% of traffic. Settlement assets have bifurcated 6-to-6 into USDC, and AQA v2 explicitly denies HIP-3 fee preferences, confirming protocol indifference to subsidizing this layer.
The harder constraint is the ceiling. Despite commanding 97.8% share and every structural advantage, XYZ achieves only 1.2% penetration on the nine tickers it quotes, with relative share compressing further in core storage targets. New entrants face not "the leader is massive," but "the leader is already shrinking and shrinking faster."
Only one exception remains outlined above: irreplicable rights, proprietary oracle architectures, or funding-rate/settlement designs surviving thin orderbooks. Entropy fits perfectly, yet gets repelled after one week. Asset rosters are irrelevant; two independent datasets confirm this.
What Would Alter This Thesis?
· Entropy defends a contested market for a month rather than a week, stabilizing SanDisk share above floating ~13%. Accumulating open interest amid falling volume share remains the primary signal due to its superior reliability over raw volume.
· Entropy launches its DRAM index and KR tickers. Directly attacking core territory rather than hunting un contested pre-IPO names yields a far cleaner stress test than Nebius.
· Tokenomics resolves the equity ledger. Fee economics fail, and tokens don't exist yet.
· Pre-IPO segment sustains momentum. Anthropic's orderbook faded post-week-one; OpenAI opened at $5.3M/day, now consolidating near $4M. Stabilization on either validates a category, not a launch spike.
· AQA v2's inaugural disbursement hits in early October. First observable measure of protocol USDC yield, cross-checking current $135M–$200M third-party ranges.
· Fee floor relaxation. Early-August signaling suggested future upgrades permitting HIP-3 deployers to hike per-target fees up to 3x, rolling back Growth Mode discounts. No timeline exists; every Figure in Section 6 rests on current floors.
· Whitelist markets ship. Announced Sept 3, HIP-3* enables optional on-chain whitelisting constraining wallet access per market, pitched for compliance/institutional gates; testnet-only today. First mechanism potentially shifting scarcity from "assets" to "access rights."
· A team secures exclusive data/index licenses while targets genuinely demand 24/7 crypto-native liquidity. Still the sole configuration rendering slot-acquisition logic obsolete.
· Evidence leader volume collapses post-Growth Mode expiration. Current 0.427 bp averages roughly 1/10th of standard schedule pricing; if waiver-dependent, leadership stability falls short of share metrics imply.
· HyENA unstakes its 508,915 HYPE, confirming terminal cessation over dormant waiting.
Limitations
· Slot-acquisition thesis relies on empirical share but infers motive. Simultaneous listing of five targets could equally reflect a synchronized deployment pipeline.
· Entropy assessment derives solely from 26 days. Nebius lead and reversal represent single-week, mid-cap readings; neither qualifies as established precedent.
· Team backgrounds and funding rounds cite corporate filings/media; unsupported by on-chain verification.
· Volatility findings in Section 2 track 45 weekday samples correlating, not causally decomposing. Volume and realized moves may jointly respond to cooling AI cap-ex sentiment.
· Trade counts ≠ unique traders; public API precludes independent user derivation.
· Capital return projections assume HYPE $79.73 and 2.2% annualized staking APY—a protocol parameter, not contractual guarantee, inversely scaling with network staking ratios.
Join TechFlow official community to stay tuned
Telegram:https://t.me/TechFlowDaily
X (Twitter):https://x.com/TechFlowPost
X (Twitter) EN:https://x.com/BlockFlow_News
 IOSG Ventures