IOSG | EIP-8363 Quantitative Review: Cutting Staking "Subsidies," What Does Ethereum Want to Gain in Return?
Author:Mario Chow, IOSG
EIP-8363 proposes: As the staking rate rises, an increasingly larger portion of validator rewards is burned, reaching 100% burn when 50% of the supply is staked. This paper models its impact on issuance, yields, and staking equilibrium; examines whether ETH’s yield has actually explained its price; quantifies how much of the onchain economy truly depends on this yield; and presents our conclusions.
All calculations are built on-chain data and the EIP specification. The model was independently constructed and aligns with publicly available third-party data within a 2% margin. Data updated to August 24, 2026.
One-Sentence Thesis
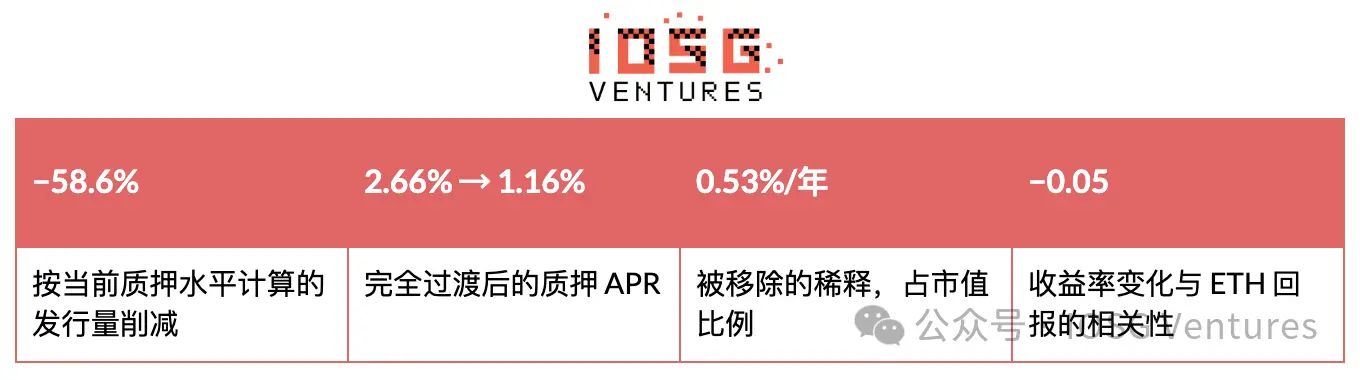
Fee burns are dead, making issuance the only remaining lever Ethereum holds over ETH supply. At current staking levels, this proposal halves issuance rather than zeroing it out; moreover, it is self-limiting: under any reasonable validator threshold yield, the system will eventually stabilize at 26–34% of supply staked and 0.3–0.5%/year in issuance. Meanwhile, there is no detectable relationship between the reduced yield portion it cuts and ETH prices.
I. The Burn Mechanism Is Broken
EIP-1559 burned 1.48 million ETH in 2022. EIP-1559 burns the base fee, which is in essence congestion pricing; once blobs move rollup data off L1 and the gas limit is raised, congestion disappears: gas usage doubles while the average base fee drops 96%, causing burns to fall 98% since 2022. Over the past twelve months, it burned a total of 25,660 ETH, with an even lower recent 30-day run rate of just 39 ETH per day, annualizing to ~14,300.
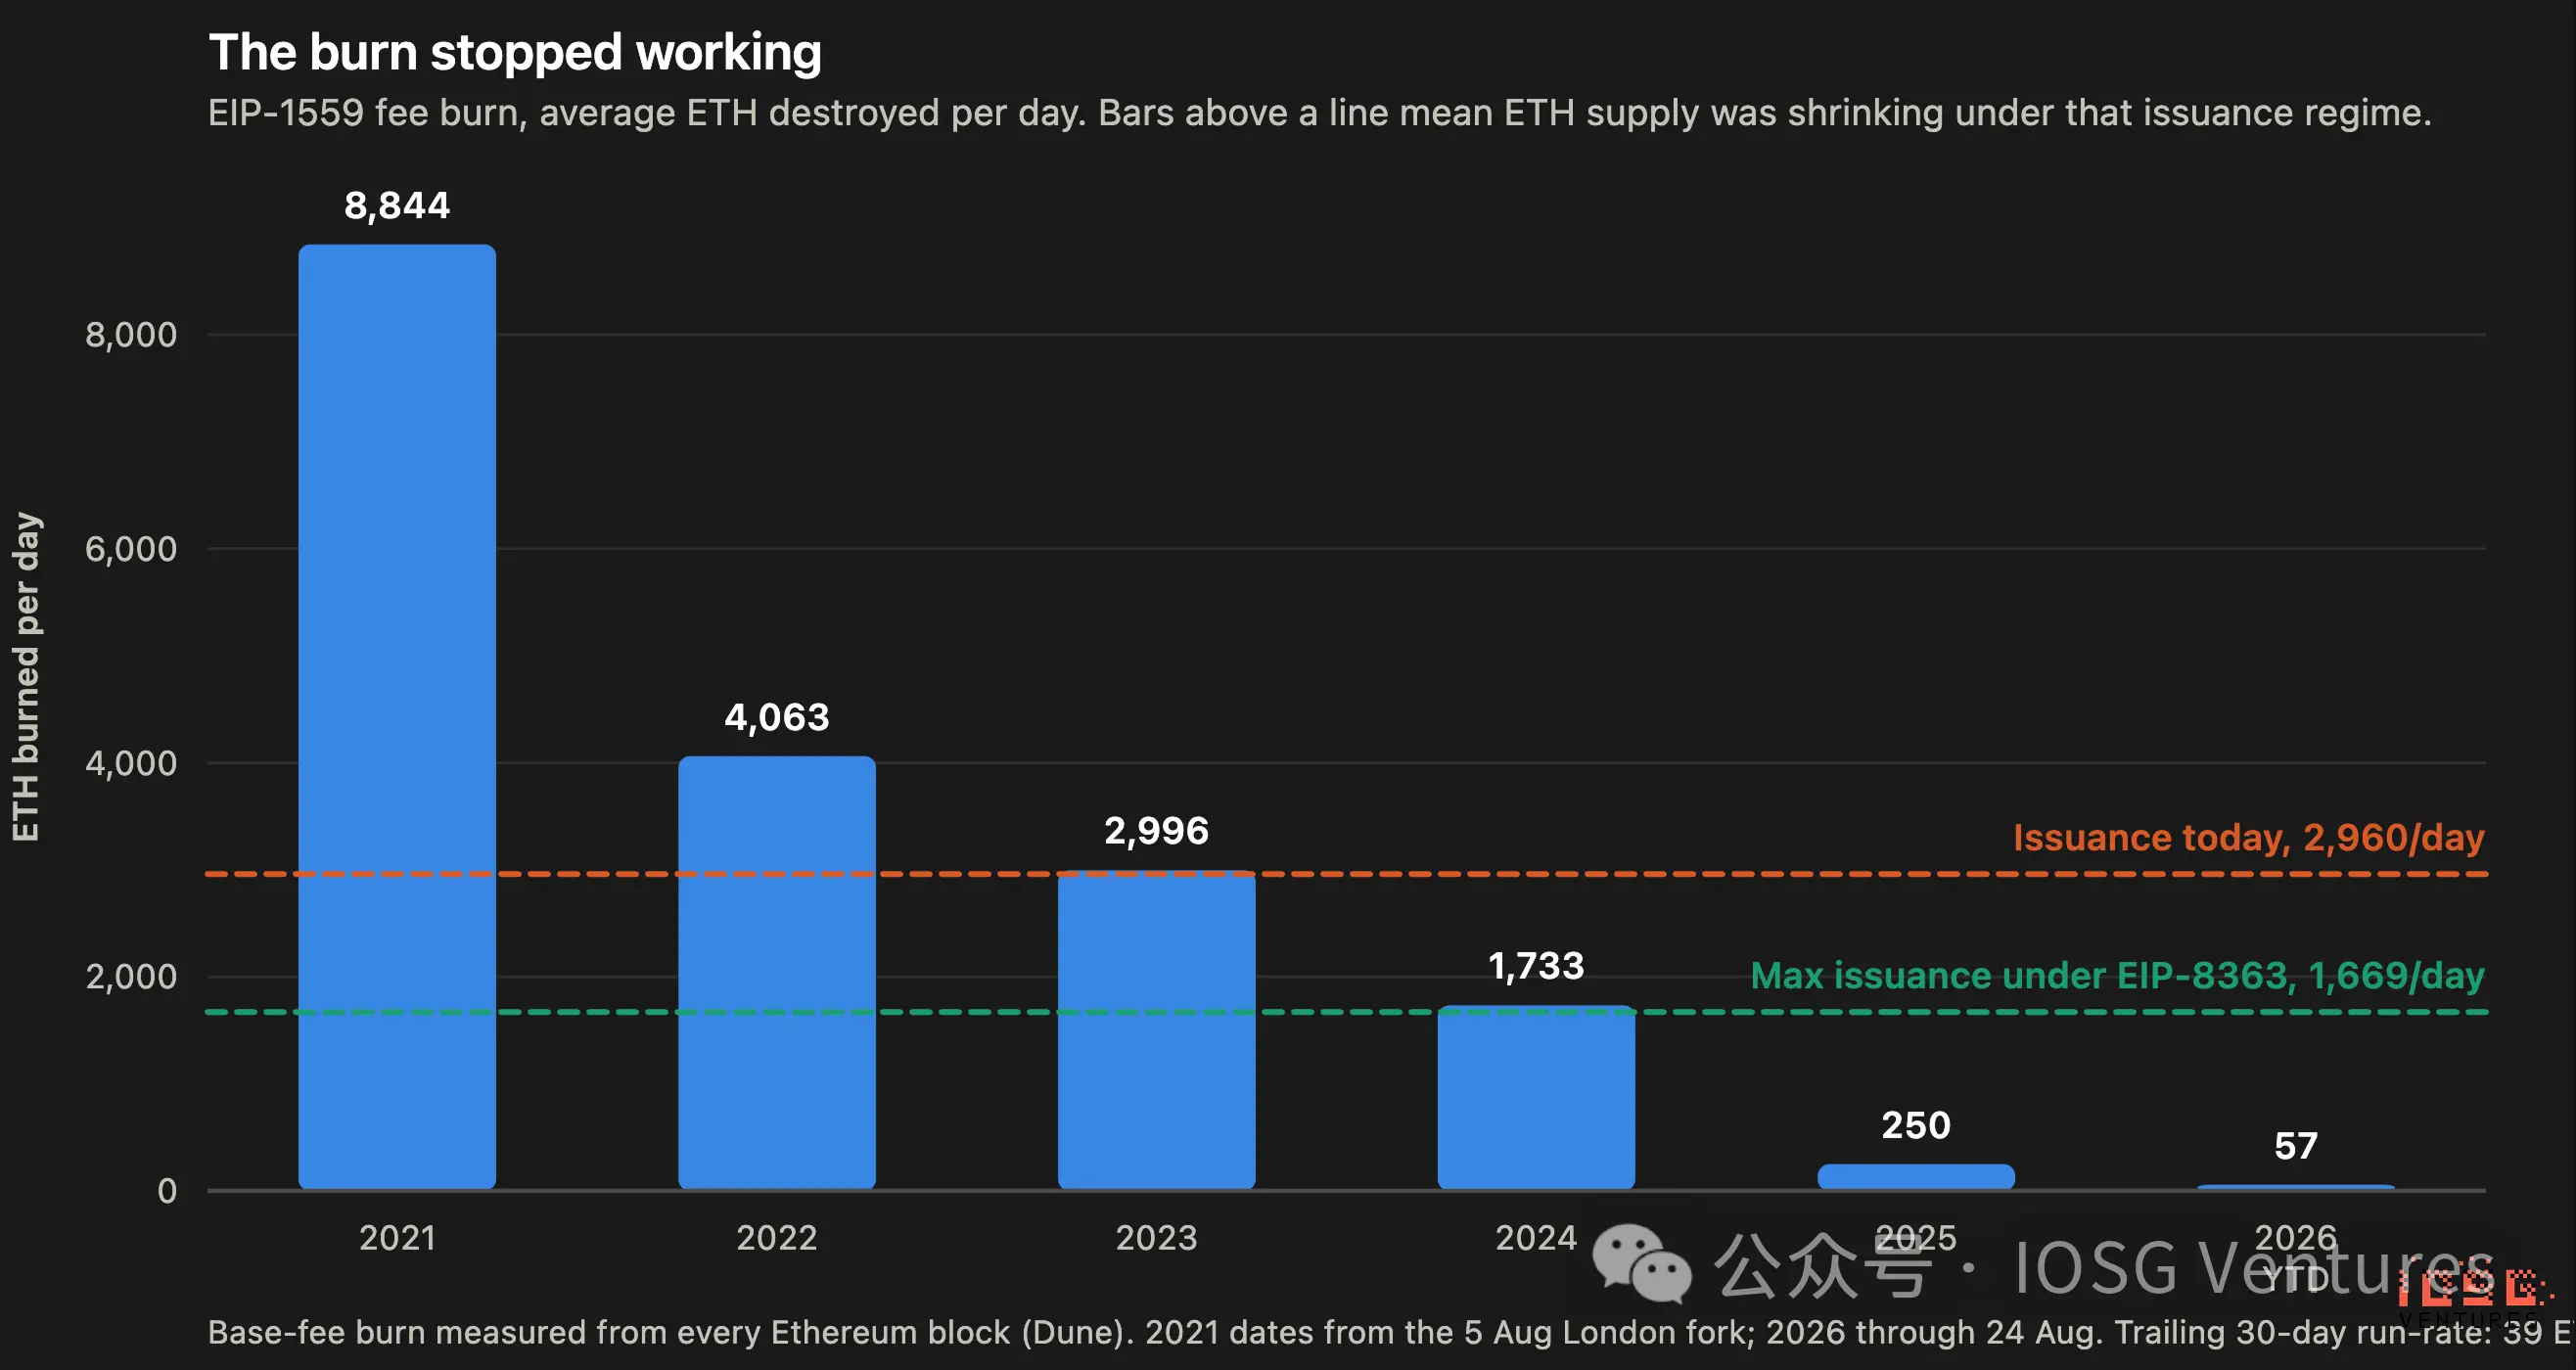
▲ Daily EIP-1559 fee burns by year: dropping from 8,844 ETH/day in 2021 to 57 ETH/day in 2026—far below both the current issuance curve and the maximum issuance curve under EIP-8363.
Against a total issuance of ~1.08 million ETH/year, burns currently offset only 2.4% of new supply. As a mechanism, “ultrasound money” is dead. L2 migration and blob expansion moved the fee base away from L1: during the same period, L1 gas usage actually doubled (3.4B → 6.7B units/month), while the average base fee fell from 4.00 gwei to 0.17 gwei: thus, this is a price effect, not a demand effect.
Net Issuance: What Actually Happened to Supply
Burns are only half the ledger. Viewed alongside issuance, the picture is more severe: issuance never stopped growing, while the offset vanished beneath it.
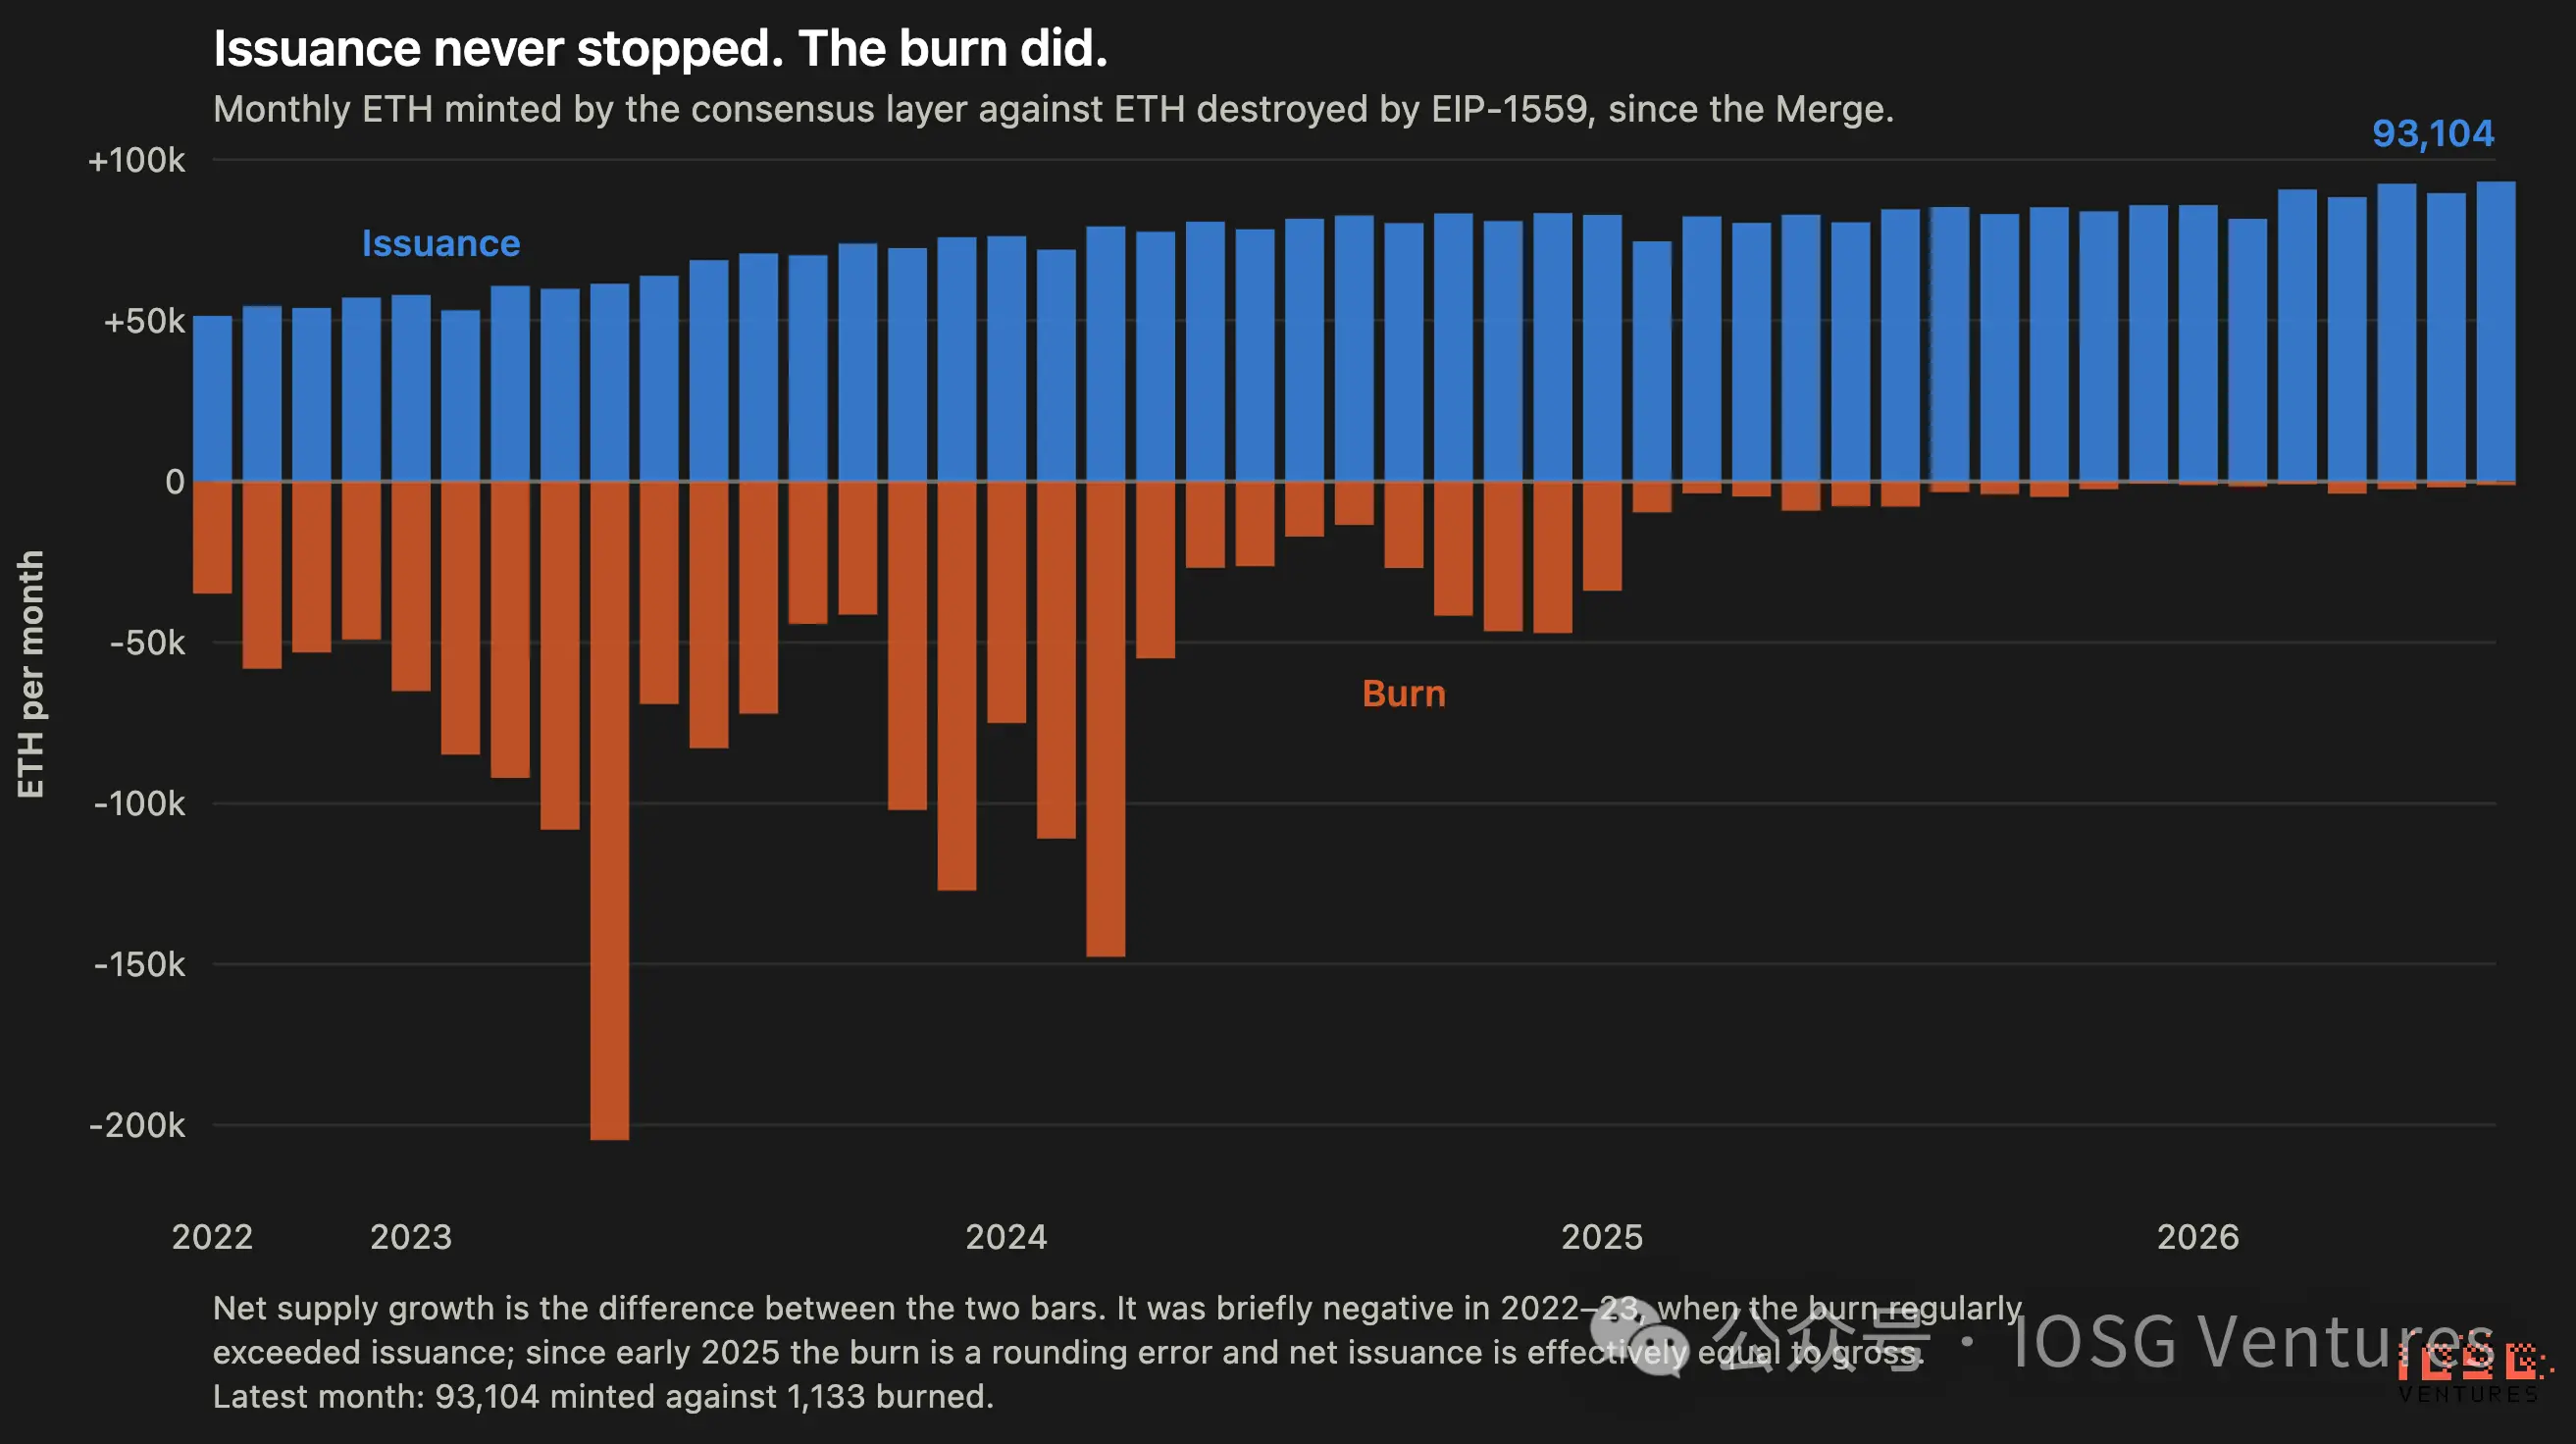
▲ Monthly consensus-layer minted ETH versus EIP-1559 burned ETH since the Merge. Issuance bars trend steadily upward; burn bars nearly shrink to zero by 2025.
In the 47 months since the Merge, only 13 were deflationary, with March 2024 being the last. ETH has been inflationary for 28 consecutive months, with the rate roughly tripling from +0.26%/year to +0.87%/year during this period. This isn’t due to issuance growth (which increased only 4% since 2024), but because offsets hit zero.
This reframes the entire debate. EIP-8363 is usually framed as a trade-off between staking yields and monetary scarcity. But a more accurate reading is much narrower and more forced: issuance policy is now Ethereum’s sole remaining lever over ETH supply, because the demand-driven one stopped working. Whether legislated or not, all supply dynamics now pass through the issuance curve.
II. What EIP-8363 Actually Does
Before dissecting the mechanism, we must address its core stated motive: securing network safety. Proponents argue that once the network staking rate crosses the 50% red line, Ethereum loses its “social layer defense” capability and faces systemic parasitic risks from too-big-to-fail LST oligopolies. Thus, the proposal attempts to lock the staking cap via mandatory rate cuts. Yet grand security philosophies often obscure the raw accounting realities. Stripping away metaphysical debates on decentralization, what does this mechanism actually mean in the real onchain economy? Here is a pure quantitative deduction.
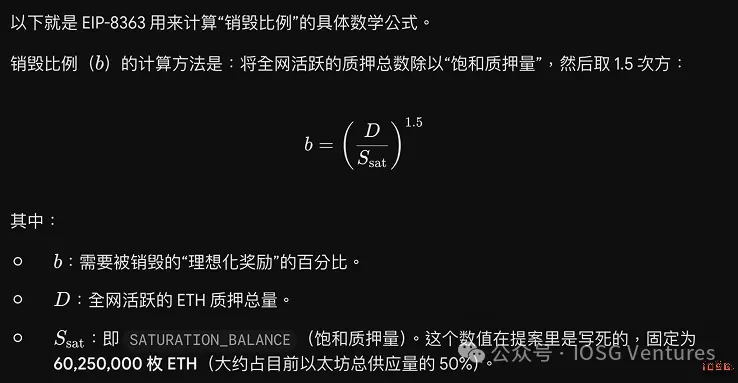
How Is It Deducted? (Core Mechanism)
- Mint first, deduct later: Validators initially earn full rewards across all duties, after which the system directly “burns” a portion at a specified ratio (denoted as b).
- Deduct based on “theoretical maximum,” avoiding double punishment: The key here is that the system calculates burns based on the full theoretical reward you should receive, not your actual realized reward. Why? Because if you accidentally go offline, you wouldn't get rewards anyway; deducting based on reality would unfairly penalize offline validators twice. Burning based on the “theoretical value” preserves incentives for active participation while ensuring offline validators aren’t doubly penalized.
- Extreme case protection: If the Ethereum network experiences severe issues (entering inactivity leak state), this burn targeting attestation rewards is paused.
- Off-snapshot capture: This proposal only touches consensus-layer rewards. Your “side income” from running a node—namely MEV and Priority Fees—is untouched entirely.
Two Most Common Community Misconceptions
Misconception 1: “ETH’s issuance will be cut straight to zero”
- Truth: Not remotely close. Current staked volume is ~42.2 million ETH, at which level the burn ratio b stands at 58.6%.
- To fully zero out issuance, staked volume would need to surge to 60.25 million ETH (43% higher than today). So the accurate take is: at this stage, the proposal merely halves issuance, far from complete zeroing.
Misconception 2: “Yields crash instantly, triggering a DeFi collapse on day one”
- Truth: Officials designed an 18-month “soft landing” period, making day-one impacts virtually imperceptible.
- To prevent shock spikes, the proposal immediately doubles the base parameter used for reward calculation (base reward factor) to 128 upon launch. This doubling precisely offsets the aforementioned 58.6% burn.
- In other words, on upgrade day one, net network-wide issuance remains at ~83% of current levels. Over the following 18 months, the parameter gradually reverts to its standard 64, sliding issuance down to ~41% of today’s levels.
- Summary: Yield compression happens gradually over a year and a half, not via overnight collapse. Fears of “instantly bursting the DeFi bubble” overlook this buffer mechanism.
III. Baseline: Where Ethereum Stands Now
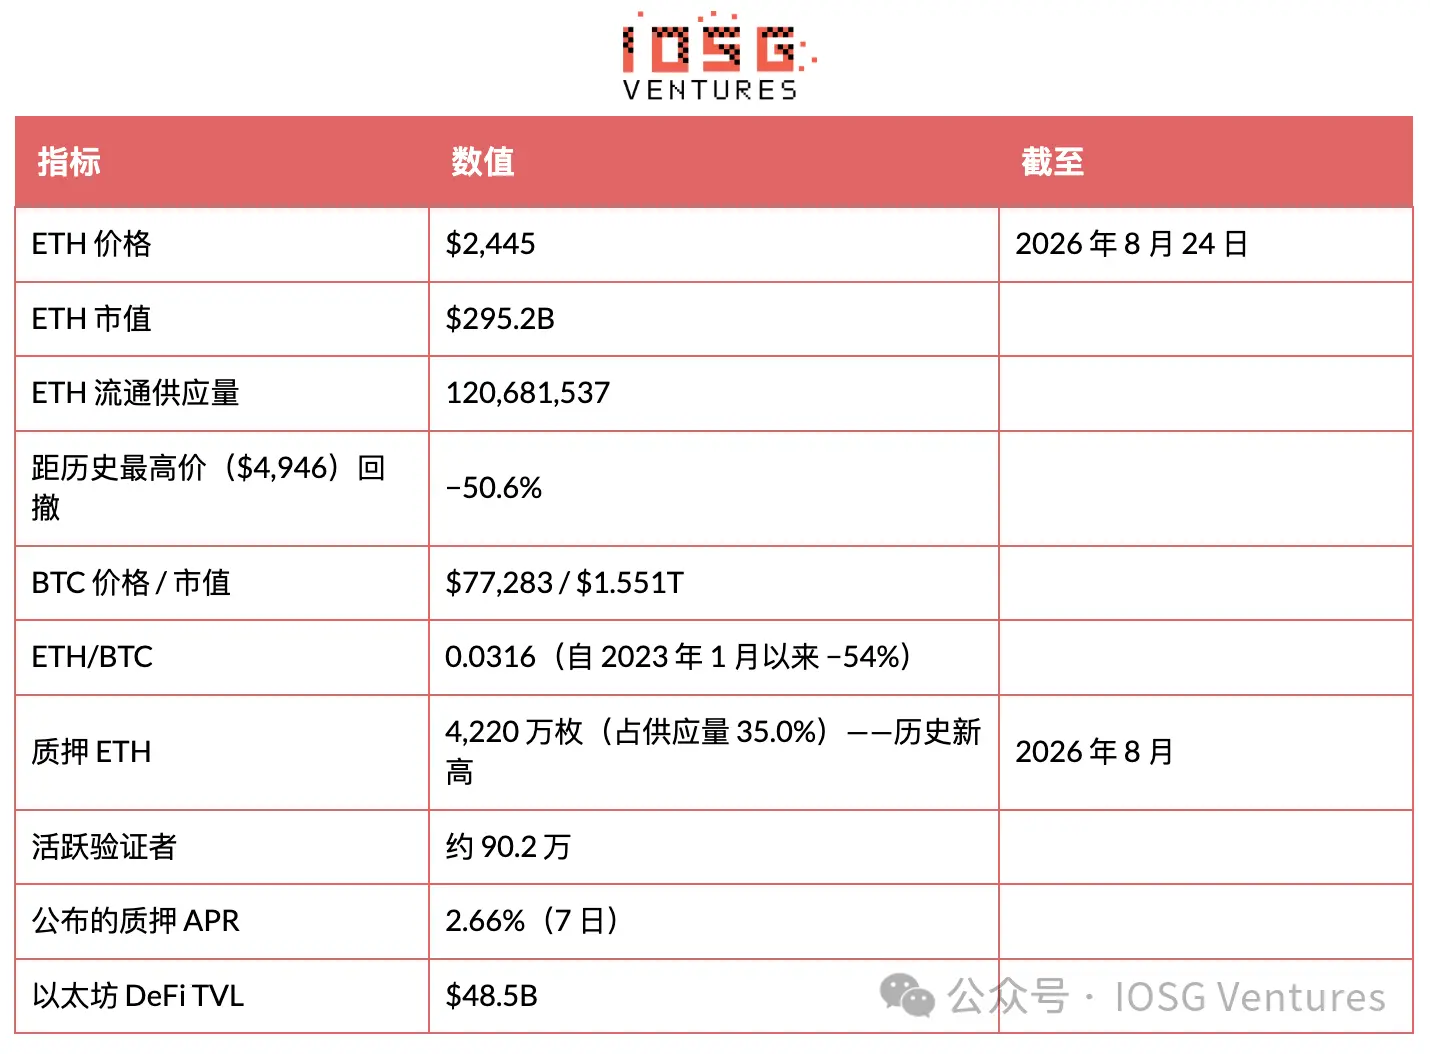
Supply Dynamics
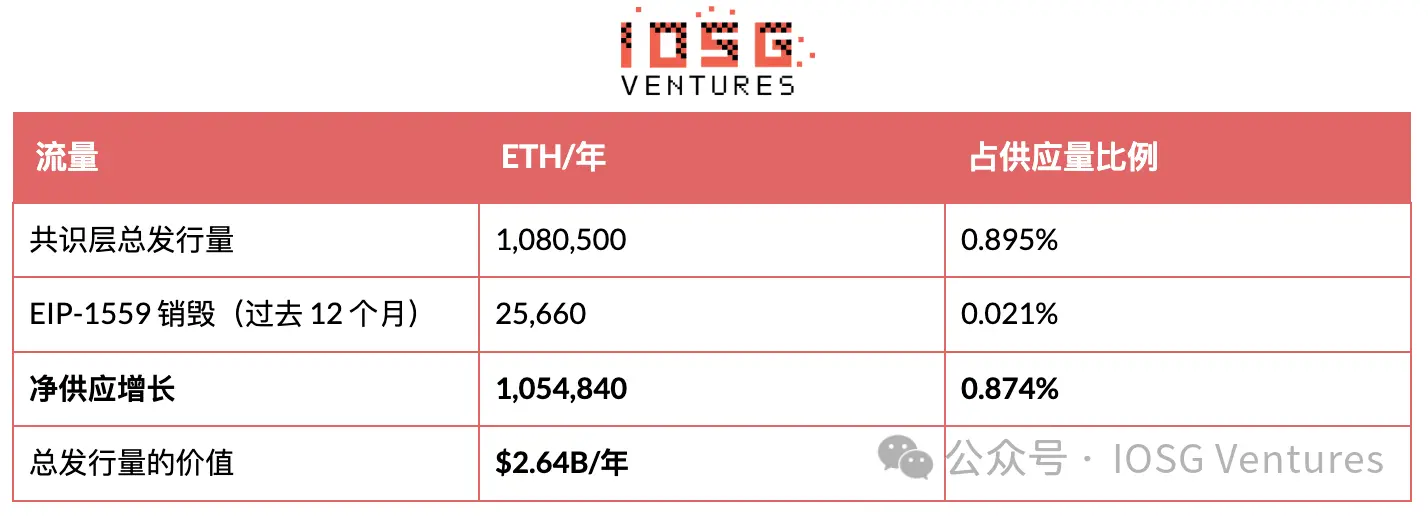
Where Issuance Comes From
Entirely from staking rewards. Post-Merge, new ETH has only one source: consensus-layer payments to validators, distributed across three duties per fixed protocol weights (denominator 64): attestations 54/64 (84.4%, 911,672 ETH/year), blocks 8/64 (12.5%, 135,063), sync committees 2/64 (3.1%, 33,766).
Issuance is modeled as I(S) = 940.9 · √(S/32) ETH/year, the protocol’s own reward curve. At S = 42.2 million, this implies a consensus-layer APR of 2.560%. Observed priority fees over the first 23 days of August totaled 2,623 ETH, annualizing to 41,500 ETH—or 0.098% on the staked base. Combined, they sum to 2.658%, closely matching the published 2.66%.
Based on observed priority fees, validators earn at least 96% of income from issuance and at most 4% from fees. Proposer payments in MEV-boost exceeding direct priority fees are unaccounted for, making the fee share a lower bound. Regardless, issuance dominates absolutely, and this ratio is the crux of the entire debate.
IV. Modeling the Proposal
Early attempts sought to design entire networks around “hoarding” rather than patching existing ones. Two leading coins paved this road with entirely opposing bets. The third case was built for banks, not individuals, yet belongs to the same family.
Applied at Current Staking Levels, Ignoring Behavioral Responses
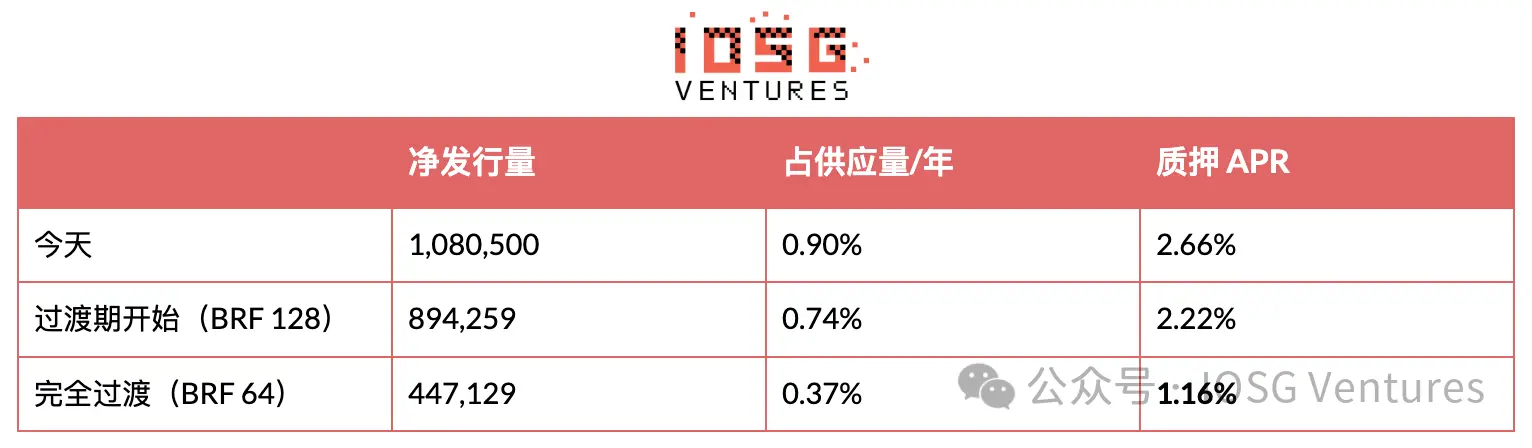
Issuance reduction: −58.6%. Staking APR reduction: −56.4%. Removed dilution: 633k ETH/year = $1.55B/year = 0.53% of annual ETH market capitalization.
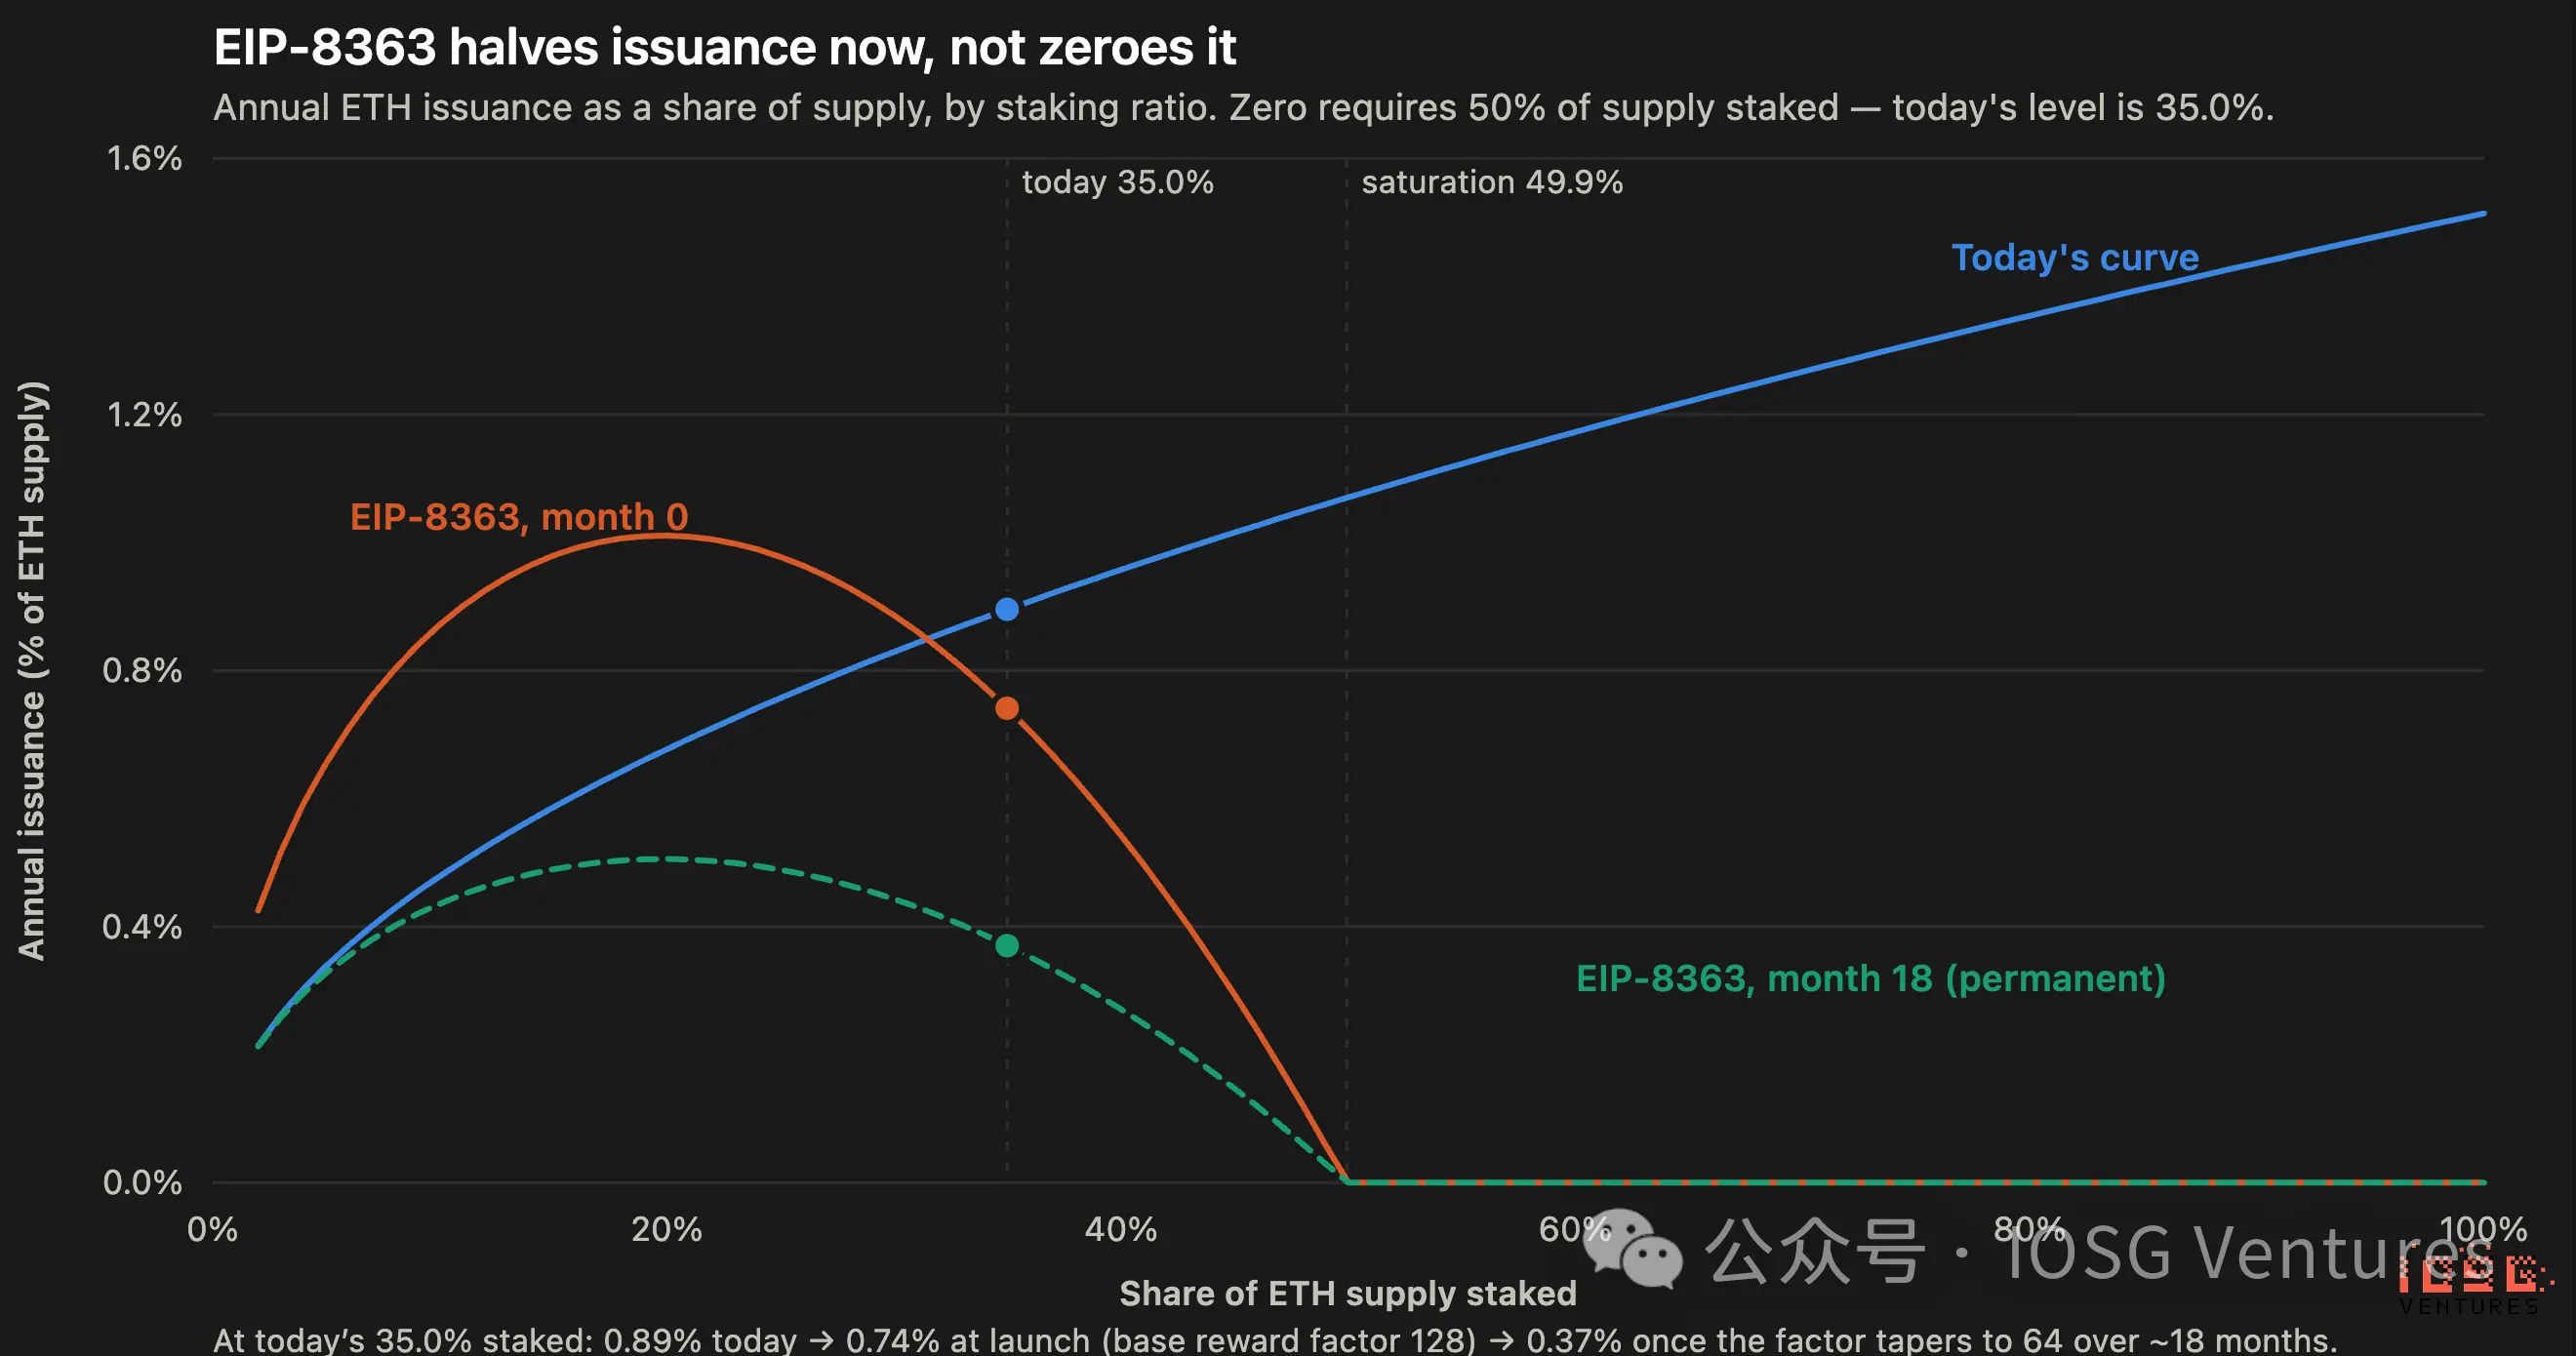
▲ Relationship between annual ETH issuance as % of supply and staking rate. Today’s curve trends steadily upward; the EIP-8363 activation curve peaks near ~1.0% around 20% staking; the permanent curve peaks at ~0.5%. Both curves drop to zero at 50% staking.
Full Curve (Post-Complete Transition)
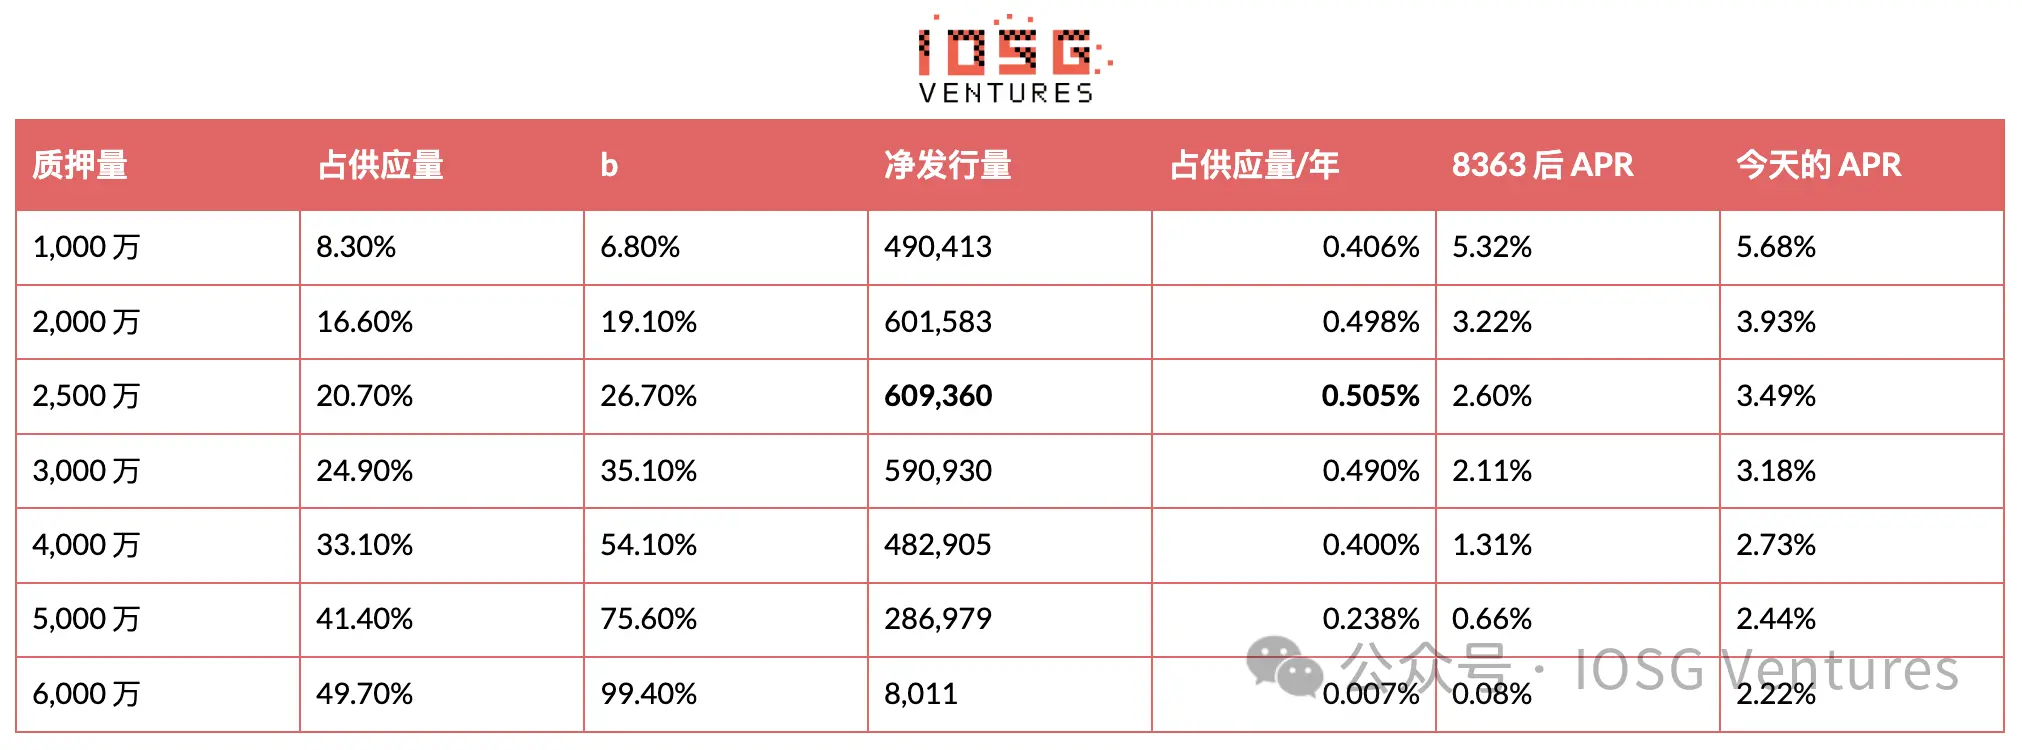
Issuance peaks around ~25 million staked, representing ~0.505% of supply, before declining—consistent with the EIP’s own claims.
Equilibrium—The Number That Truly Ends the Debate
Validators are not passive. If yields fall below their required return, they exit, pushing up gross APR and lowering b simultaneously. Solving for the fixed point:
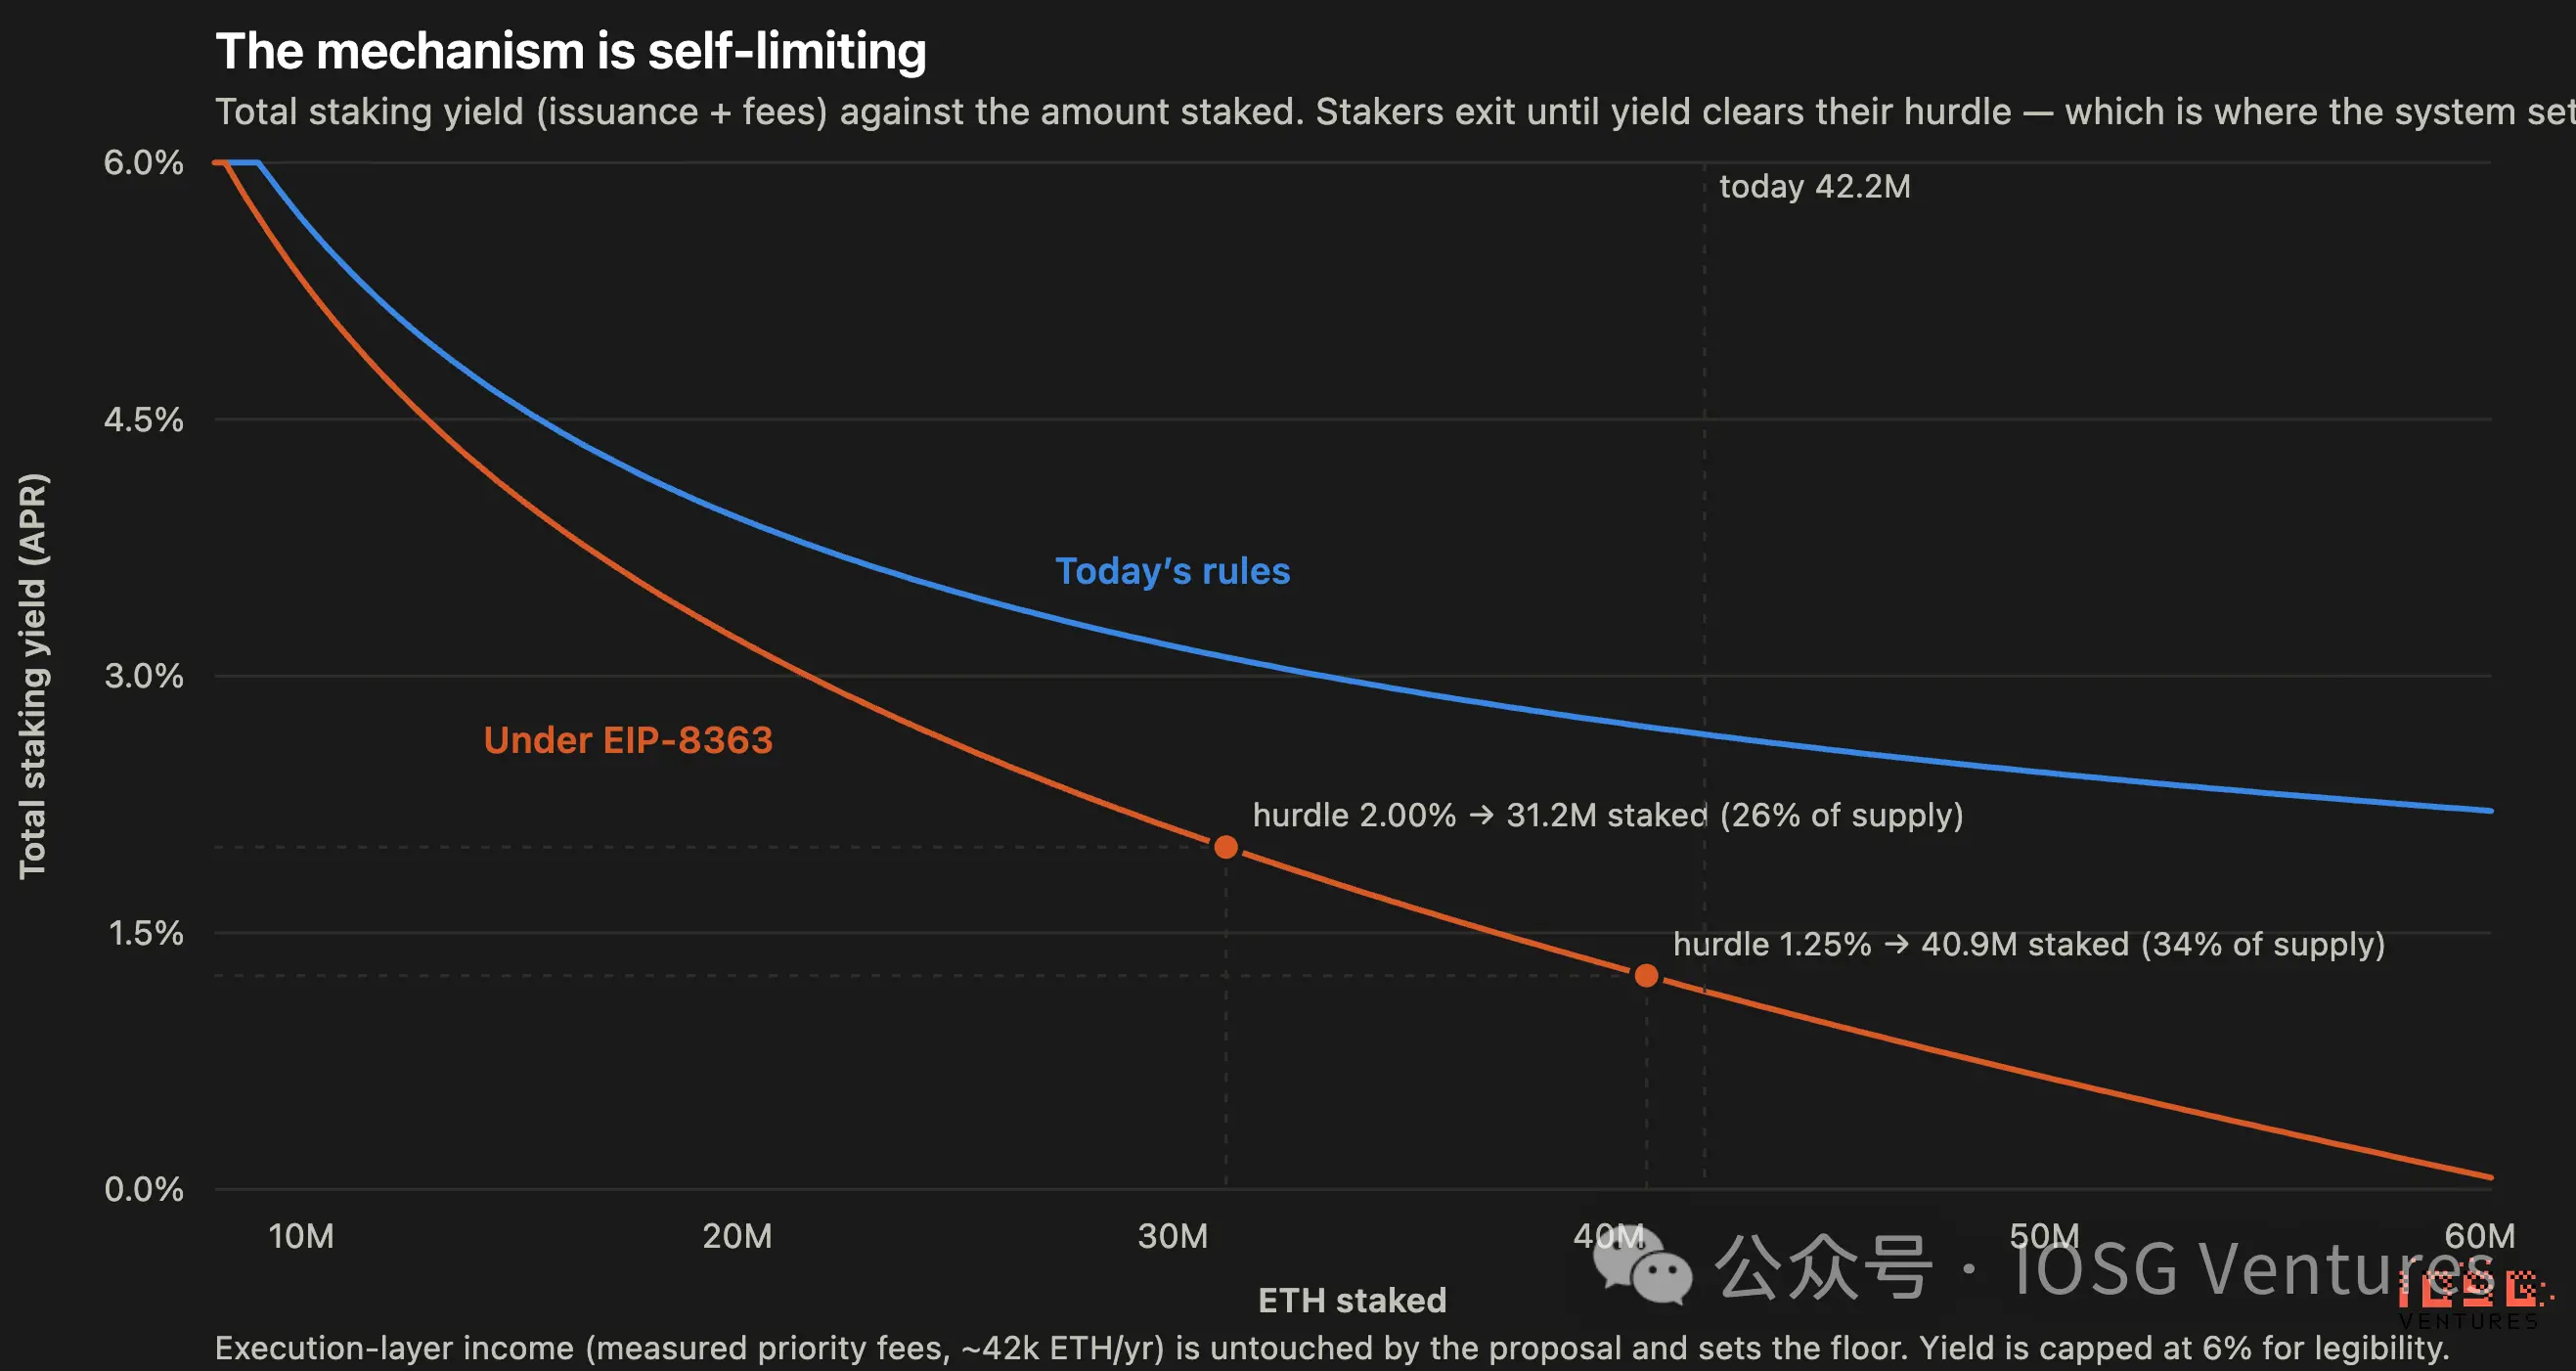
▲ Relationship between total staking yield and staked ETH quantity under current rules vs. EIP-8363. The EIP-8363 curve intersects the 2% threshold at 31.2 million staked and the 1.25% threshold at 40.9 million.
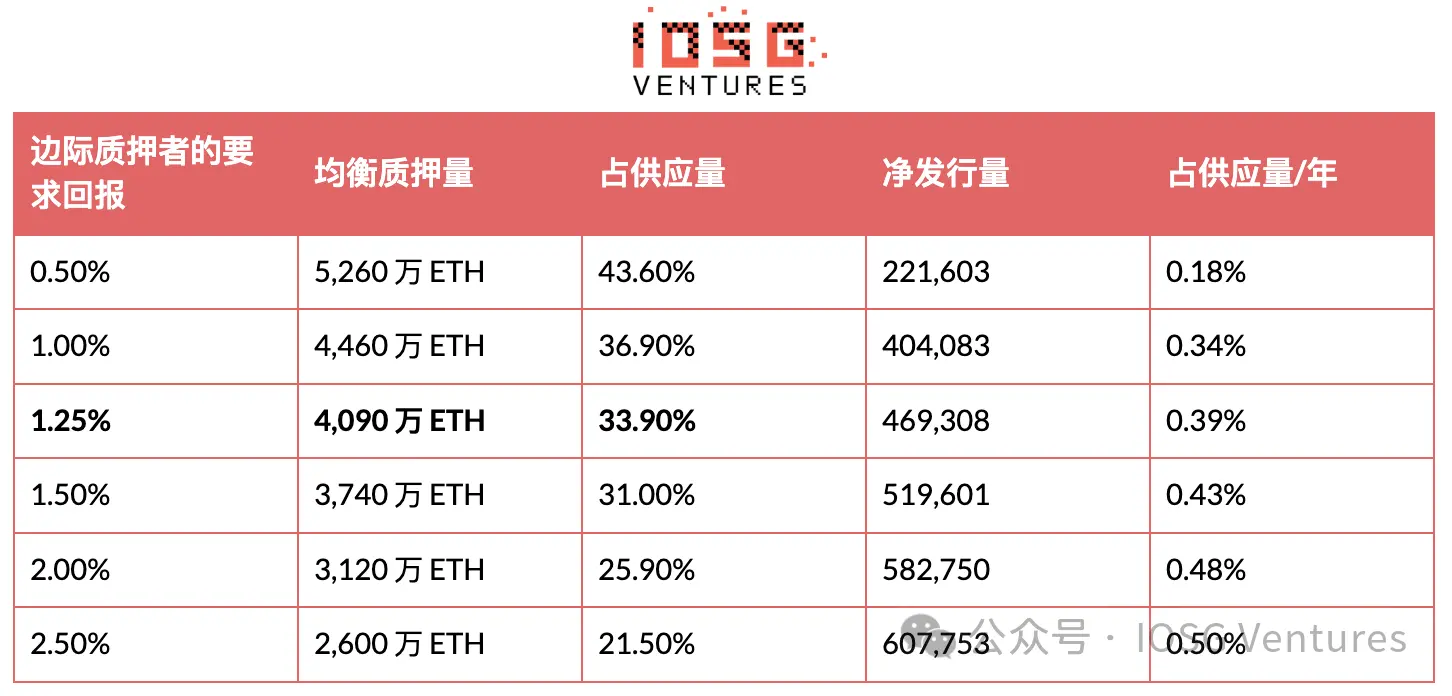
Read against the two loudest claims in the debate:
- “Issuance will go to zero.” This only holds if marginal validators are willing to work for ~0.5% returns. Under any reasonable hurdle rate, ETH still inflates at 0.3–0.5%/year. Supporters exaggerated.
- “Staking will collapse.” At a 2% threshold, staking stabilizes at 26%: lower than today’s 35%, but roughly aligning with 2024 full-year levels. Critics also exaggerated.
This mechanism is intrinsically self-limiting by design. This is its most intriguing property, and simultaneously the least discussed.
V. Can Staking Yields Explain ETH Price?
First, Address the “Meta-Question”
Are staking rates and yields correlated? Yes: perfectly. And it’s definitional, not empirical. This must be clarified upfront, as it dictates what the data can and cannot prove.
The reward pool paid by the protocol scales with the square root of the staked balance, yielding a closed-form solution for yield per ETH:
issuance(S) = 940.9 · √(S/32) ETH/year APR(S) = issuance(S)/S = 166.28 / √S
The more is staked, the more a single pool is split among additional tokens. The correlation between staking rate and issuance yield is structurally −1. Plotting them together is merely plotting an identity.
The only free variable is the gap between published yield and the formulaic value: fee revenue. It was ~1.34 percentage points in 2022 and 0.10 today.
Correlation Itself
Answer: None. 43 months, January 2023 → July 2026. (Data refresh on August 24 did not rerun this; window ends July 2026, and subsequent price action does not alter the result.)
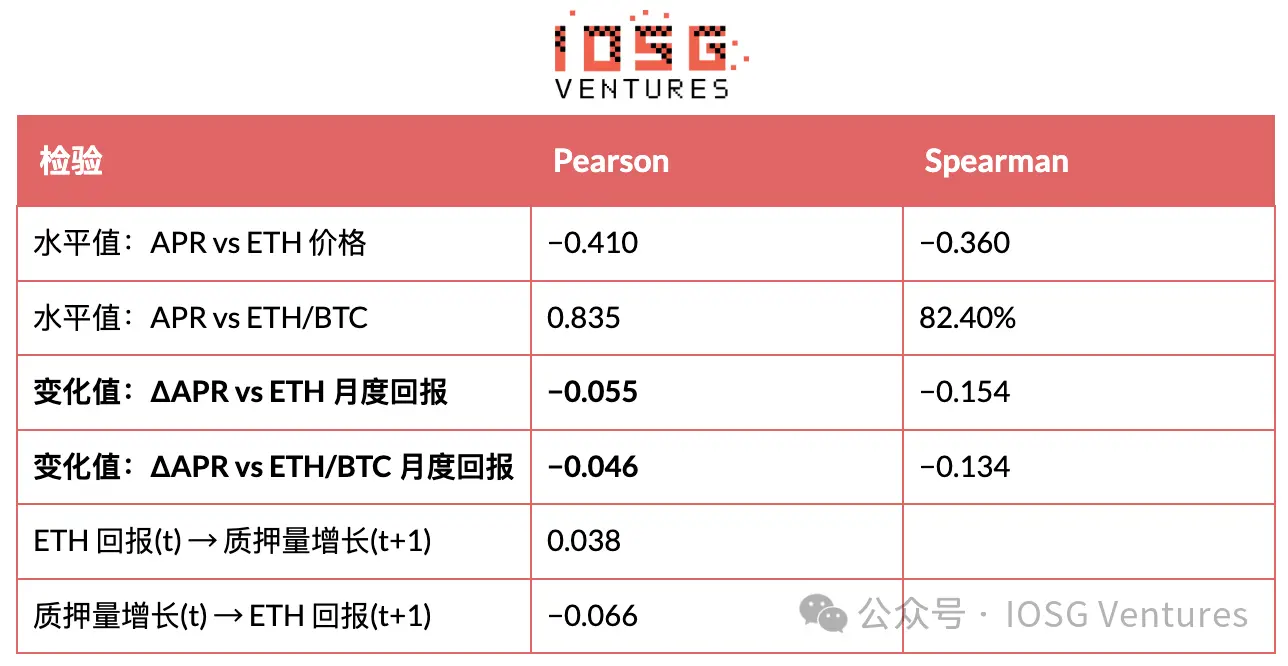
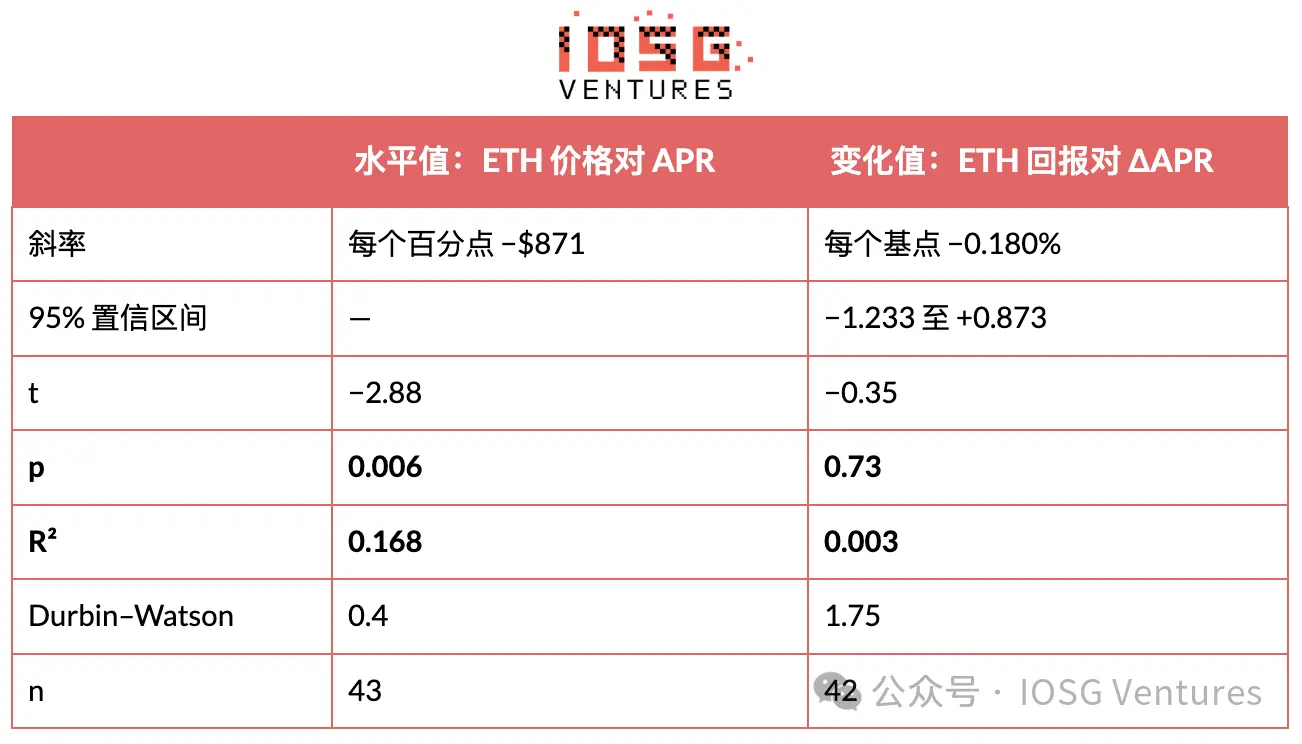
Regression Results
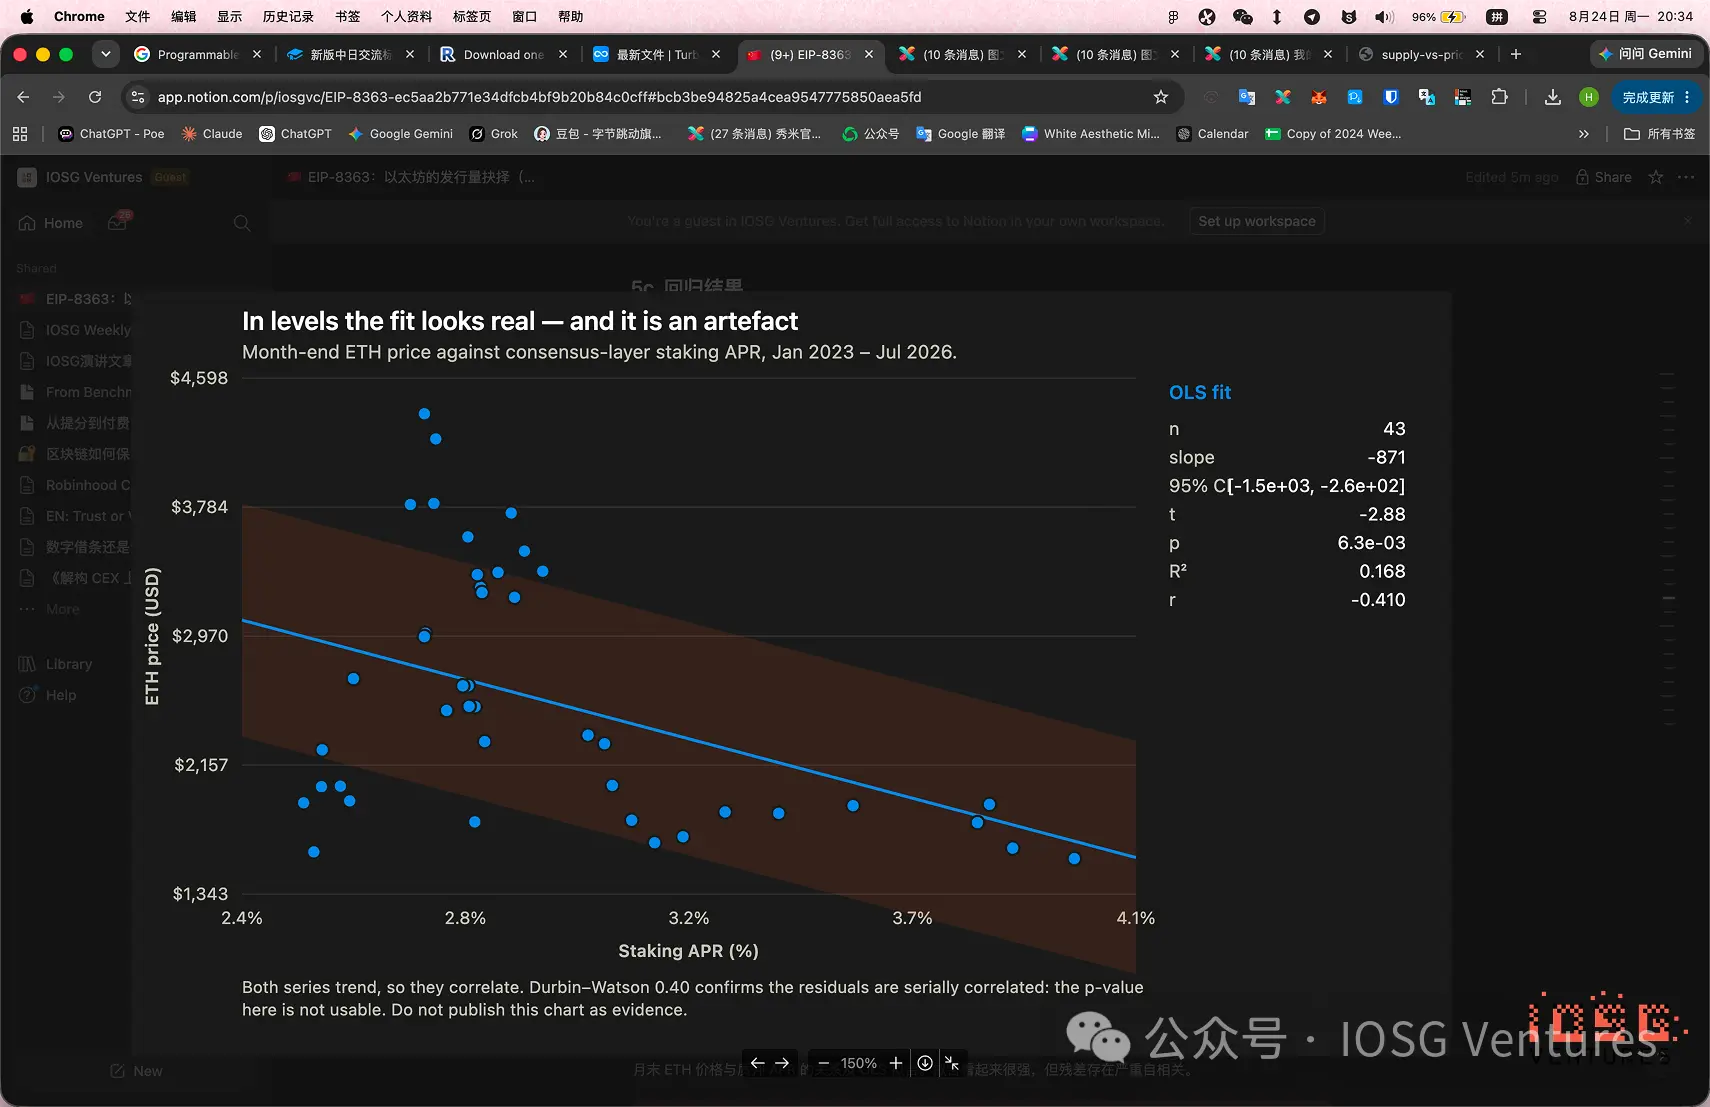
▲ Relationship between end-of-month ETH price and staking APR with OLS fit. Fit appears strong, but residuals exhibit severe autocorrelation.
This level regression is “significant” at p = 0.006—but it is worthless. Durbin–Watson stands at 0.40, indicating severe serial correlation in residuals, a textbook hallmark of spurious regression between trending series. Both variables trend, hence they correlate; standard errors are downward-biased, p-values invalid. The plot is retained as a warning, not evidence.
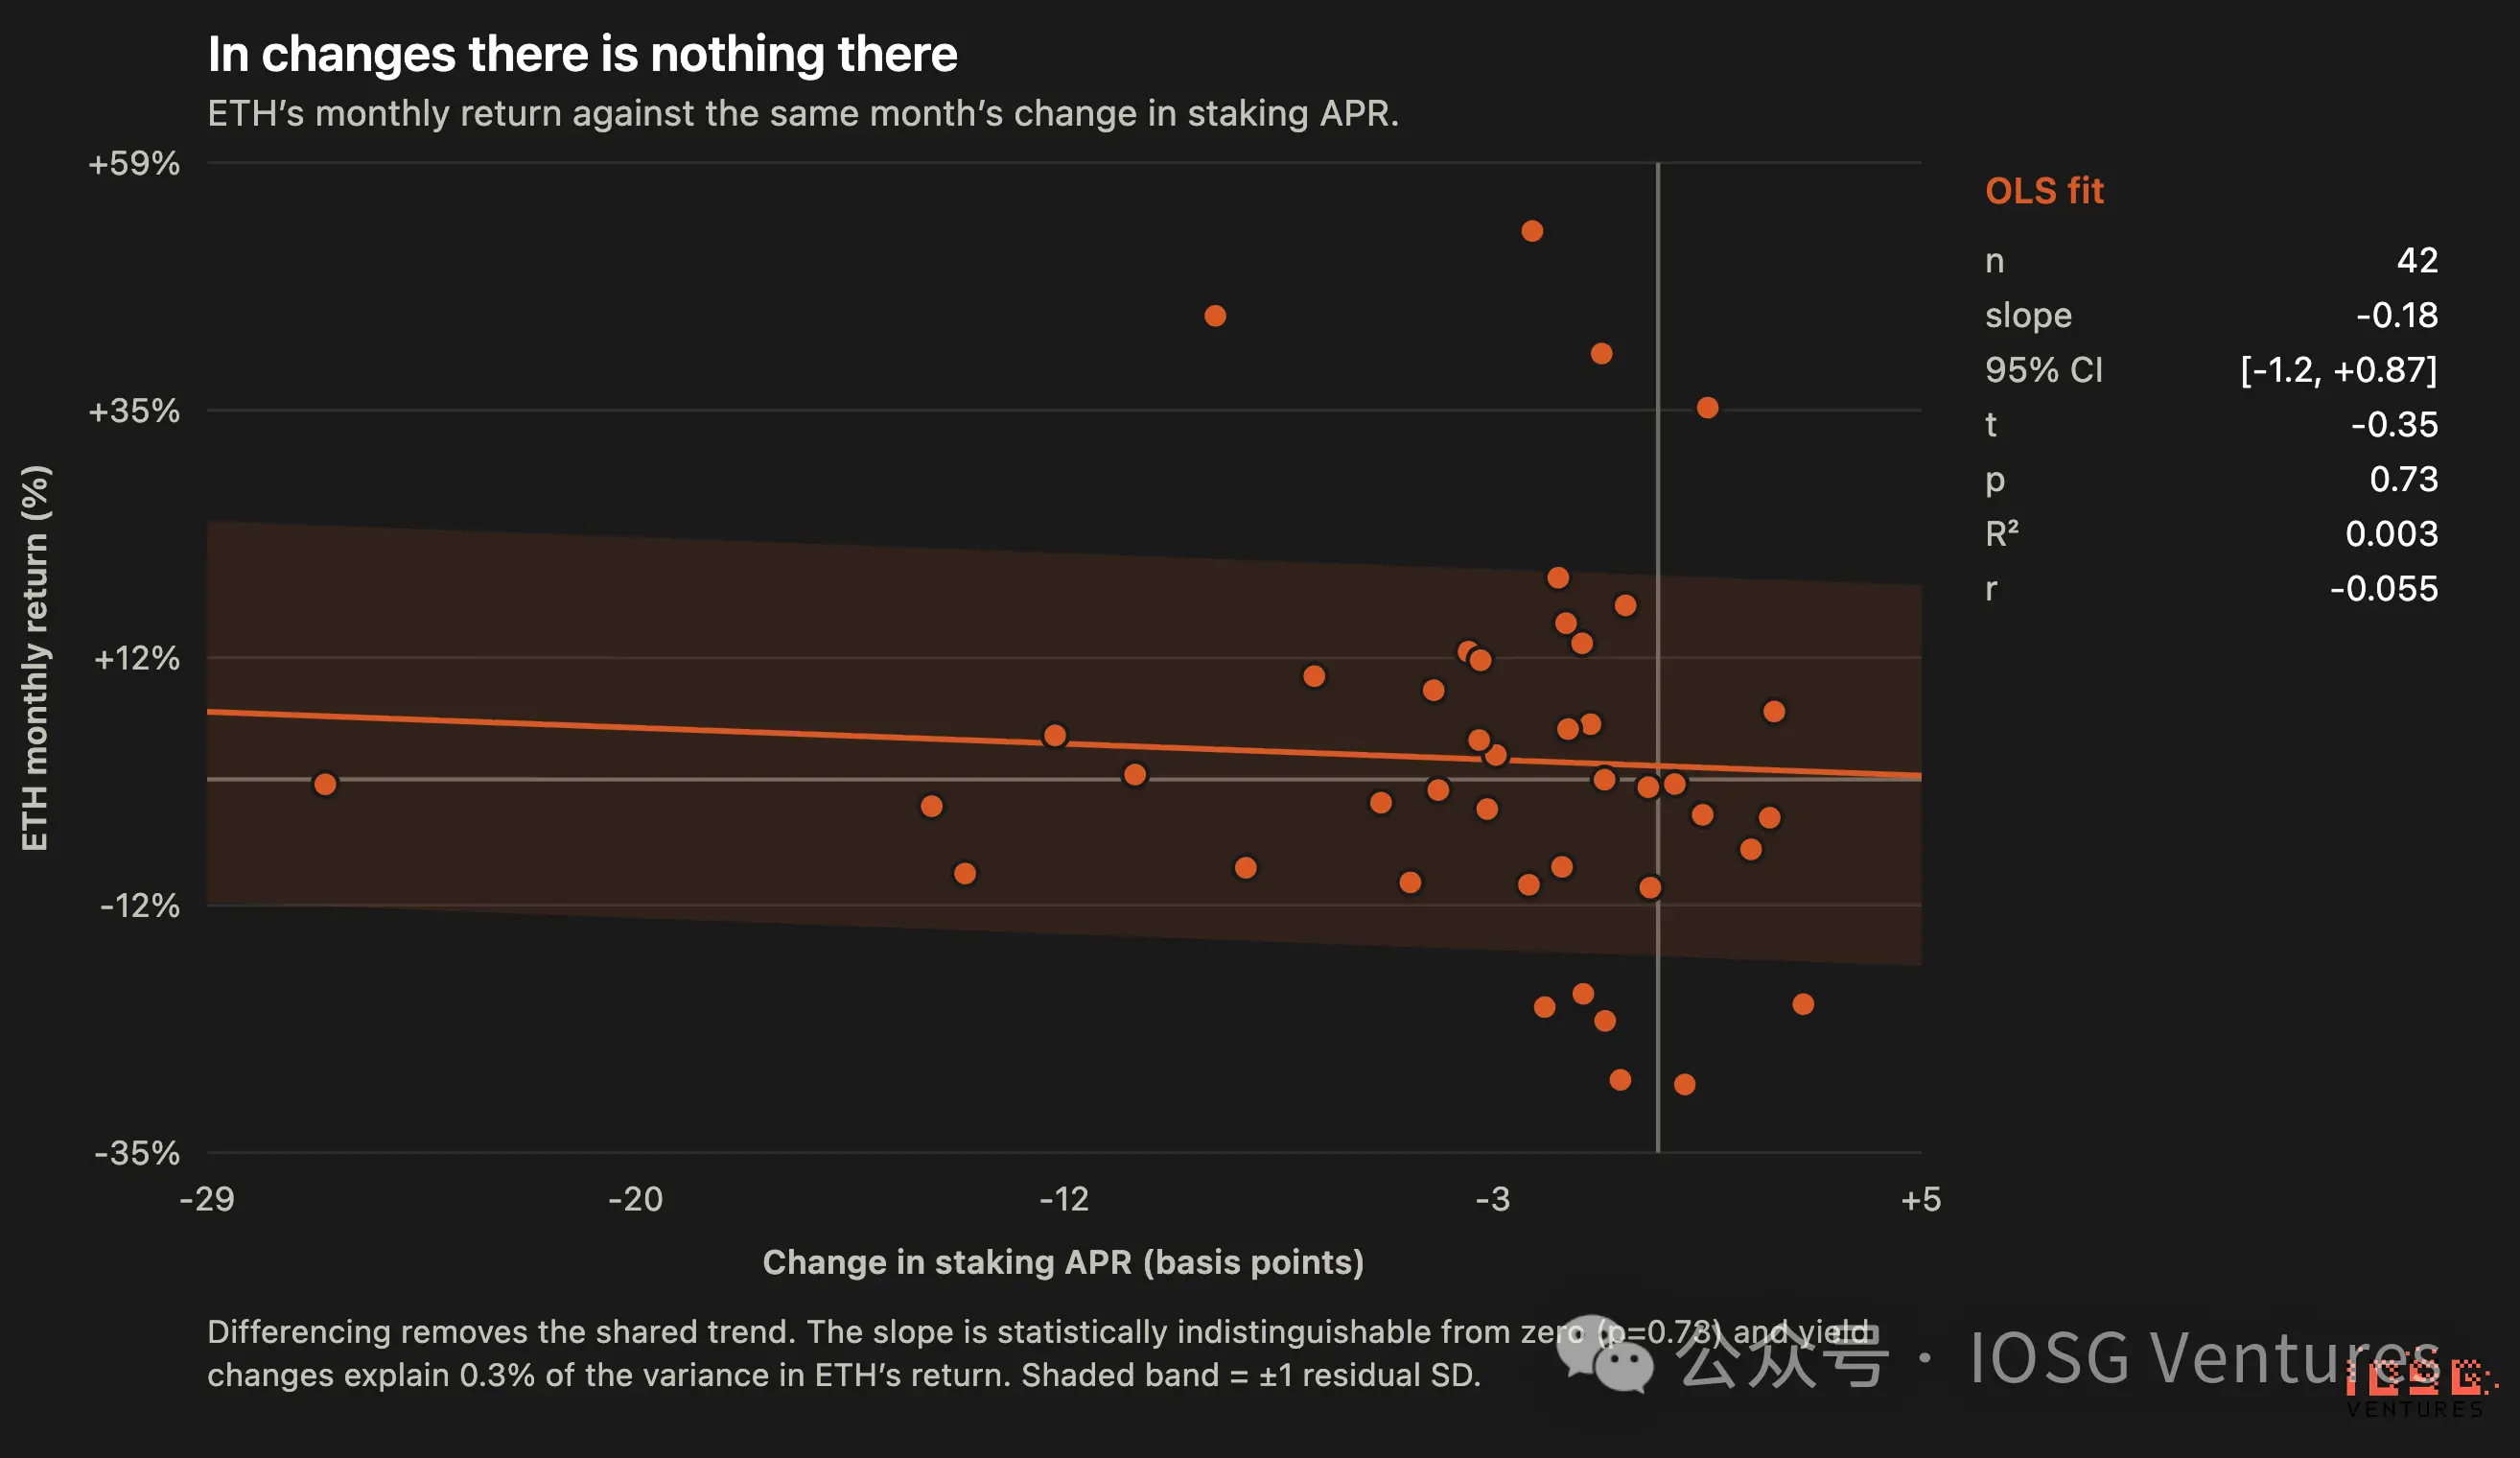
▲ Scatterplot of monthly ETH returns versus concurrent change in staking APR. OLS fit line is near-horizontal, with a wide residual band.
After differencing to remove trends, the relationship vanishes: p = 0.73, R² = 0.003. Durbin–Watson is 1.75, confirming a clean specification. The 95% confidence interval comfortably crosses zero in both directions—the data cannot even determine the sign of the effect, let alone its magnitude.
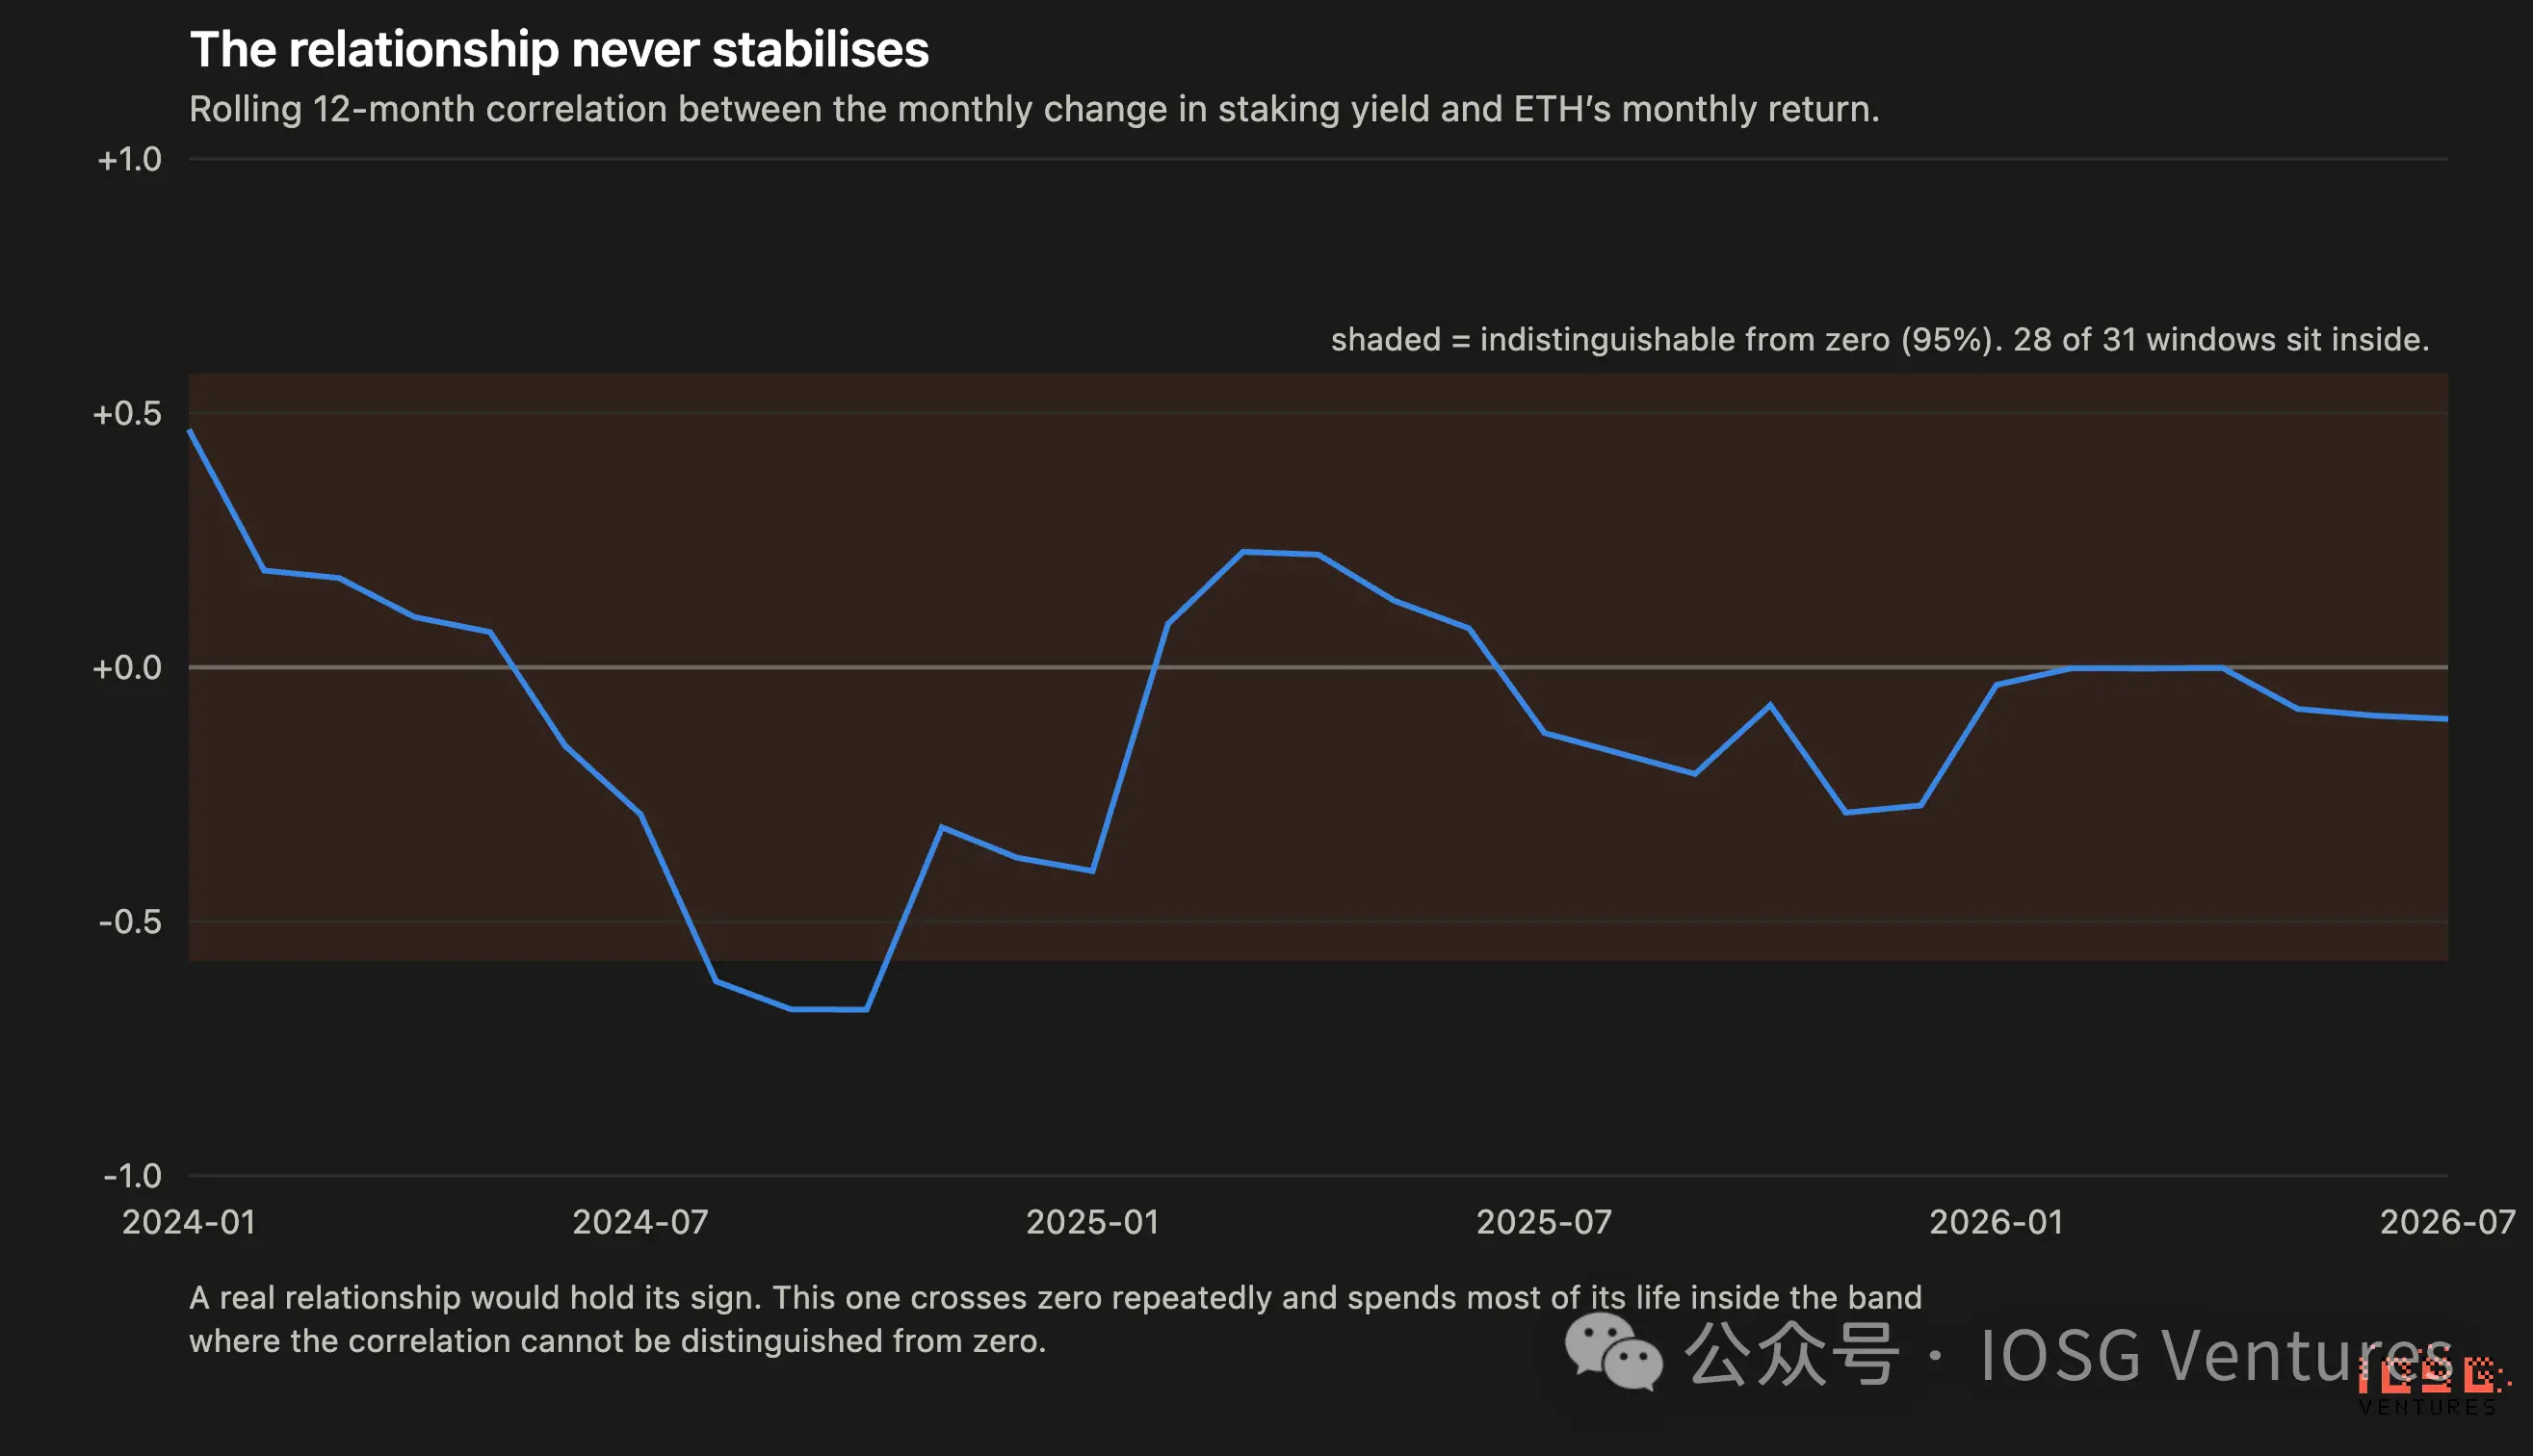
▲ 12-month rolling correlation between staking yield changes and ETH returns oscillating around zero, mostly residing in indistinguishable intervals.
Moreover, this isn’t a stable relationship hiding in a noisy mean—the rolling correlation repeatedly crosses zero, spending the vast majority of time in statistically indistinguishable ranges.
Between January 2023 and July 2026, ETH’s staking yield fell from 3.98% to 2.50%, while ETH/BTC dropped 57%. Over the identical window, the monthly correlation between yield changes and ETH returns was −0.05. Yields were persistently present throughout.
It did not defend prices, nor did its compression cause declines. If the natural 37% yield cut driven by the existing reward curve produced no detectable price impact, the burden of proof falls on anyone claiming “another cut would matter.”
Caveat: The staking series is reconstructed from onchain flow data, running ~5% above published figures. Direction and shape are reliable, but absolute levels are imprecise.
Supply Growth Rates Also Fail to Explain
If yield doesn’t affect price, what about the supply numbers this proposal actually alters? Same test, same window, swapping yield for net supply growth.
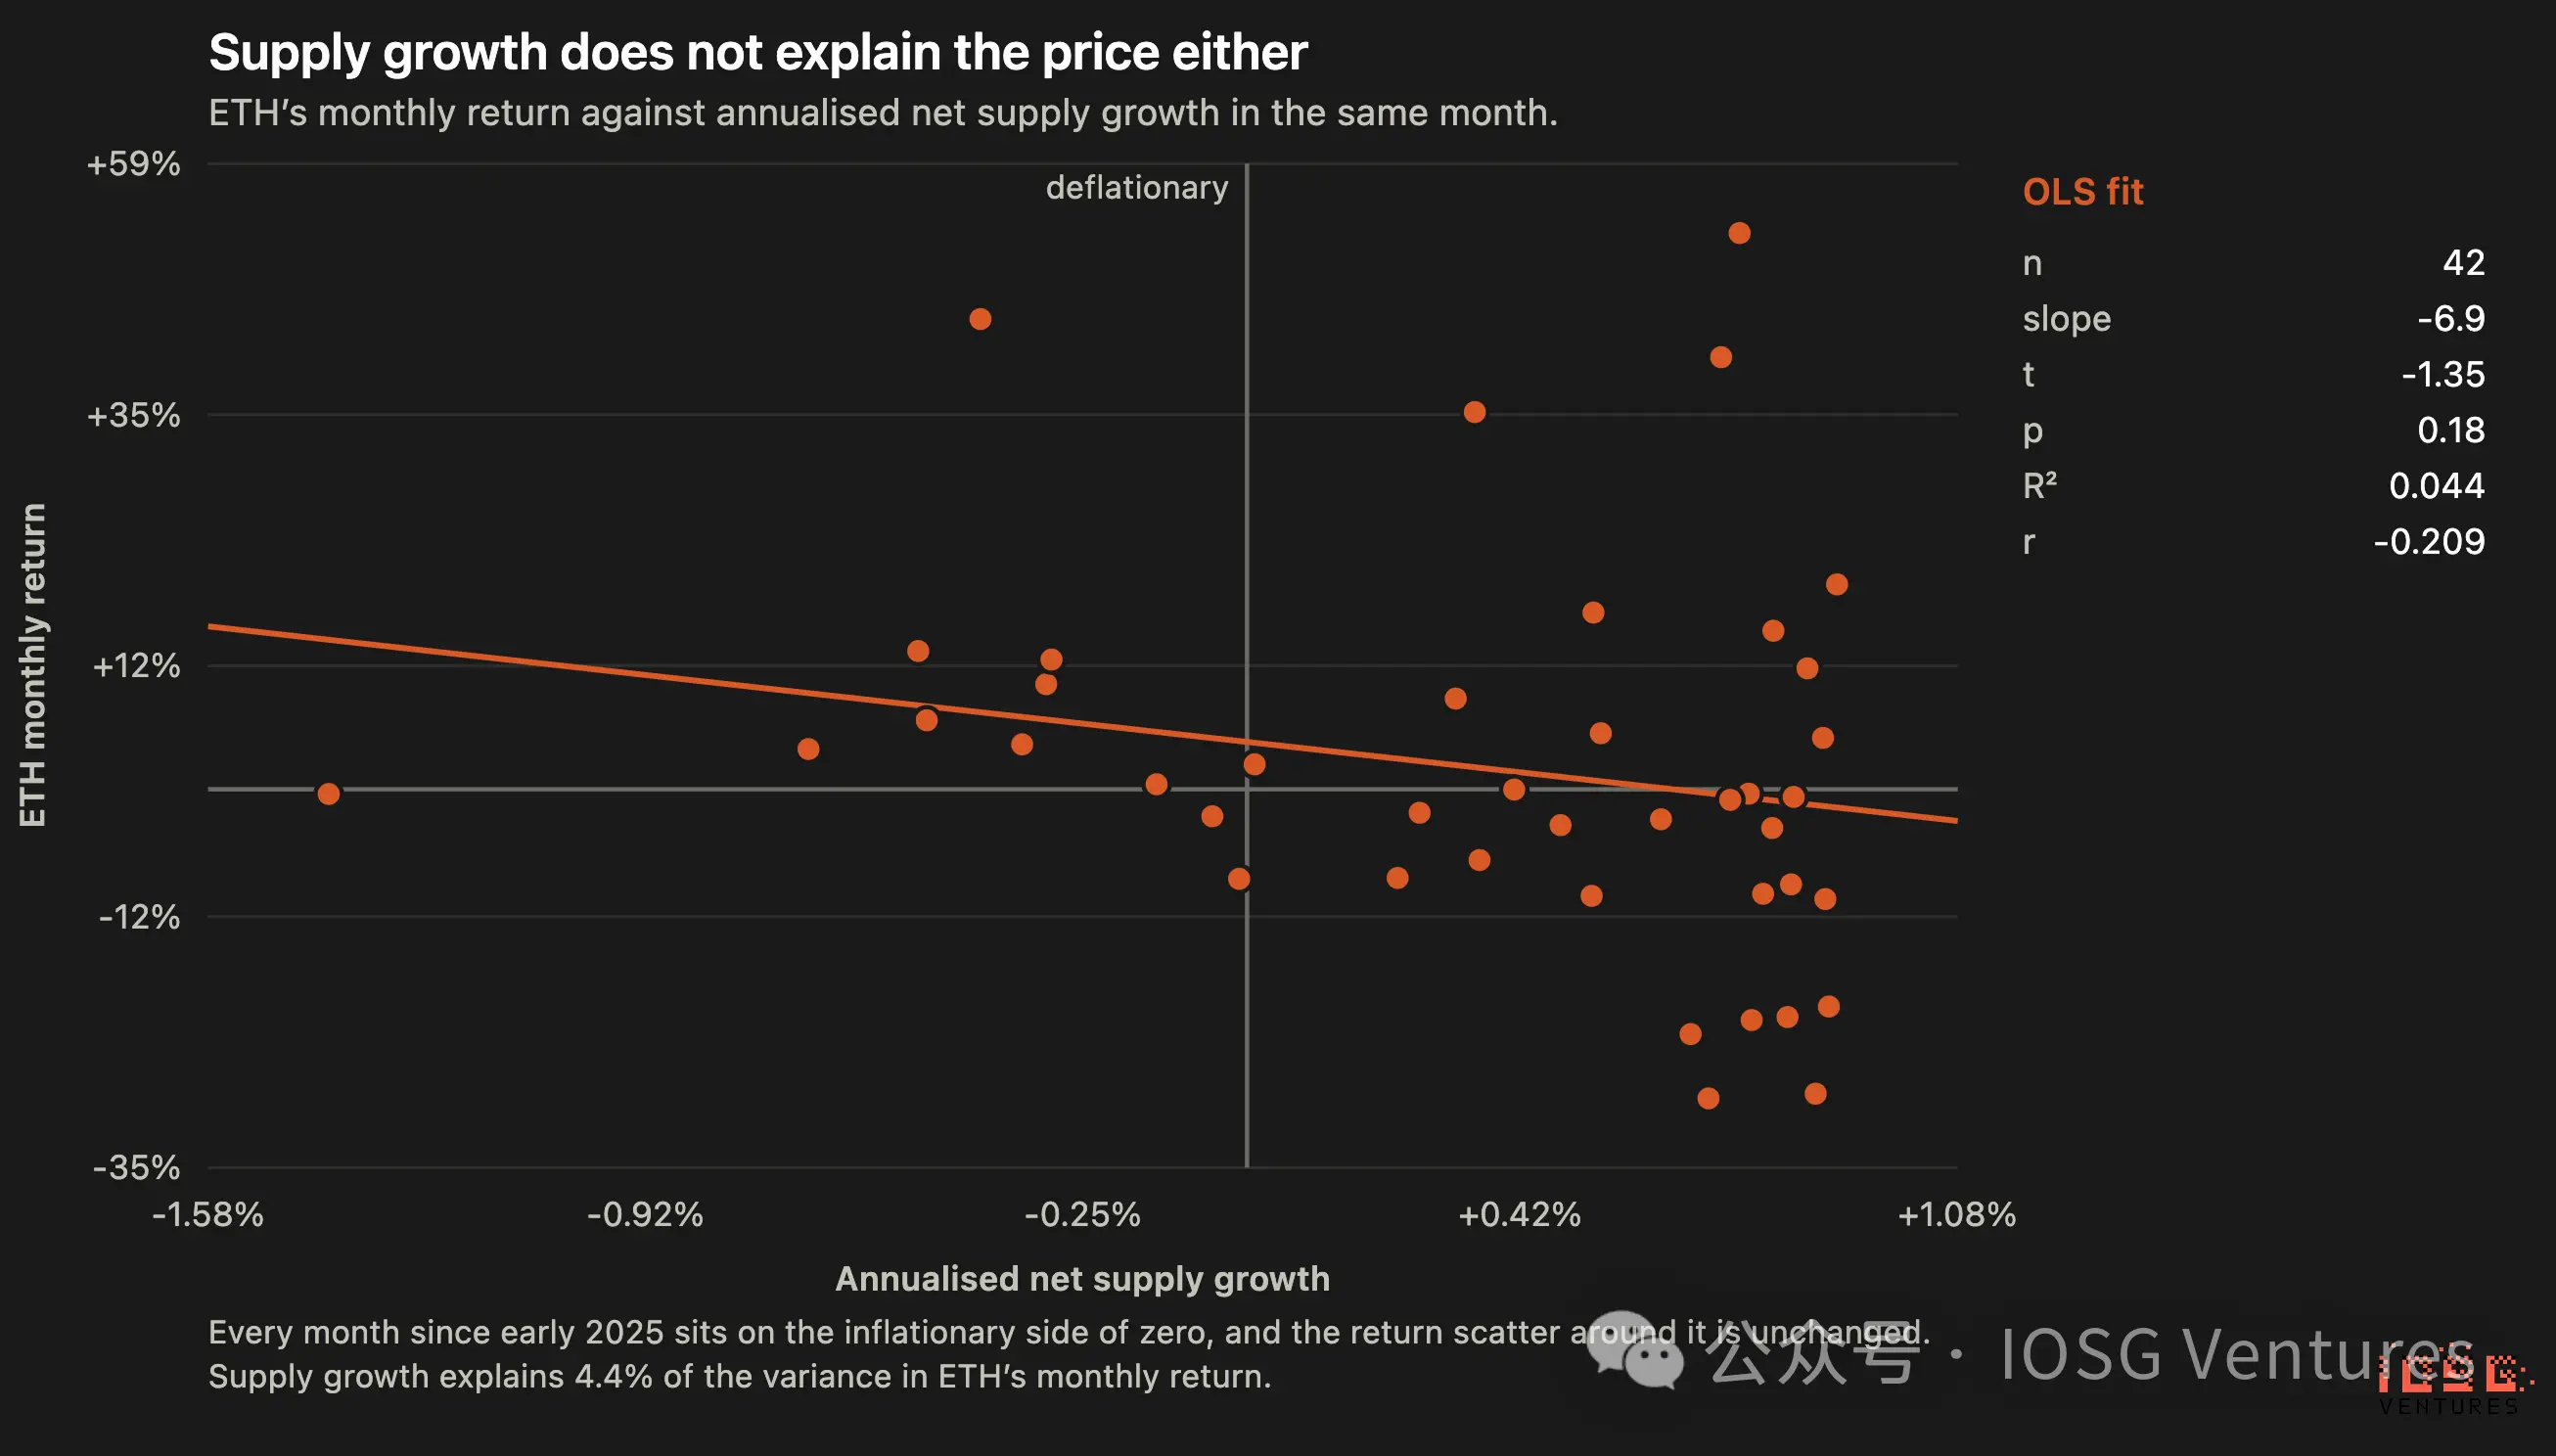
▲ Relationship between monthly ETH returns and annualized net supply growth. Fit slopes downward, but scatter is diffuse; relationship is insignificant.
Slope −6.9 (each 1pp higher annual supply growth corresponds to 6.9pp lower monthly return), p = 0.18, R² = 0.044, Durbin–Watson 1.82. Slope 95% interval spans −17.1 to +3.4.
Read this result honestly, as it cuts both ways. Statistically insignificant, crossing zero, so it cannot serve as evidence that “slowing supply growth pushes prices up.” Yet it’s ~15x stronger than the yield relationship (R² 4.4% vs. 0.3%), and the sign aligns with theoretical predictions. If either variable matters marginally, the data points to supply, not yield—and that is precisely the trade-off EIP-8363 executes.
VI. How Deep Is the Onchain Economy’s Dependence on ETH Yields?
Liquid Staking
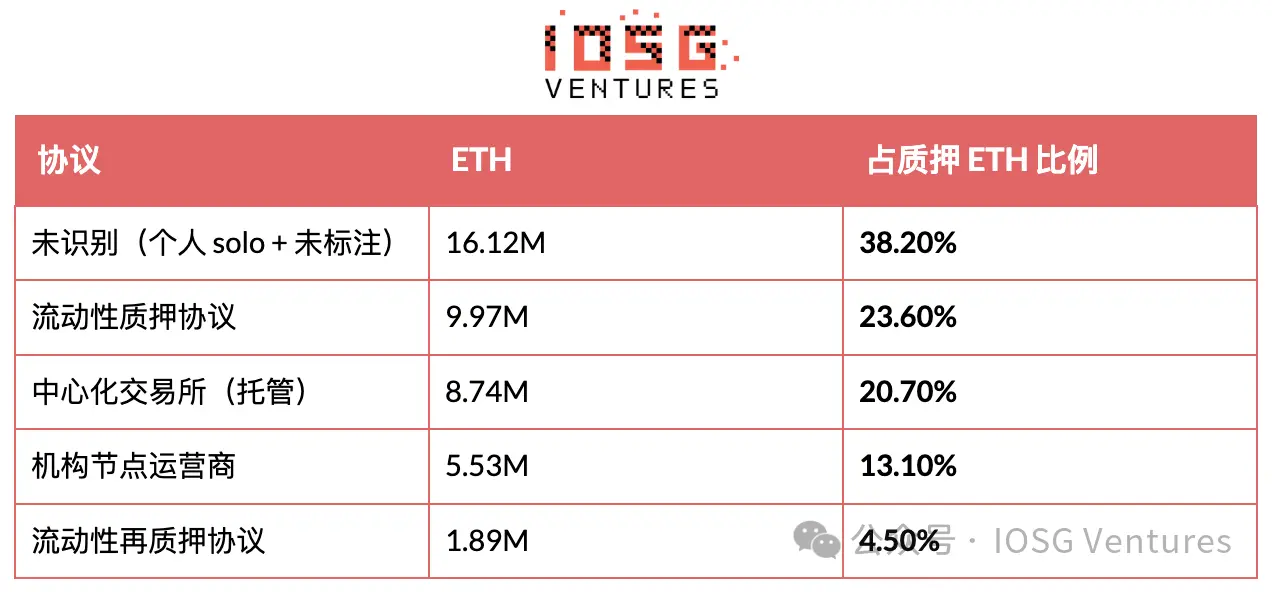
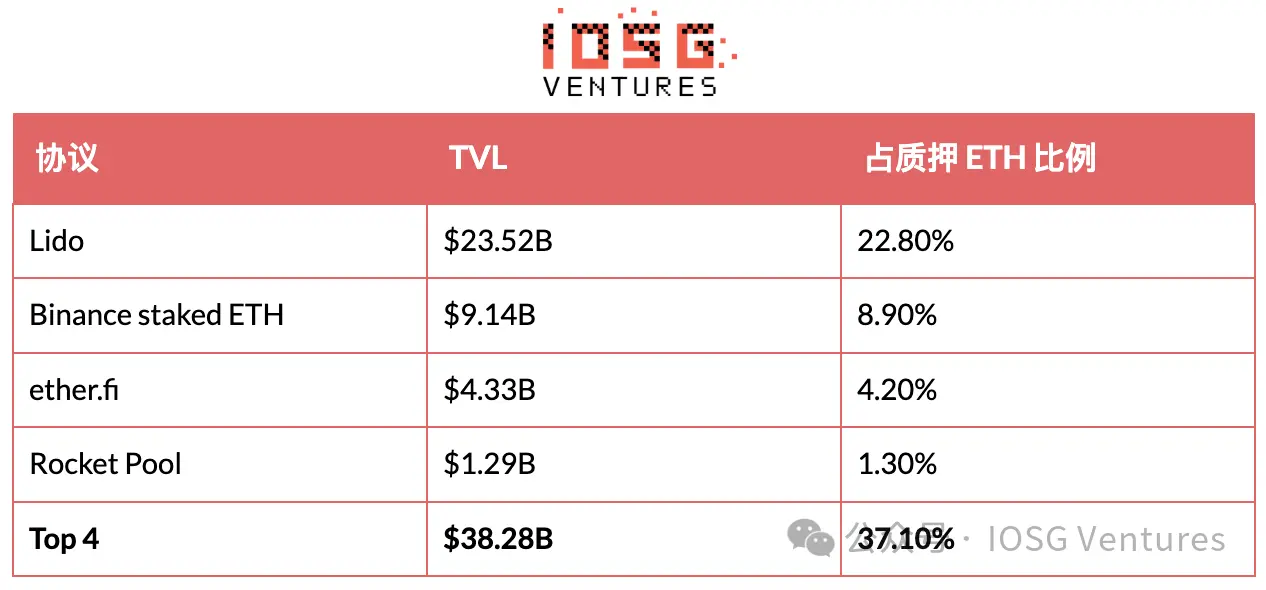
Lido alone accounts for 48% of Ethereum’s total $48.5B DeFi TVL. Any claim that “DeFi will be fine” must first withstand this number.
What Does Yield Cuts Mean for Each Specifically?
Liquid Staking: Revenue Hit. Lido processes ~$602M in staking rewards annually, taking a 10% fee (~$60M/year). Cutting issuance by 58.6% reduces new rewards by 633k ETH annually; factoring in Lido’s 22.8% share, it misses out on ~$35M in fees yearly—roughly half this revenue stream. Material for Lido, but negligible for Ethereum holistically. Moreover, regardless of yield fluctuations, wstETH continues to dominate WETH for any borrower seeking ETH exposure, preserving its collateral role.
LST as Lending Collateral—The True Dependency
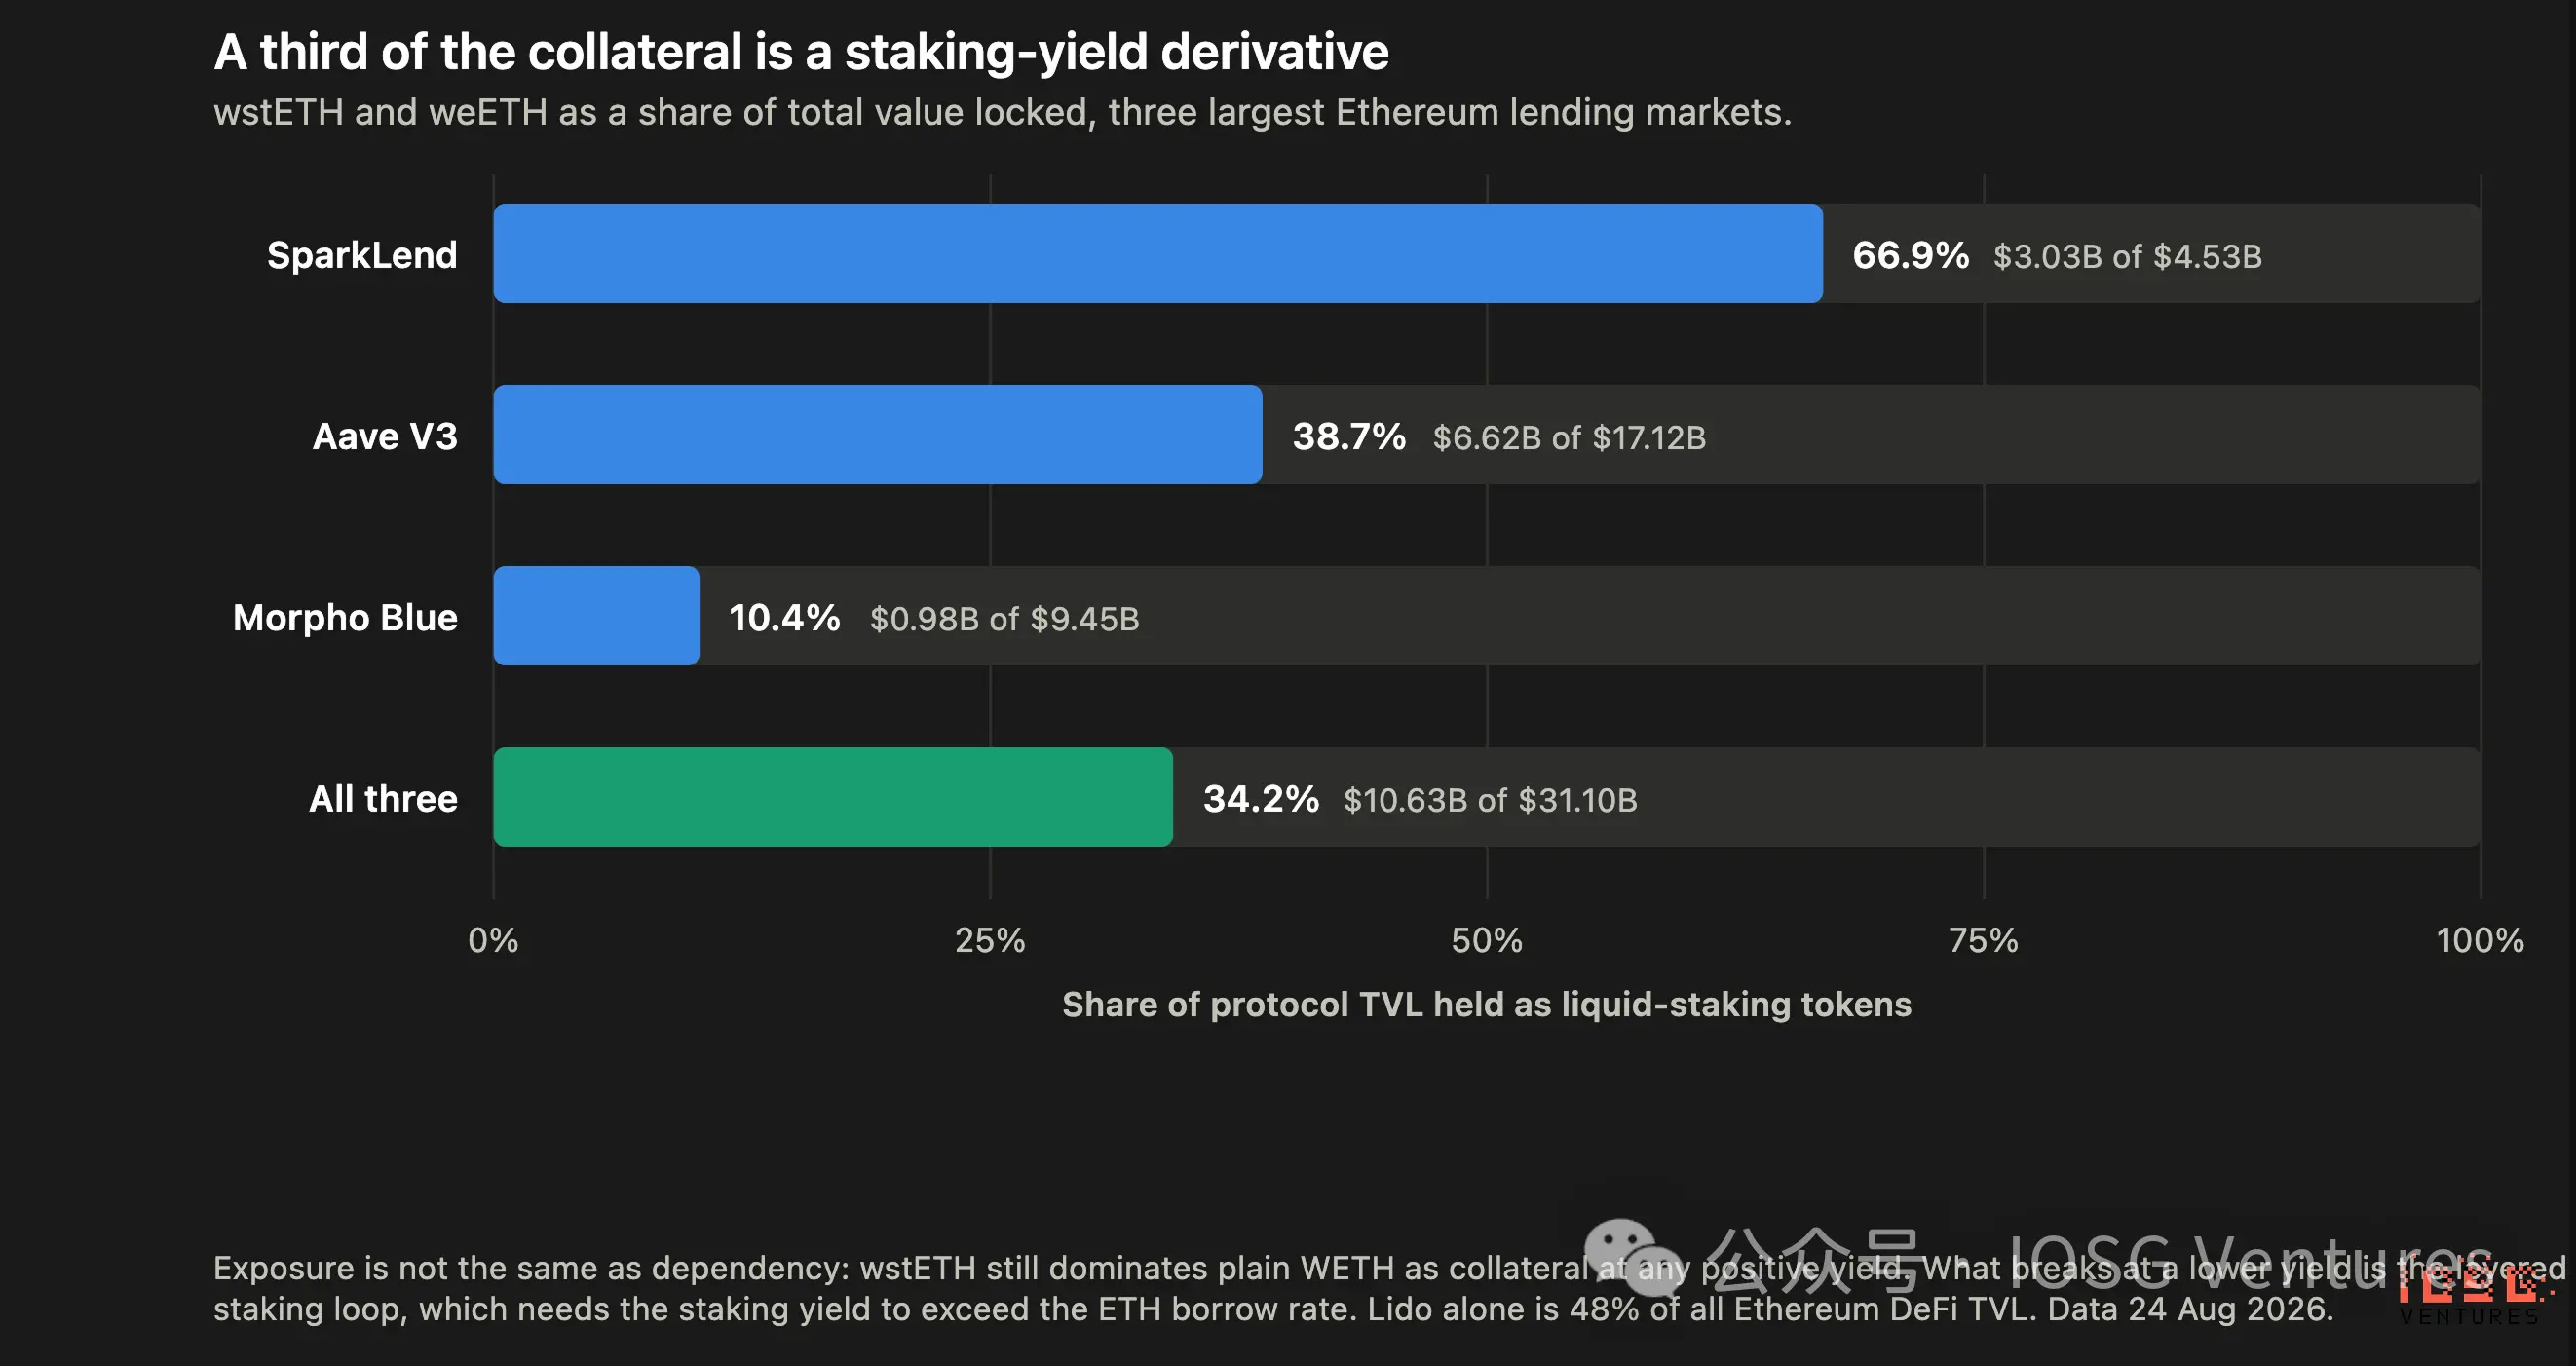
▲ Proportion of liquid staking tokens in TVL: SparkLend 66.9%, Aave V3 38.7%, Morpho Blue 10.4%, totaling 34.2% across the three.
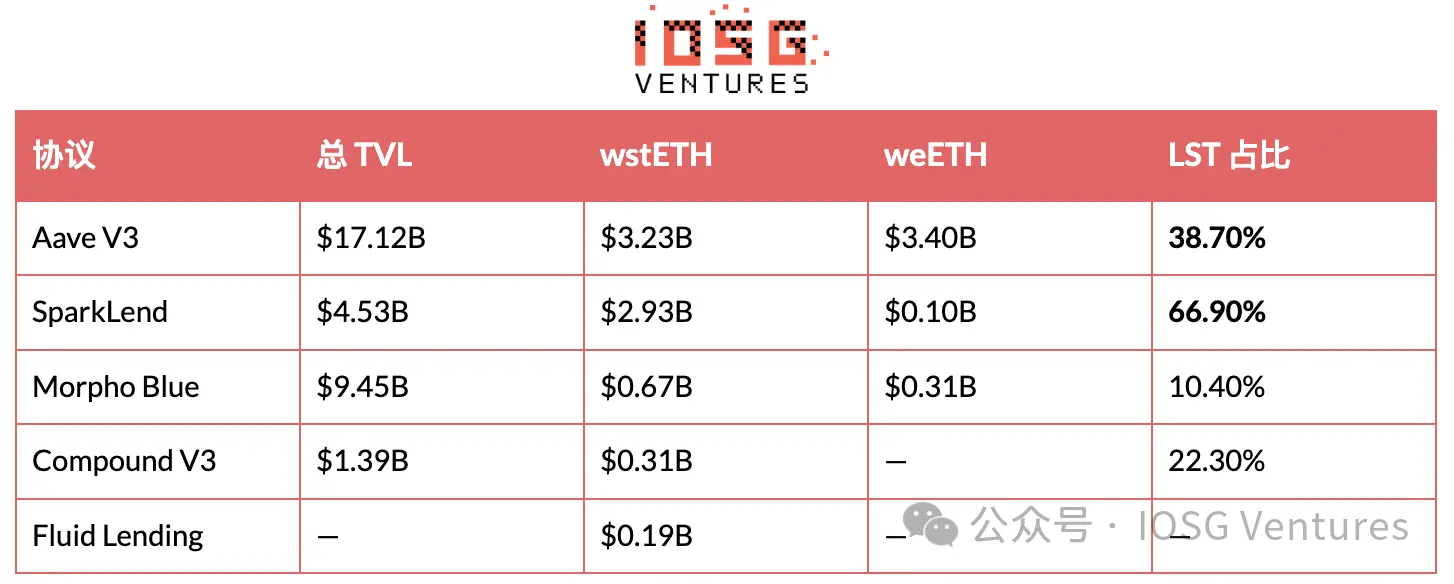
Across Ethereum’s top three lending markets, $311.0B in collateral includes $106.3B (34.2%) derived from staking yield instruments. SparkLend exemplifies a single point of failure: two-thirds consists of wstETH.
ETF Channel, Quantified
The most frequently cited objection is that cutting yields drains institutional bid, as liquid-staking ETH ETFs market yields to allocators unable to access them directly. This channel is real. It is also tiny today.
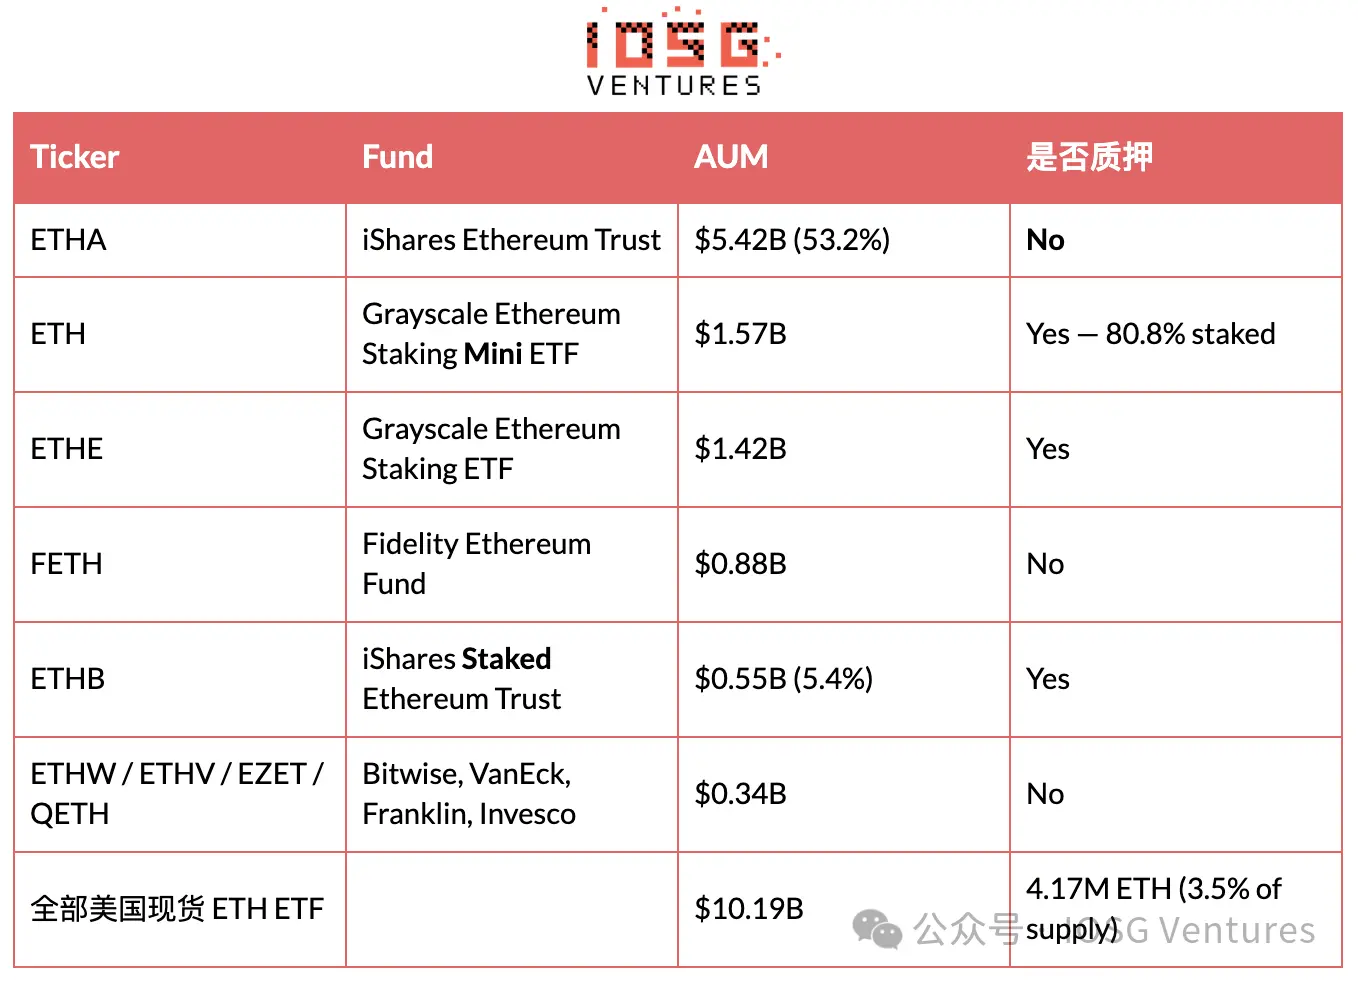
Products explicitly marketing yield account for only 5.4% of ETF assets, 0.53% of total staked ETH, and 0.19% of total ETH supply. BlackRock’s non-staking ETH product is ten times its size. Whatever channels institutional capital into ETH, staking yield isn’t the primary pitch—allocators overwhelmingly purchase non-staking exposure.
Two factors prevent this conclusion from being set in stone. First, the liquid-staking ETF category remains young and growing: Bitwise and Grayscale already offer staking ETFs for Solana, and Grayscale launched one for Hyperliquid, meaning future risk outweighs current AUM. Second, lower yields will likely slow the conversion rate of existing non-staking ETF assets into staking tranches, impacting growth velocity rather than triggering capital flight. Neither changes the order of magnitude: fundamentally, this is a $0.5B cohort fiercely debating a $1.55B/year redistribution.
VII. Conclusion & Assessment: When “Security Anxiety” Meets “Wealth Redistribution”
Strip away the grand security narrative first.
We must acknowledge that the core authors of EIP-8363 (e.g., Justin Drake, Jerome) harbored extremely serious network security intentions. From a game-theoretic perspective, once the network-wide staking rate breaches the 50% life-or-death threshold, Ethereum loses its “Social Layer Defense” against extreme attacks and faces systemic parasitic risks from too-big-to-fail LST oligopolies. Hence, the proposal attempts to forcibly cap staking rates within safe zones using mandated economic interest rate cuts.
Yet behind security philosophy lies a colder onchain reality.
Since 2022, Ethereum’s “Burn” mechanism has effectively ceased functioning: burn volume plummeted 98%, currently offsetting a mere 2.4% of new issuance. Regardless of one’s stance on EIP-8363’s security motives, an unavoidable truth remains: the past mechanism that “dynamically adjusted ETH supply according to market demand” has ground to a halt. Under today’s Blob-dominated L2 economics, relying on an L1 fee explosion to resurrect burns is fantasy. Ethereum’s monetary policy has entered an “autopilot without steering wheel” phase, and adjusting issuance is our only remaining trigger to pull.
Setting aside emotion, the true policy impact lies between both extremes.’
Supporters chant “End ETH Inflation”; opponents warn “Staking System Collapse.” Both rhetorical flourishes deviate from mathematical facts. At the current 42.2 million ETH staked, this proposal merely slashes issuance by ~58.6% and drops staking APR by ~56%. Want total zero issuance? That requires staking surging to 60.25 million ETH (43% higher). More critically, the mechanism contains its own brakes: as yields compress, some validators exit, and the system ultimately stabilizes around “26% staking rate, 0.48% annual inflation.” Its actual delivery simply halves dilution, rather than destroying or upending anything.
Does saving this “half a percentage point” truly matter? Numbers speak more honestly than words.
Valued at current prices, cutting 633k ETH in annual issuance preserves $1.55 billion, roughly 0.53% of total market cap. Don’t dismiss this proportion; it’s ~5x larger than Ethereum’s entire current L1 fee economy (~0.10%/year). For an asset whose fee revenue has dried up, plugging a 0.5% annual structural hemorrhage is hardly a “rounding error”—it’s the largest economic lever currently at our disposal.
And the cost? Will DeFi really collapse? The risk genuinely exists.
Opponents frequently cite collateral, noting two-thirds of SparkLend is wstETH. But we must distinguish “exposure” from “dependency”: as long as wstETH yields positively, it remains superior to plain WETH as collateral, keeping this foundation solid. What EIP-8363 truly shatters is the “leveraged staking loop.” When base staking yield drops below 1.16%, failing to cover borrowed ETH interest costs, capital reliant on leverage arbitrage unravels. In short, the leverage bubble shrinks, not the collateral system itself. Regarding direct protocol losses, Lido faces ~$35M annually—roughly half its fee revenue.
Concerns regarding “yield cuts crashing prices” were actually settled by the market long ago.
Over the past 43 months of data, no significant correlation exists between staking yield fluctuations and ETH price performance (p = 0.73, R² = 0.003). Staking yields dropped from 3.98% to 2.50%, failing to prevent the 57% plunge in ETH/BTC by July 2026. Yields are neither a price moat, nor did their compression ignite sell-offs. If a previous 37% yield decline failed to dent prices, those claiming “one more cut crashes Ethereum” need harder evidence.
Why Is This Debate So vicious?
Because it is a zero-sum game where “losses are highly concentrated, while gains are extremely dispersed.”
Stripping away opaque jargon and grand security rhetoric, EIP-8363 is essentially a blunt wealth redistribution: Currently, stakers capture 100% of new issuances yet hold only 35% of network tokens. This means they externalize inflation costs onto the remaining 65%. Cutting this $1.55B issuance effectively forces a $1B implicit annual wealth transfer from stakers (intermediaries) back to all non-staking ETH holders.
This is the true reason parties are fighting tooth and nail:
- Loss-bearing side is hyper-concentrated: Lido, LST issuers, restaking protocols, leveraged players. This is a small-number, well-capitalized, highly organized interest bloc. They know exactly how much hard cash this proposal rips from their pockets (Lido loses half profits outright, leverage loops die completely).
- Benefit-bearing side is hyper-diluted: Ordinary holders comprising 65% of supply. They avoid 0.5% annual dilution, but spread across a ~$3T market cap, it vanishes silently. Nobody marches in the streets for this.
This explains why contemporary debates brim with hollow slogans. When an interest group cannot openly state “this steals $1B of our annual profit,” they brandish the shield “this destroys DeFi”; when researchers attempt forcibly reclaiming monetary emission faucets, the most politically correct weapon becomes “securing network safety.” Interpret opposition/support volume as interest distribution concentration, not mathematical correctness of the proposal.
Our Final Assessment
Strategy: Mildly bullish on native ETH, explicitly bearish on staking intermediaries/infrastructure. The proposal will likely be rejected.
- At the asset level, our bullishness stems not from “scarcity mythology” but common sense: When the sole supply-adjusting lever breaks, removing a $1.5B annual structural sell pressure (paid to those who never truly funded the yield) is a highly efficient trade. It may not be a paradigm-shifting reversal, but compounding effects are formidable.
- At the intermediary architecture level, the logic is airtight. Core valuation premises for Lido, LSTs, and LRTs entirely rest on that staking yield slated for halving. This isn’t emotional panic; it’s a concrete 58.6% profit margin contraction.
- As for the proposal’s fate? Passage probability is slim. In decentralized governance, “concentrated losses vs. dispersed gains” is the standard script that kills viable proposals. Economically sound, politically paralyzed—that is our baseline expectation.
Conditions Triggering Viewpoint Shift (Falsification Metrics):
- Onchain data proves “issuance is reinvested, not dumped”: If fund flows show newly minted ETH remains globally locked within auto-compounding LSTs rather than flowing to exchanges for selling, our sell-pressure hypothesis fails.
- Liquid-staking ETFs drive massive bids: The current $500M footprint is trivial. Expand tenfold, and marginal demand power could eclipse inflation-cutting significance.
- L1 Fee Miracle Recovery: If burns regain fundamental dominance, the urgency for artificial issuance intervention vanishes.
- Negative Correlation Between Supply & Price Thoroughly Validated: Current linkage is minimal. If next year’s data confirms “supply contraction inevitably lifts prices,” it becomes the bulletproof quantitative pillar for holding ETH.
Join TechFlow official community to stay tuned
Telegram:https://t.me/TechFlowDaily
X (Twitter):https://x.com/TechFlowPost
X (Twitter) EN:https://x.com/BlockFlow_News
 IOSG Ventures