These charts reveal why BTC could rebound to $100,000 before October.
TechFlow Selected TechFlow Selected
These charts reveal why BTC could rebound to $100,000 before October.
Bitcoin is emerging from a potential double-bottom pattern with bullish divergence.
 Navigating Web3 tides with focused insights
Author: Cointelegraph
Translation & Editing: TechFlow
TechFlow Summary: Bitcoin rebounded 13% from below $60,000, returning to the $67,000 level. Multiple technical patterns simultaneously point toward a recovery rally targeting $100,000: a double bottom on the three-day chart and bullish divergence on the weekly RSI. However, a short-term risk remains—the bearish flag pattern (a continuation pattern) has yet to break out, and whale inflows into exchanges have nearly tripled. This article dissects the key price levels supporting this bullish scenario—and identifies which signal, if breached, would invalidate the entire narrative.
Bitcoin’s technical chart is flashing a signal: BTC reaching $100,000 could happen before September.
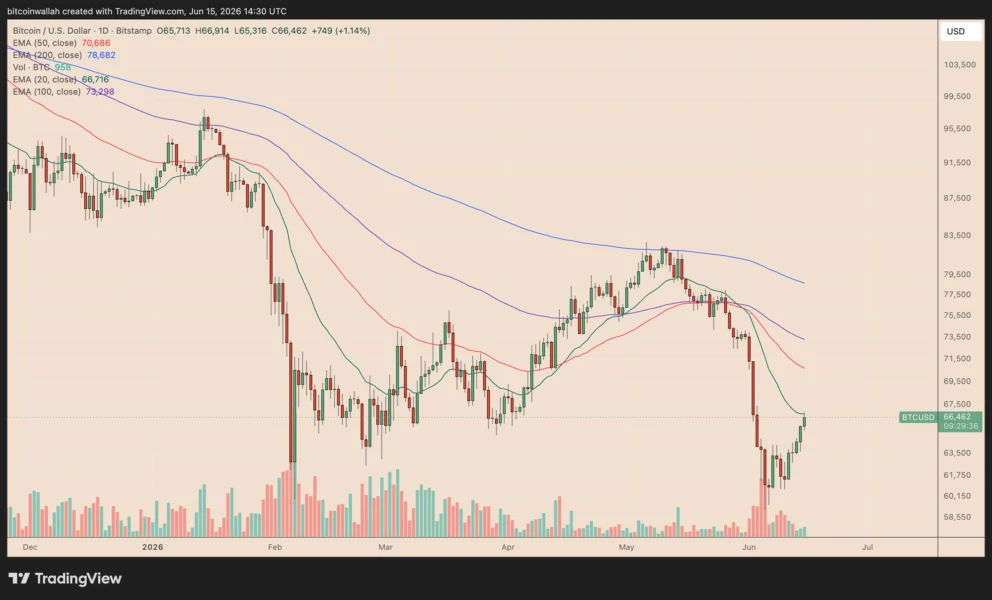
Chart caption: BTCUSD daily chart. Source: TradingView
Key Takeaways:
- Bitcoin is forming a potential double bottom combined with bullish divergence.
- BTC must break above the dense resistance zone near $66,700.
Double Bottom Suggests 60% Upside Potential
BTC rebounded 13.25% from its recent local low below $60,000. The catalyst was the preliminary ceasefire agreement between the U.S. and Iran, reigniting global risk appetite.
This recovery pushed BTC back to around $67,000 on June 15—a broader relief across risk assets driven by easing geopolitical tensions, lower oil prices, and reduced near-term inflation concerns.
Now, on the three-day chart, Bitcoin has formed a potential double bottom reversal near the $60,000 support zone.
This marks the second time in 2026 that BTC has bounced from the $60,000 area. That same demand zone held firm during previous pullbacks, and repeated buying interest at this level strengthens the double-bottom thesis.
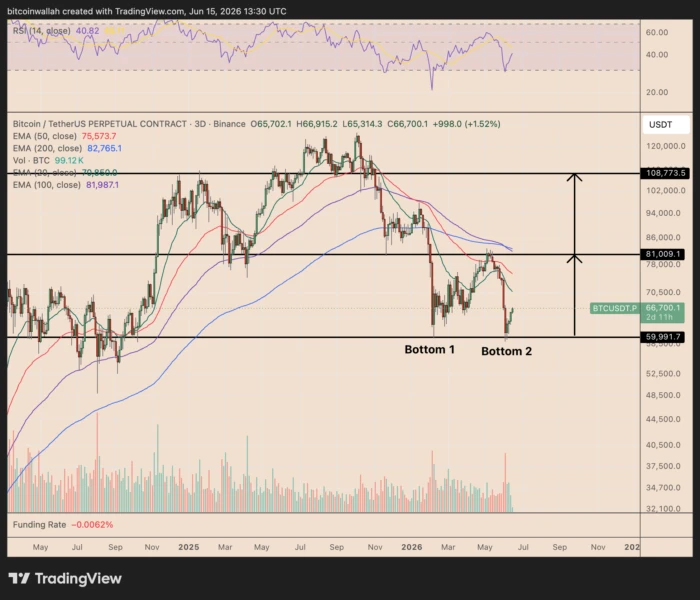
Chart caption: BTCUSDT three-day chart
The first bottom formed near the March low; the most recent bottom emerged following a sharp June decline that briefly drove Bitcoin back to the same level. As long as BTC holds above $60,000, the double-bottom structure remains intact.
The neckline of this pattern sits near $81,000—the level where BTC previously stalled before initiating its latest downtrend.
A high-volume close above this level would confirm the double bottom, unlocking a measured move toward $108,000—potentially materializing in August or September, representing over 60% upside from current levels.
Bullish Weekly RSI Divergence Reinforces $100,000 Scenario
A bullish divergence has emerged between price and the Relative Strength Index (RSI)—a momentum indicator—on Bitcoin’s weekly chart.
Recently, BTC formed a lower low within the $60,000–$65,000 support zone, while its weekly RSI registered a higher low. This suggests sellers are exerting diminishing downward pressure.
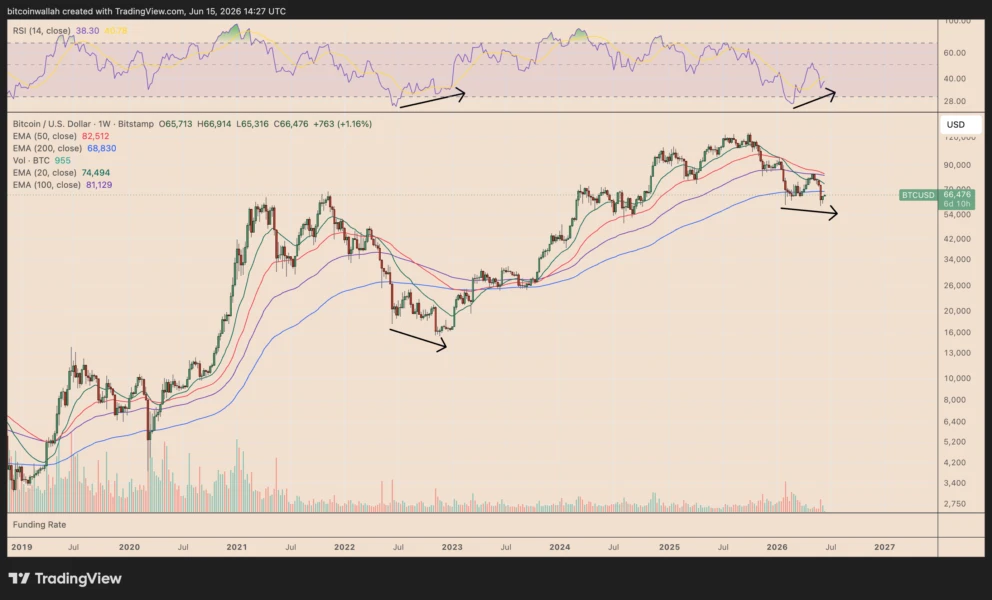
Chart caption: BTCUSD weekly chart
A similar divergence appeared near the 2022 bear market bottom—where RSI recovered first, followed by price, triggering a multi-month rally.
Analyst Jelle noted in a Monday post that Bitcoin’s trajectory over the coming months may “closely resemble late 2022.”
This setup further bolsters the double-bottom logic near $60,000. Still, BTC requires confirmation signals: initial major resistances lie near the 20-week EMA at $74,500 and the 50-week EMA at $82,500.
A sustained close above both levels would significantly increase the odds of a summer recovery rally reaching $100,000. Conversely, a weekly close below $60,000 would weaken the bullish structure.
Bitcoin’s Bearish Flag Remains a Key Risk
The short-term chart still leaves room for another downside leg before the broader bullish reversal pattern confirms.
BTC is currently testing a dense resistance zone formed by the upper trendline of a bearish flag and the 20-day EMA (green line), located near $66,700.
If rejected here, price could retrace toward the flag’s lower boundary at $63,600—keeping Bitcoin trapped within this bearish continuation pattern.
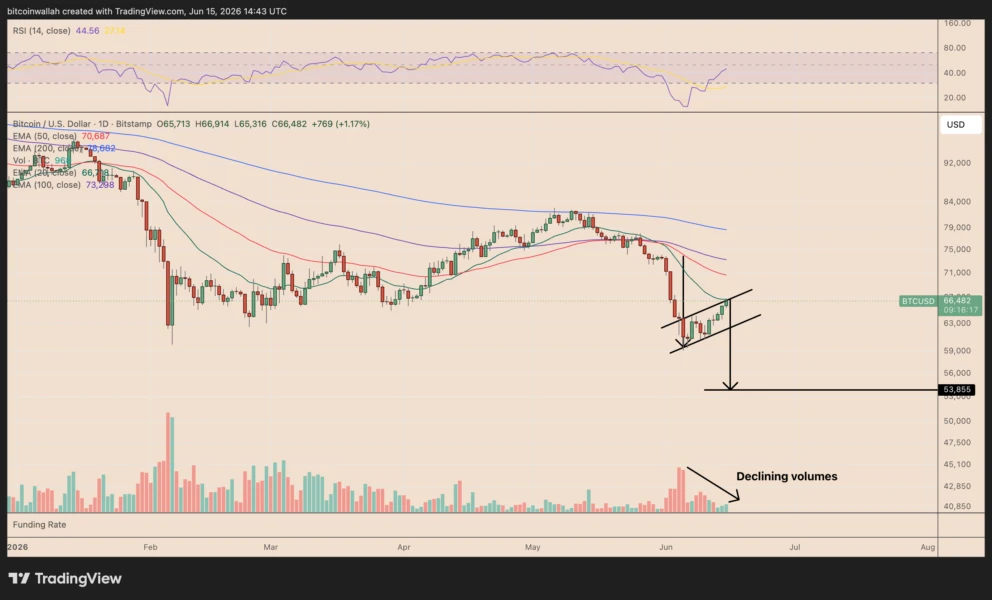
Chart caption: BTCUSD daily chart
A high-volume daily close below the lower trendline would confirm bearish flag breakdown. Measuring from the prior decline’s height, the projected downside target stands at $53,850—roughly 20% below current levels.
Declining volume throughout the flag formation increases the likelihood of this outcome. Low participation often signals the current rally is merely corrective—not the start of a new bull phase.
Whale Inflows Intensify Downside Pressure
The short-term bearish structure aligns with noticeably increased selling activity by large holders.
CryptoQuant analyst Darkfrost observed a sharp rise in whale inflows into Binance following Bitcoin’s recent correction. Over the past month, large holders have averaged 3,200 BTC per day deposited into exchanges—up from just 1,200 BTC per day at the end of April.
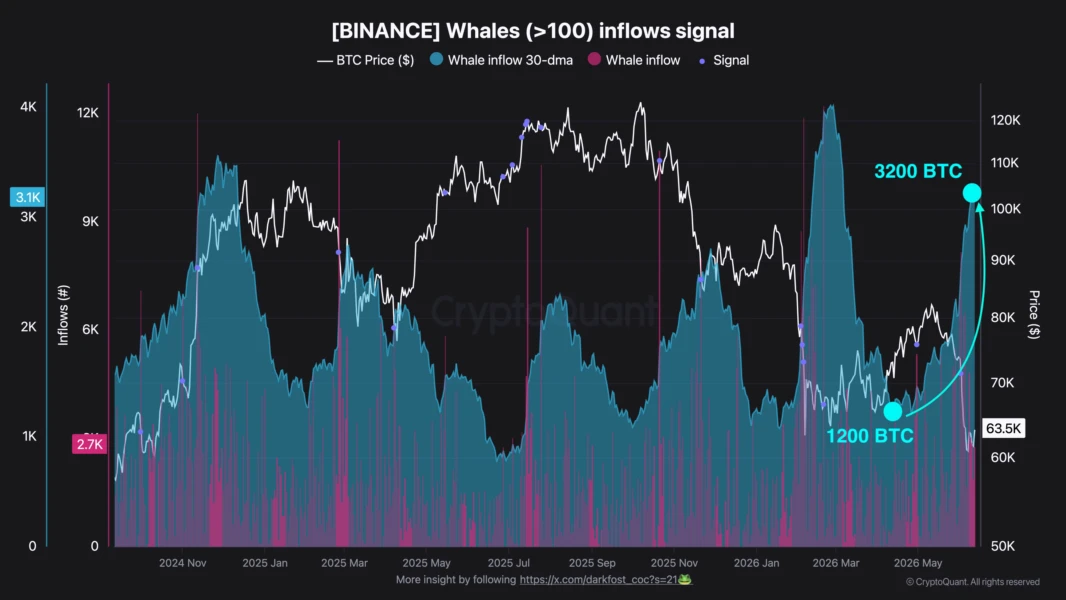
Chart caption: BTC inflows into Binance by whales holding >100,000 BTC
Source: CryptoQuant / Darkfrost
Key data: Average daily whale inflows into exchanges rose from 1,200 BTC at end-April to 3,200 BTC over the past month—a ~167% increase
In a Monday report, he wrote: “This trend indicates that many large holders intensified selling—or at least became more willing to sell—during the recent downturn.”
Join TechFlow official community to stay tuned
Telegram:https://t.me/TechFlowDaily
X (Twitter):https://x.com/TechFlowPost
X (Twitter) EN:https://x.com/BlockFlow_News
 @Cointelegraph