BTC Reclaims $80,000, Yet Bullish Reversal Remains Uncertain—Cautiously Exploring the Possibility of a Bear Market Bottom
TechFlow Selected TechFlow Selected
BTC Reclaims $80,000, Yet Bullish Reversal Remains Uncertain—Cautiously Exploring the Possibility of a Bear Market Bottom
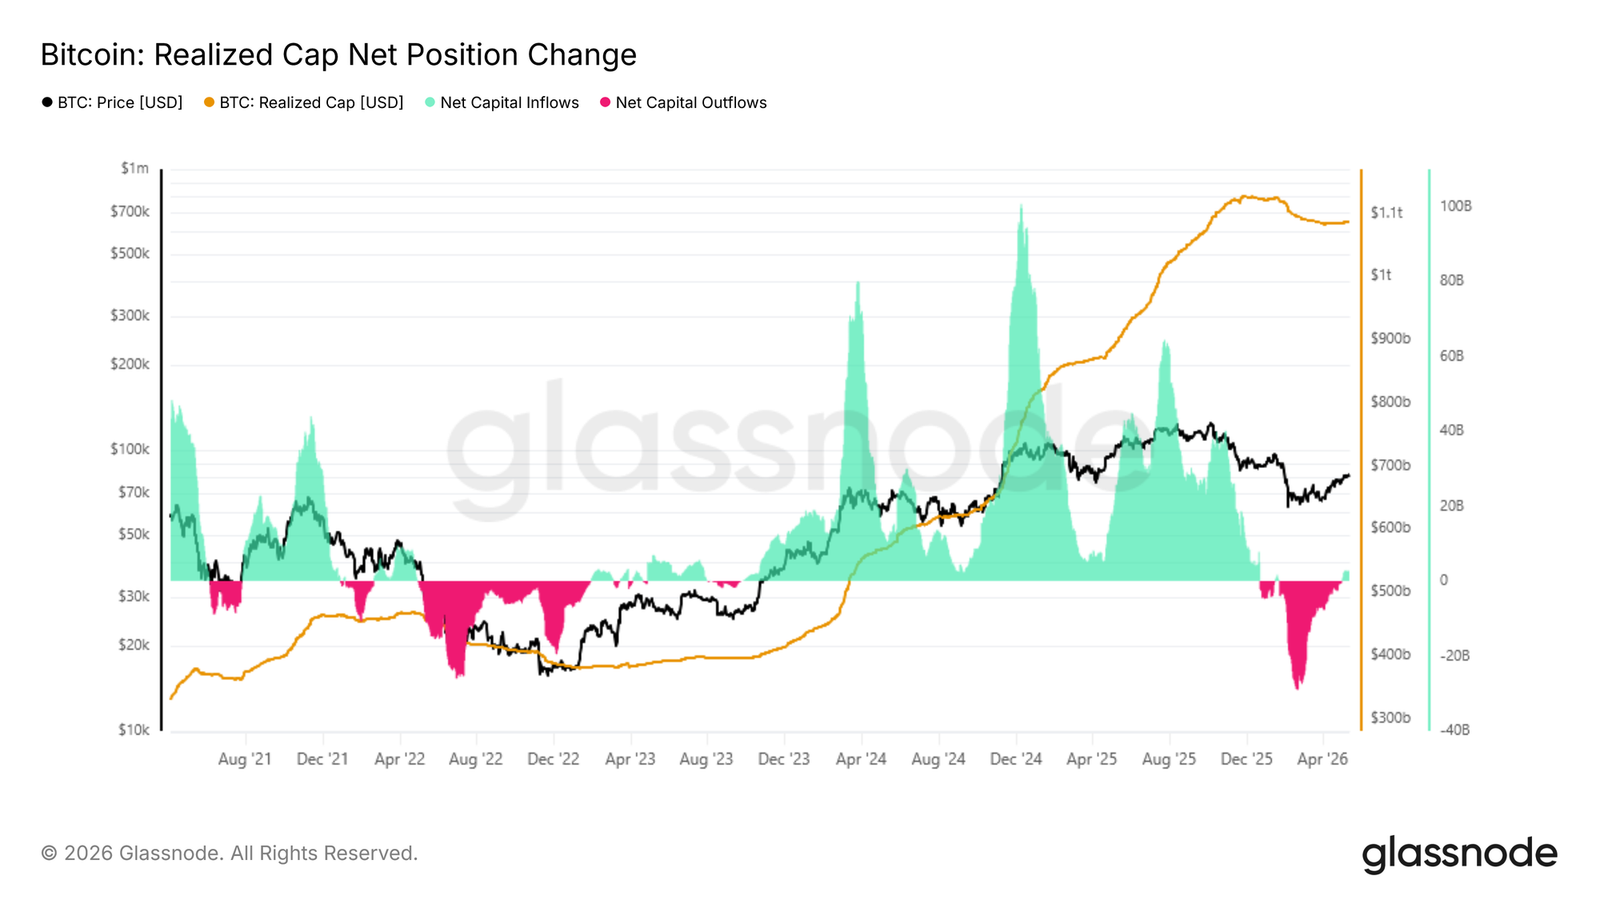
The realized market cap’s 30-day net position change has rebounded to $2.8 billion per month, indicating improving capital inflows—yet it remains far below the over $10 billion per month seen during previous bull-market expansions.
 Navigating Web3 tides with focused insights
Author: Glassnode
Translated by AididiaoJP, Foresight News
Bitcoin has reclaimed the $80,000 level, with ETF inflows, spot demand, and positioning all showing improvement. However, relatively weak capital inflows and heavy overhead supply near $86,000 continue to weigh on market confidence relative to prior bull phases.
Summary
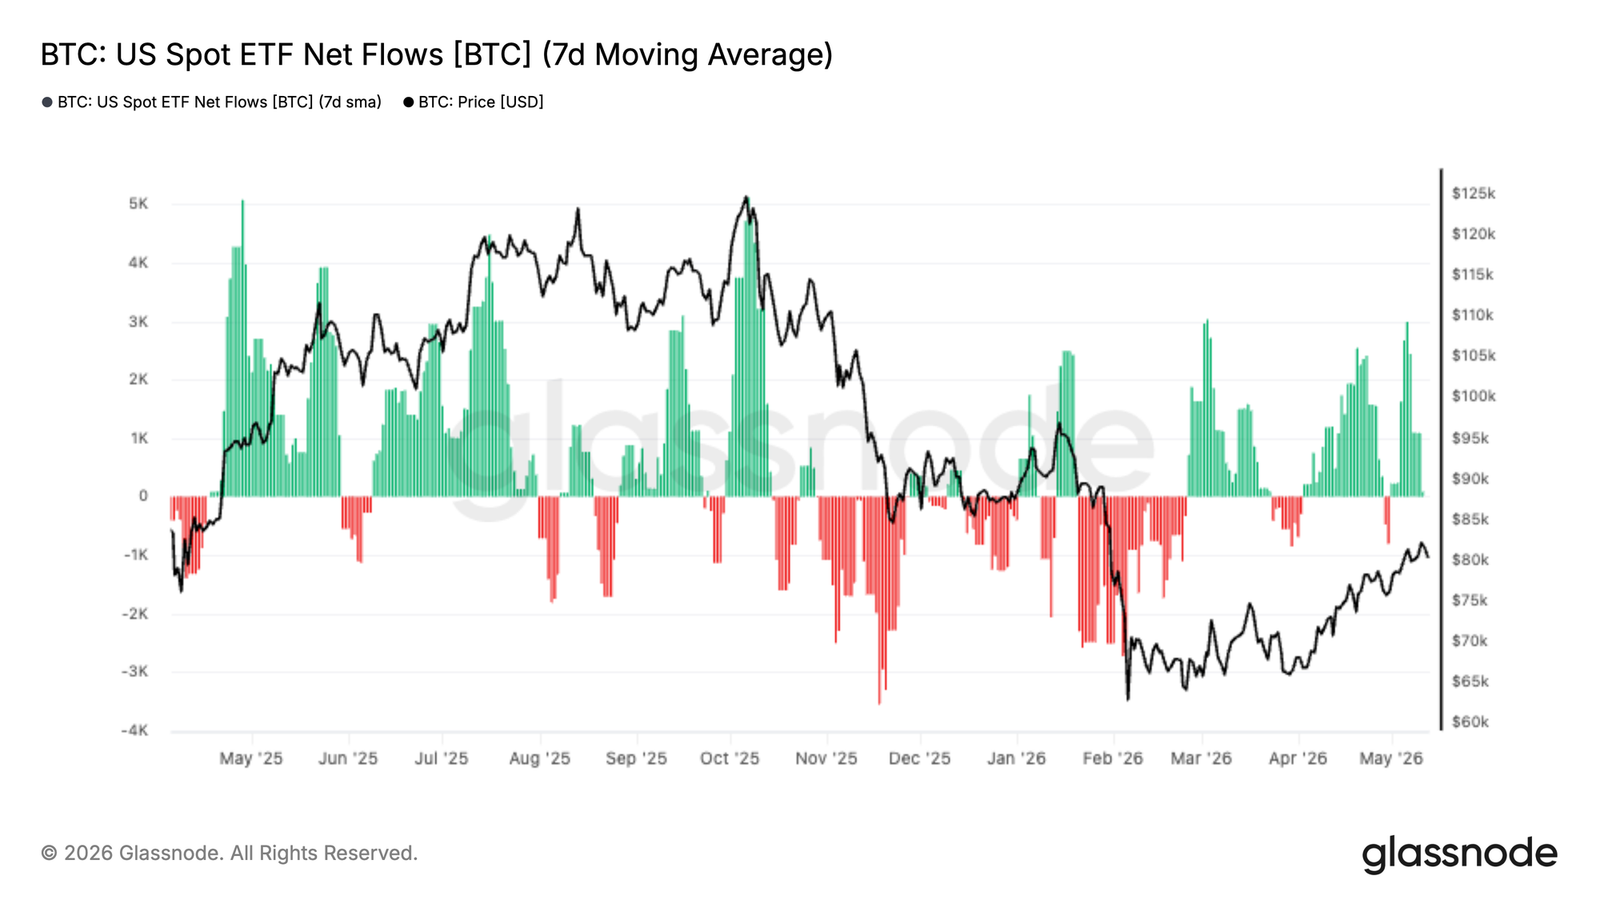
- U.S. spot Bitcoin ETF inflows have turned decisively positive again, signaling a resurgence in institutional demand as Bitcoin rebounded from the mid-$60,000 range to the low $80,000s.
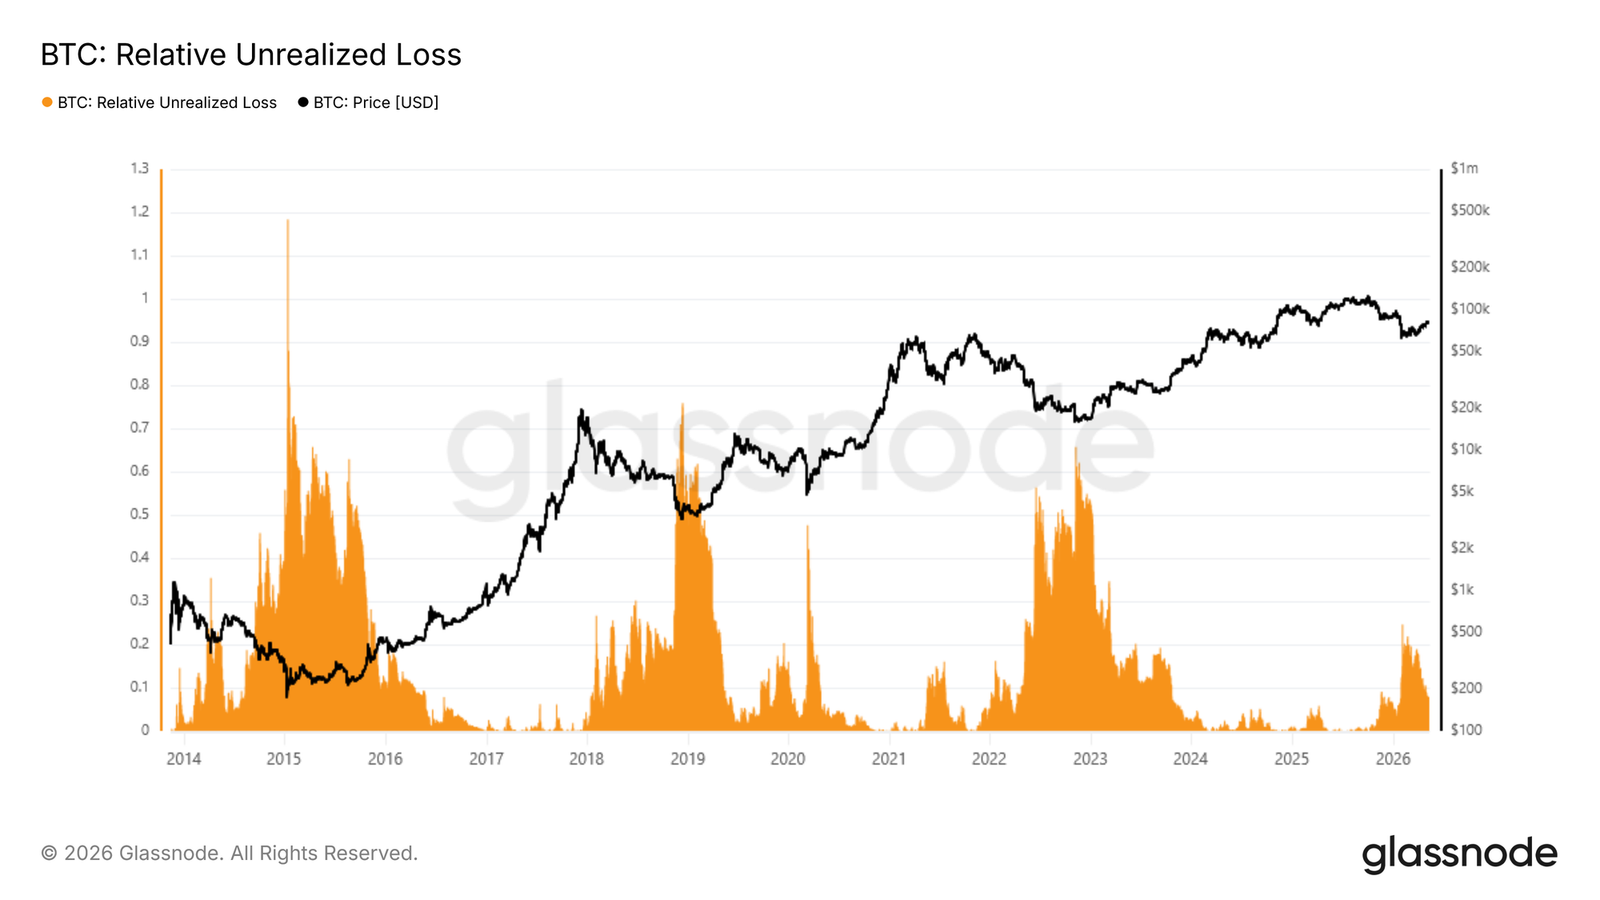
- Relative unrealized loss—the proportion of total market cap represented by the aggregate dollar value of unrealized losses across all holders—peaked at 25% of market cap during February’s sell-off, then compressed to ~8% following the recapture of $80,000. This supports the view that if $60,000 holds as this cycle’s low, the current bear market remains shallow.
- 30-day net realized valuation change has rebounded to $2.8 billion per month, indicating improving capital inflows—yet remains far below the >$10 billion monthly levels seen during previous bull market expansions.
- The 30-day cost basis stands at $76,900, forming immediate short-term support, while $86,900—the accumulation zone from November to February—remains a key near-term resistance level for recovery.
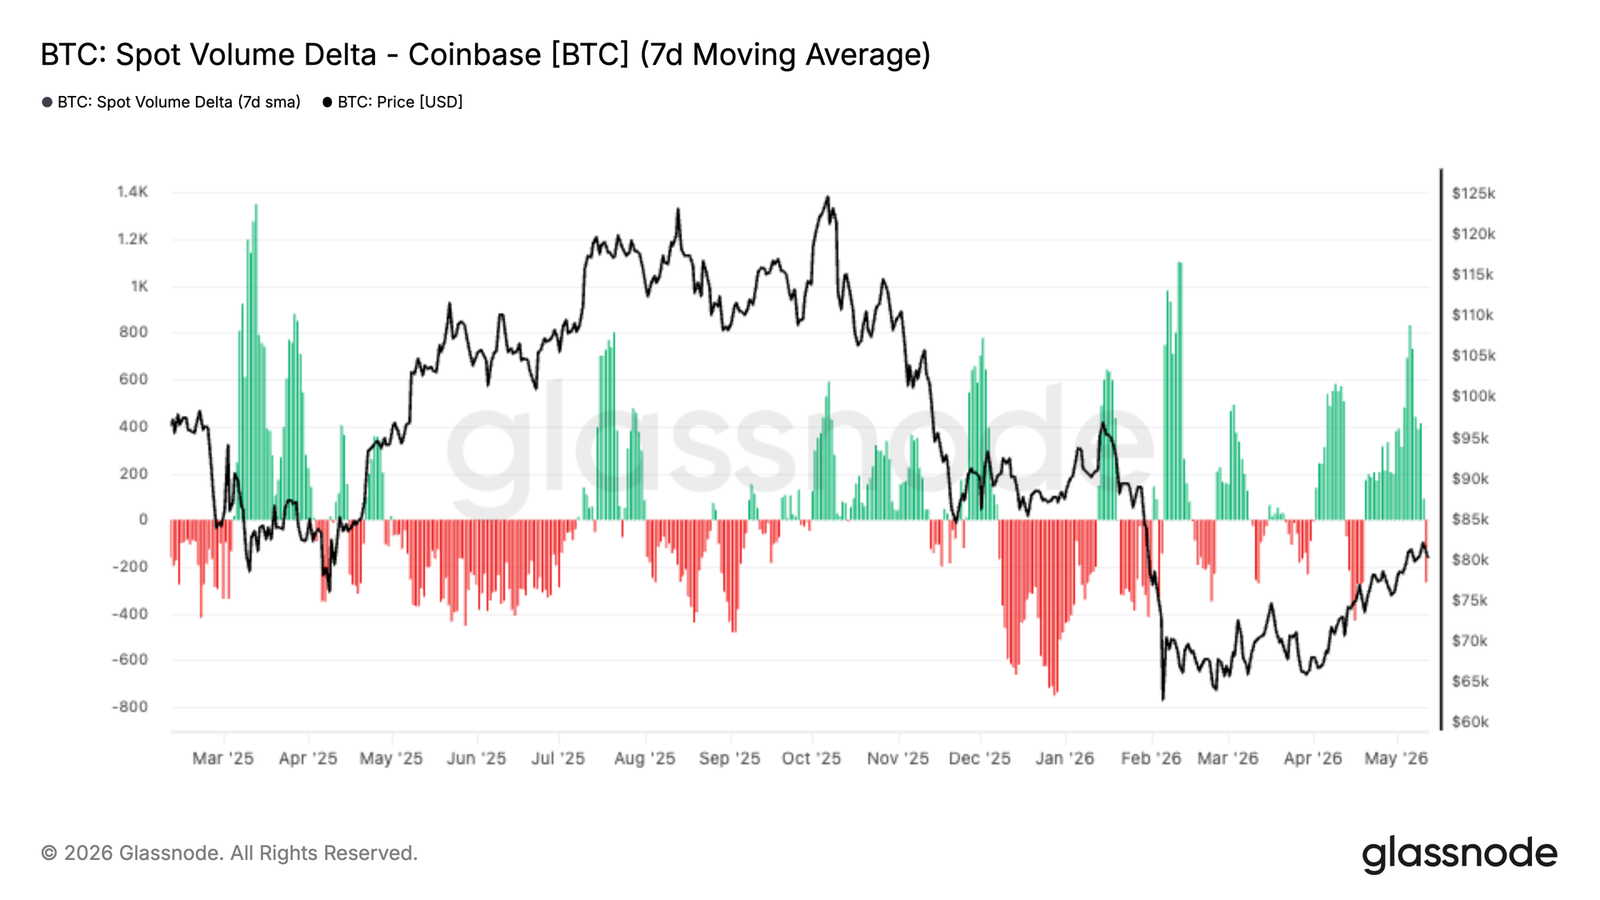
- Coinbase spot volume delta has sharply turned positive over the past two weeks, signaling increasingly aggressive buyer activity and strengthening spot demand.
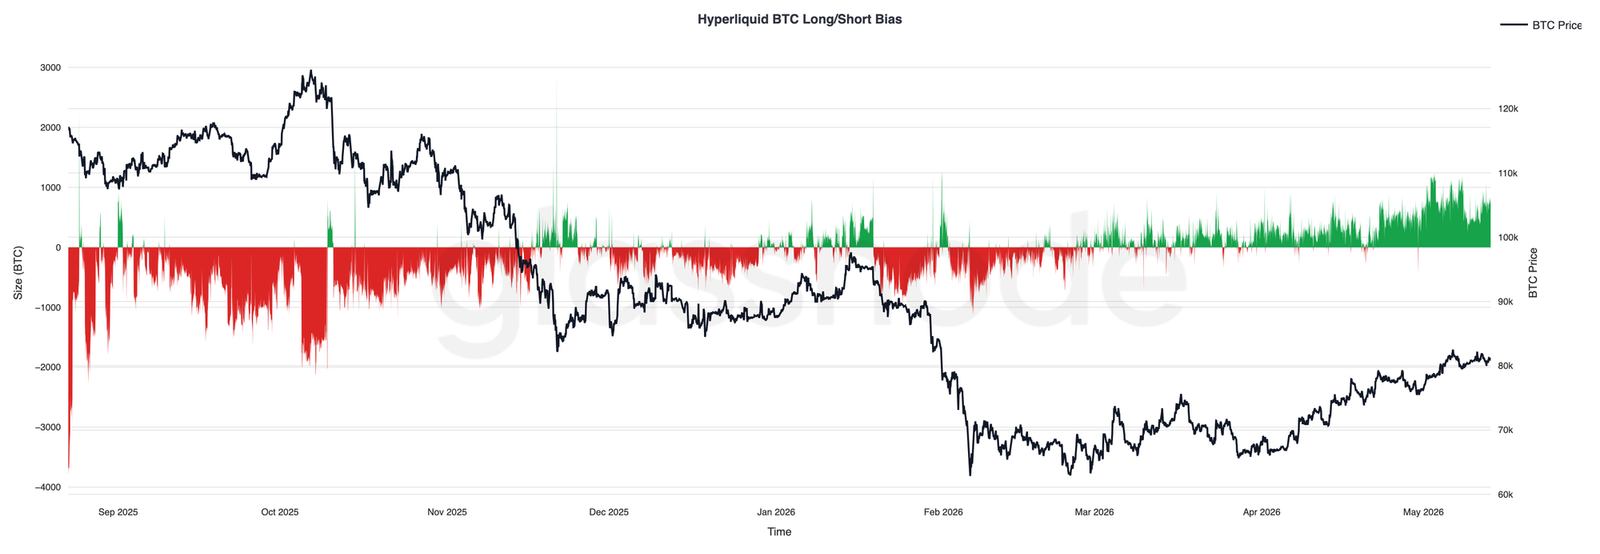
- Hyperliquid traders have steadily rebuilt long exposure as price rose, reflecting improved speculative sentiment and growing confidence in further upside continuation.
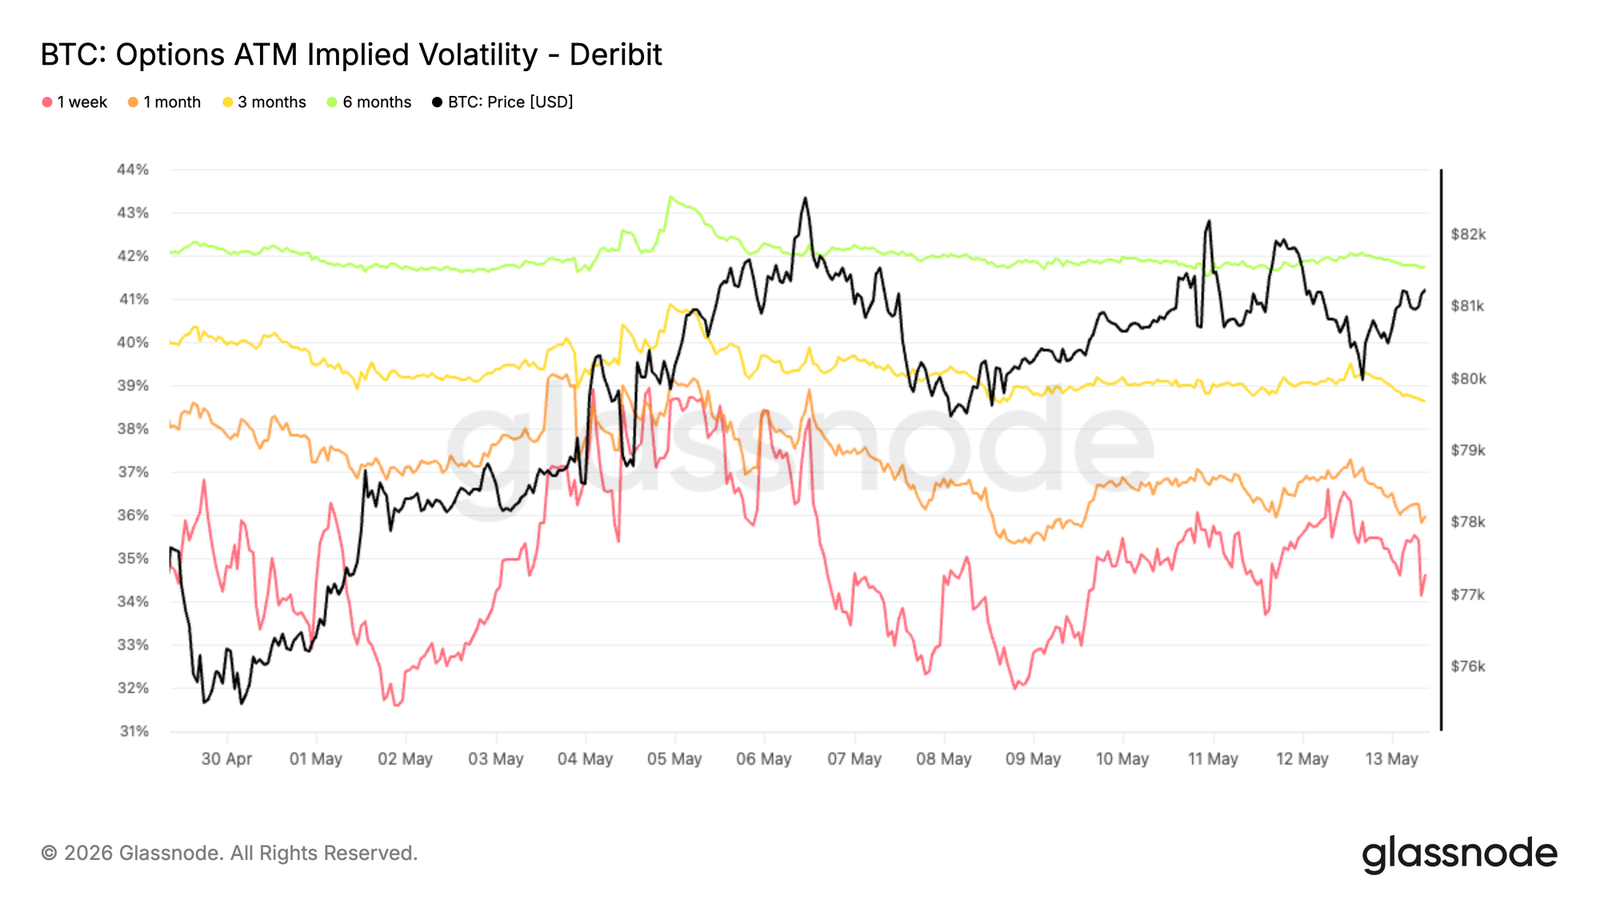
- Implied volatility continues compressing across all maturities—led by the front end—while realized volatility trends downward, pricing in a calmer near-term regime.
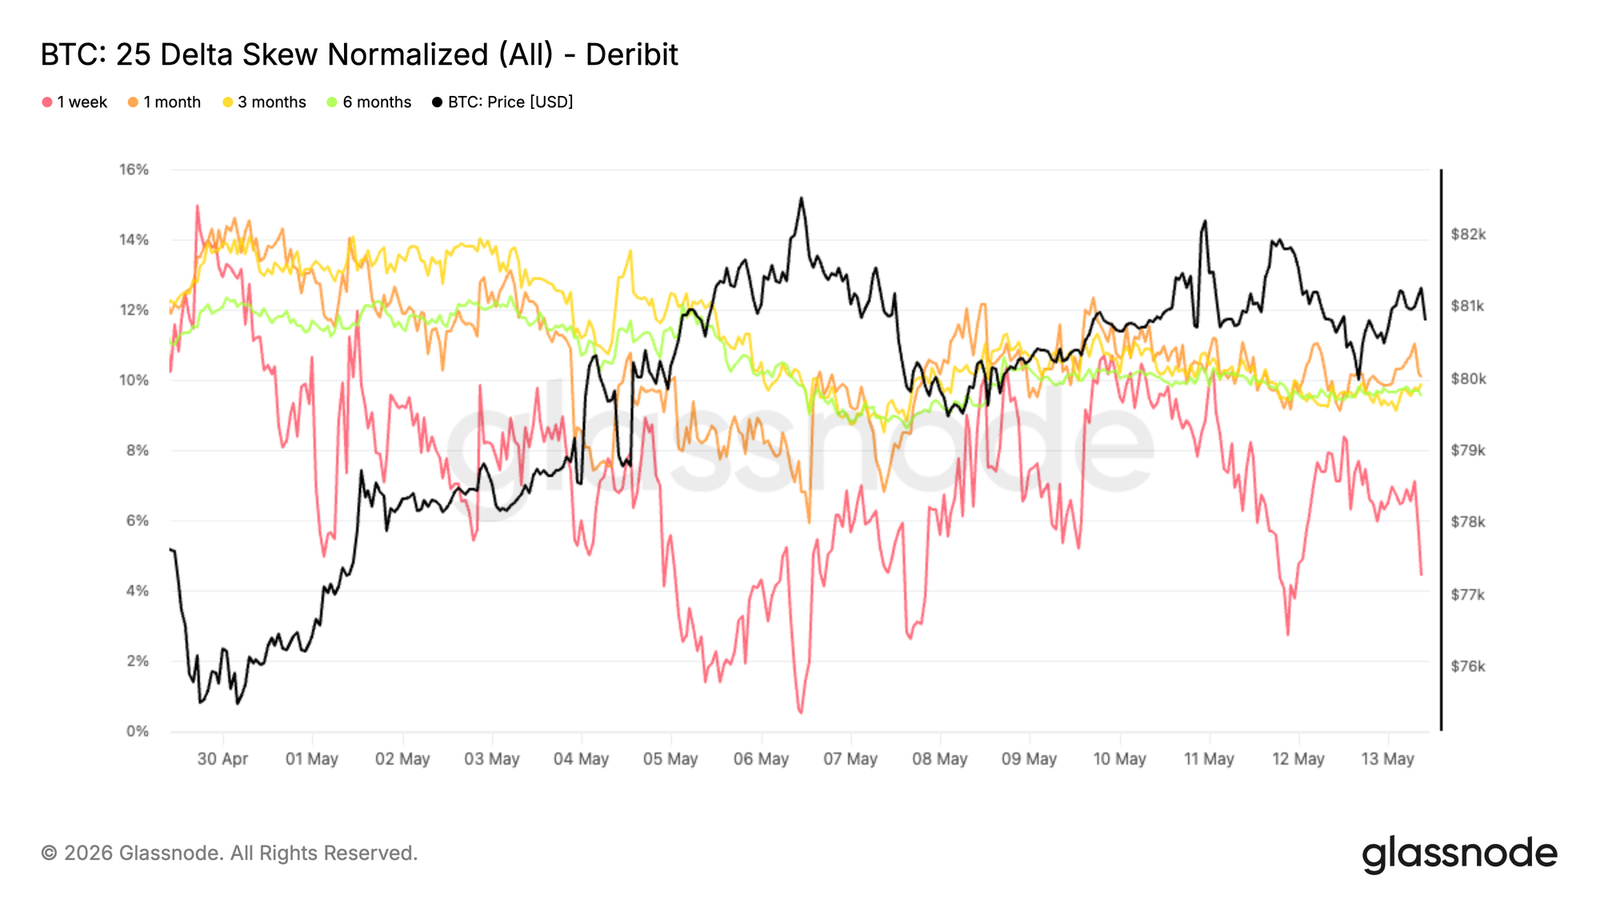
- Skew compression signals weakening demand for downside hedges, with options structure around $80,000 becoming more balanced.
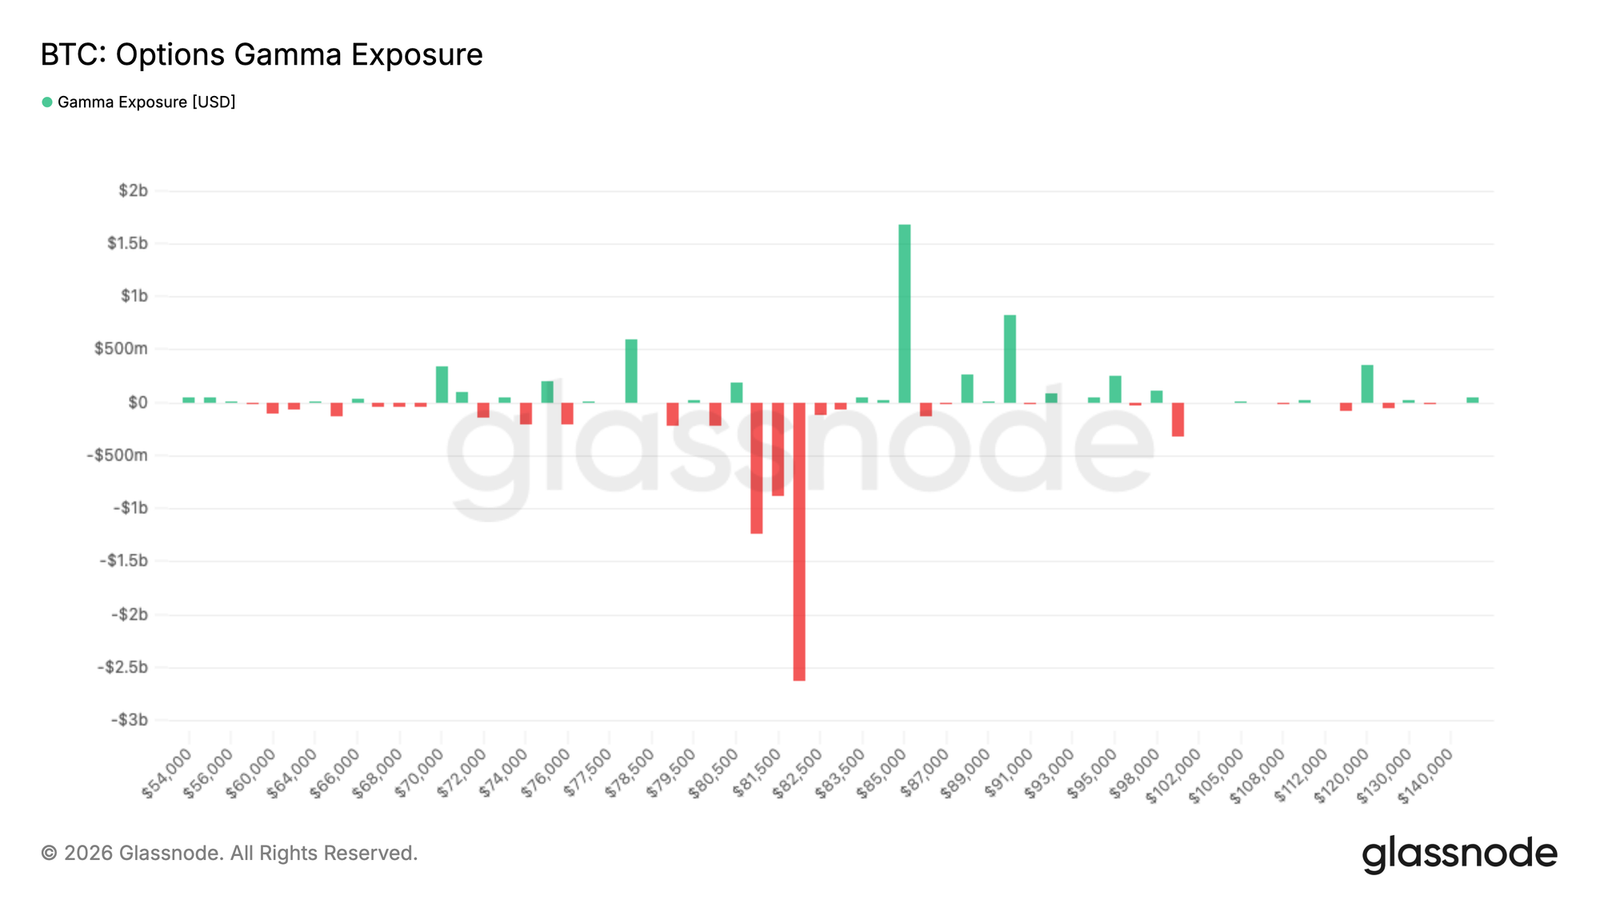
- Market maker positioning remains a key driver of short-term dynamics: a large negative gamma cluster near $82,000 could still amplify price moves if spot re-enters that zone.
Macro Insights
The macro backdrop remains caught between slowing growth and persistent inflation. Recent U.S. inflation data came in stronger than expected, and labor markets have proven more resilient than many anticipated. As a result, rate-cut expectations have been pushed further out, Treasury yields remain elevated, and financial conditions stay relatively tight.
Liquidity remains the key driver for risk assets. Equities continue to grind higher, yet underlying conditions remain fragile as markets adapt to the reality of “higher-for-longer” rates. Meanwhile, strength in oil and commodities continues to lift inflation expectations—especially amid ongoing geopolitical tensions.
For digital assets, the picture remains constructive—but selective. Despite tightening liquidity conditions and a strong dollar, Bitcoin continues to demonstrate resilience, suggesting underlying demand remains intact. However, soft ETF inflows and elevated real yields imply that a more sustained upside may require either looser financial conditions or a new catalyst to reignite broader risk appetite.
On-Chain Insights
From Fear to Uncertainty
Against a macro backdrop of sticky inflation, high Treasury yields, and tighter financial conditions, Bitcoin continues to show relative resilience—indicating that underlying demand remains intact even as broader risk sentiment remains unsettled. To assess where the current cycle stands structurally, relative unrealized loss—a precise cyclical barometer measuring the aggregate dollar value of unrealized losses held across all investors as a share of total market cap—provides critical insight. During February’s flash crash, this metric peaked at 25% of market cap, signaling significant stress—yet still far below extreme levels recorded in prior bear cycles. Following the recapture of $80,000, it has compressed to ~8%, shifting dominant sentiment from fear to uncertainty—not outright collapse.
If $60,000 proves to be this cycle’s low, the current bear market will be the shallowest on record—it registered fear, but fell well short of the broad-based capitulation historically marking durable cycle bottoms.
Scale of Capital Inflows
As sentiment shifts from fear to uncertainty, the central question is whether the current rally reflects a typical bear-market bounce—or the early stage of a true bull-market transition. The most direct gauge is net capital inflow, measured by the 30-day net realized valuation change—a metric tracking monthly changes in total on-chain capital. With the recent rebound to $82,000, this indicator has reached $2.8 billion per month, explaining the constructive momentum observed over recent weeks.
Yet context matters: during early stages of each major upswing in the 2023–2025 bull market, this metric accelerated rapidly—from ~$2 billion to over $10 billion per month. While the current reading is encouraging, it remains far below that threshold—suggesting the capital inflows underpinning this recovery lack the conviction seen at similar inflection points in prior cycles.
Support & Resistance Through the Lens of Cost Basis
Despite a 37% rebound from $60,000 to $82,000, capital inflows remain modest and uncertainty persists. Cost-basis metrics—segmented by holding period—provide a granular framework for identifying the most immediate support and resistance levels. This model tracks the average purchase price of coins grouped by holding duration, mapping investor cohort behavior directly onto the price chart.
Current rally momentum is primarily driven by accumulation over the past 30 days, whose cost basis now sits near $76,900—forming the most immediate short-term support floor. Above, the cost basis of investors who accumulated during the November–February consolidation ranges clusters near $86,900. As these holders approach breakeven and face increasingly strong distribution incentives, this zone represents the most likely near-term resistance area.
Off-Chain Insights
ETF Demand Rebuilding
U.S. spot Bitcoin ETF inflows have turned decisively positive over the past few weeks, returning as Bitcoin reclaimed the $80,000 level. After months of unstable demand and sharp outflows in Q1, this latest shift signals that institutional demand is beginning to re-emerge in a more meaningful way.
Critically, the ETF demand recovery shows persistence—not driven by a single surge in allocations—suggesting institutions are accumulating steadily as market conditions improve. Inflow intensity also accelerates alongside price, reinforcing the view that traditional capital is once again supporting momentum rather than exiting rallies.
The current structure shows marked improvement versus earlier this year. ETF inflows have become a tailwind rather than an ongoing source of selling pressure—removing one of the key structural headwinds that previously constrained recovery attempts. If sustained, continued institutional accumulation could provide the necessary demand foundation for Bitcoin to challenge higher overhead supply zones in the coming weeks.
Coinbase Spot Buying Accelerates Again
Coinbase spot volume delta has sharply turned positive over the past two weeks, signaling a return of aggressive buyer activity as Bitcoin reclaimed the low $80,000s. This latest shift stands in stark contrast to much of Q1, when persistently negative volume reinforced downward momentum.
Importantly, the latest uptick has been accompanied by repeated increases in positive spot buying volume—not an isolated surge—indicating sustained demand is beginning to absorb overhead supply. Coinbase activity’s strengthening also aligns closely with the ETF inflow recovery, suggesting renewed participation from both domestic and institutional buyers.
The current structure suggests spot demand is once again acting as a price-supportive force—not a distribution channel. Sustained strength in Coinbase buyer flows—particularly when rising in tandem with ETF inflows—indicates improving market conviction and a healthier underlying demand profile for this latest rally.
Hyperliquid Traders Turn Increasingly Bullish
Over the past few weeks, positioning on Hyperliquid has grown increasingly long as Bitcoin rebounded to the low $80,000s, with BTC net position rising steadily. This shift marks a notable reversal from the persistent short bias that dominated most of Q1, when the market dropped to lows near $60,000.
Critically, the recent increase in long exposure has developed gradually—not via a single crowded surge—indicating traders are steadily rebuilding directional long exposure as market conditions improve. Net position is now approaching its most bullish tilt since late 2025, reflecting growing confidence in upside continuation.
Sustained long positions amid rising price action signal improving trader sentiment and a more constructive speculative backdrop—though increasingly crowded long exposure may render the market more sensitive to short-term volatility and liquidation-driven pullbacks.
Implied Volatility Declines
Over the past week, Bitcoin’s implied volatility turned downward—the front-month dropping from 39% to 34.6%. Longer-dated tenors followed suit, declining ~1–2 vol points across the curve.
This move reflects a broad repricing lower across the term structure, as traders reduce expectations for near-term realized volatility. The decline follows a recent volatility rebound and coincides with more controlled spot action—reinforcing the view that markets are returning to a calmer regime.
As implied volatility compresses, option costs decline across tenors—especially at the front end, which is most sensitive to short-term positioning and demand shifts.
The current structure reflects reduced pricing for large near-term moves, with volatility supply continuing to exceed demand across the curve.
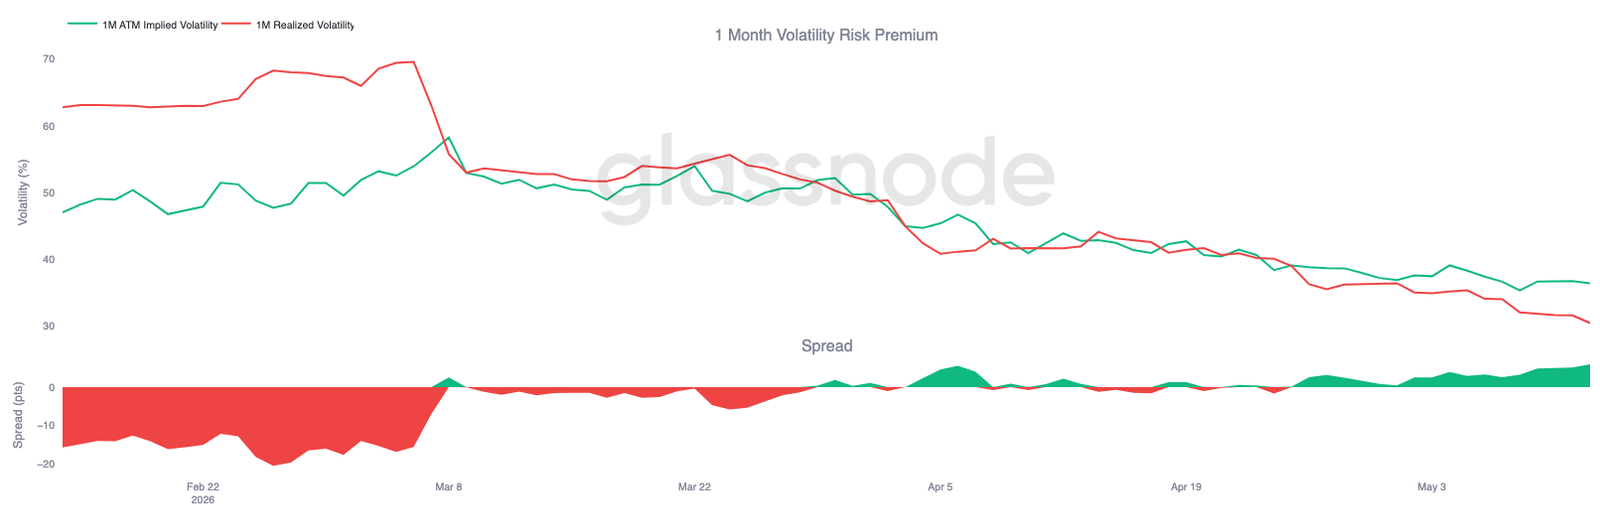
Volatility Risk Premium Remains Positive
While implied volatility continues compressing across all tenors, realized volatility is falling even faster. Bitcoin’s 30-day realized volatility currently stands at 30.48%, trending steadily lower over recent weeks as spot action remains relatively controlled.
Meanwhile, front-month implied volatility remains ~36.4%, keeping implied above realized—and maintaining a positive volatility risk premium. In other words, options continue pricing in more volatility ahead than Bitcoin’s recent spot action has delivered.
The spread between implied and realized volatility has also rebounded over the past two to three weeks—rising back to ~6 vol points after briefly compressing to parity in April. This indicates that although overall volatility is resetting lower, options demand remains elevated relative to realized volatility.
Thus, despite continued softening across both implied and realized volatility dimensions, hedging conditions remain favorable for volatility sellers.
Skew Compression Signals Weakening Downside Hedge Demand
As volatility expectations continue resetting lower, skew is also normalizing across all tenors—most notably at the front end, where 1-week 25-delta skew compressed from ~−10% to −4% over the past week. Longer-dated tenors softened in parallel: 1-month, 3-month, and 6-month skews each lost ~1–2 points of put premium.
Notably, this compression occurred amid Bitcoin consolidating around $80,000—and against a macro backdrop offering limited support. The options surface shows no increased demand for downside protection; instead, it continues repricing toward a more balanced structure.
This upward move reflects a steady reduction in put premium relative to call premium—indicating waning, not intensifying, demand for downside protection across all tenors.
While skew remains in negative territory across tenors, continued compression signals a gradual easing—not escalation—of downside hedge demand.
Market Maker Gamma Keeps Spot Sensitive Near $82,000
Market maker positioning continues generating reactive structure around current price levels. The largest concentration of negative gamma resides at the $82,000 strike—exposing ~$2.6 billion—while positive gamma accumulates near $85,000, approaching $1.8 billion.
Since spot remains below the $82,000 negative gamma cluster, a re-entry into that zone could trigger reactive market maker hedging flows—amplifying momentum and magnifying price moves. Higher up, the positive gamma concentration near $85,000 could dampen volatility.
Flows also reflect the positioning shift. Over the past 7 days, put purchases accounted for 71% of premium flow—reflecting elevated downside protection demand during recent consolidation. In the most recent 24 hours, 58% of flow came from put sales—indicating some hedges are being unwound.
This structure makes the market increasingly sensitive to amplifying hedging flows if spot re-enters the dense negative gamma cluster near $82,000.
Conclusion
In summary, Bitcoin’s recovery continues strengthening beneath the surface: spot-led demand, revived ETF inflows, and improving speculative positioning are collectively fostering a more constructive market structure. The sharp compression in relative unrealized loss—and stabilization in key on-chain profitability and liquidity metrics—increasingly frames February’s decline as a cyclical reset—not the onset of a deeper bear market.
At the same time, this rally differs markedly from the aggressive expansion seen during 2023–2025. Capital inflows are recovering—but remain far below prior breakout thresholds—while volatility compression and calmer derivatives positioning point to markets gradually rebuilding confidence, not entering euphoria. This makes the current advance look more like a structurally supported recovery—not a fully confirmed breakout.
With Bitcoin now re-entering the dense overhead supply zone between $82,000 and $87,000, the market is entering a region where price discovery becomes increasingly critical. Sustained holding of this zone will likely require stronger spot participation and deeper capital rotation to absorb remaining overhead supply. Until then, broader structural improvements continue—but conviction appears to be rebuilding—not fully restored.
Join TechFlow official community to stay tuned
Telegram:https://t.me/TechFlowDaily
X (Twitter):https://x.com/TechFlowPost
X (Twitter) EN:https://x.com/BlockFlow_News
 @glassnode