Bullish momentum wanes, volatility declines, and Bitcoin consolidates between $60,000 and $70,000
TechFlow Selected TechFlow Selected
Bullish momentum wanes, volatility declines, and Bitcoin consolidates between $60,000 and $70,000
Supply pressure ranging from $80,000 to $126,000 constitutes the biggest resistance to upward movement.
 Navigating Web3 tides with focused insights
Author: Glassnode
Translation & Editing: AididiaoJP, Foresight News
Bitcoin remains range-bound between $60,000 and $70,000. Early accumulation signals are emerging in the spot market, while the derivatives market has completed a reset. Volatility has subsided, and positioning has become more balanced. However, without a clear catalyst, the market lacks the confidence required to sustain a decisive breakout.
Executive Summary
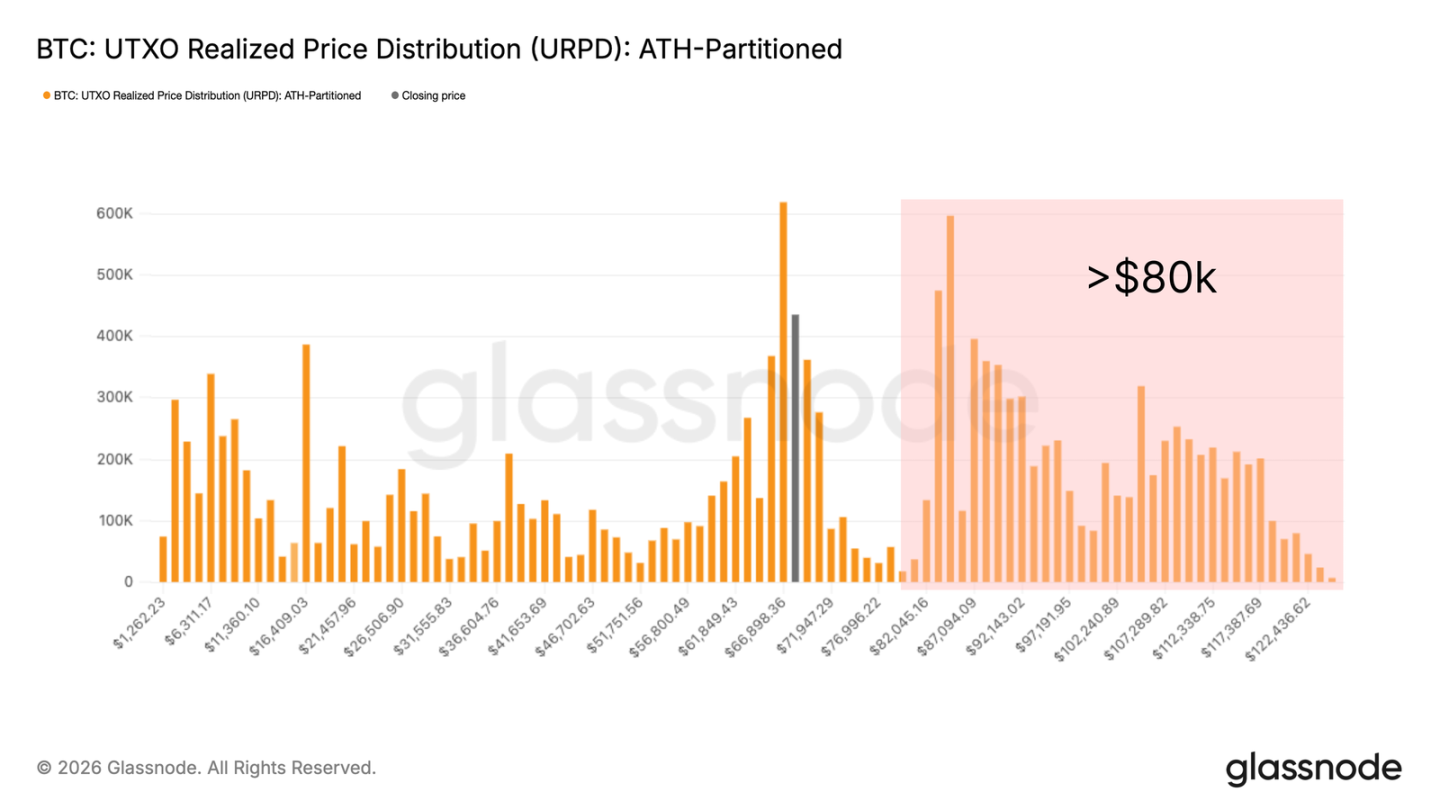
- Bitcoin continues to trade within a broad $60,000–$70,000 range. URPD data reveals a dense cluster of supply stacked between $80,000 and $126,000. Absorbing this supply may require either a significantly deeper price discount or a prolonged redistribution process.
- The total supply currently underwater approaches 8.4 million BTC—mirroring market structure observed in Q2 2022. At that time, approximately 3 million BTC needed to be redistributed before the market could re-establish itself at the cycle’s median level.
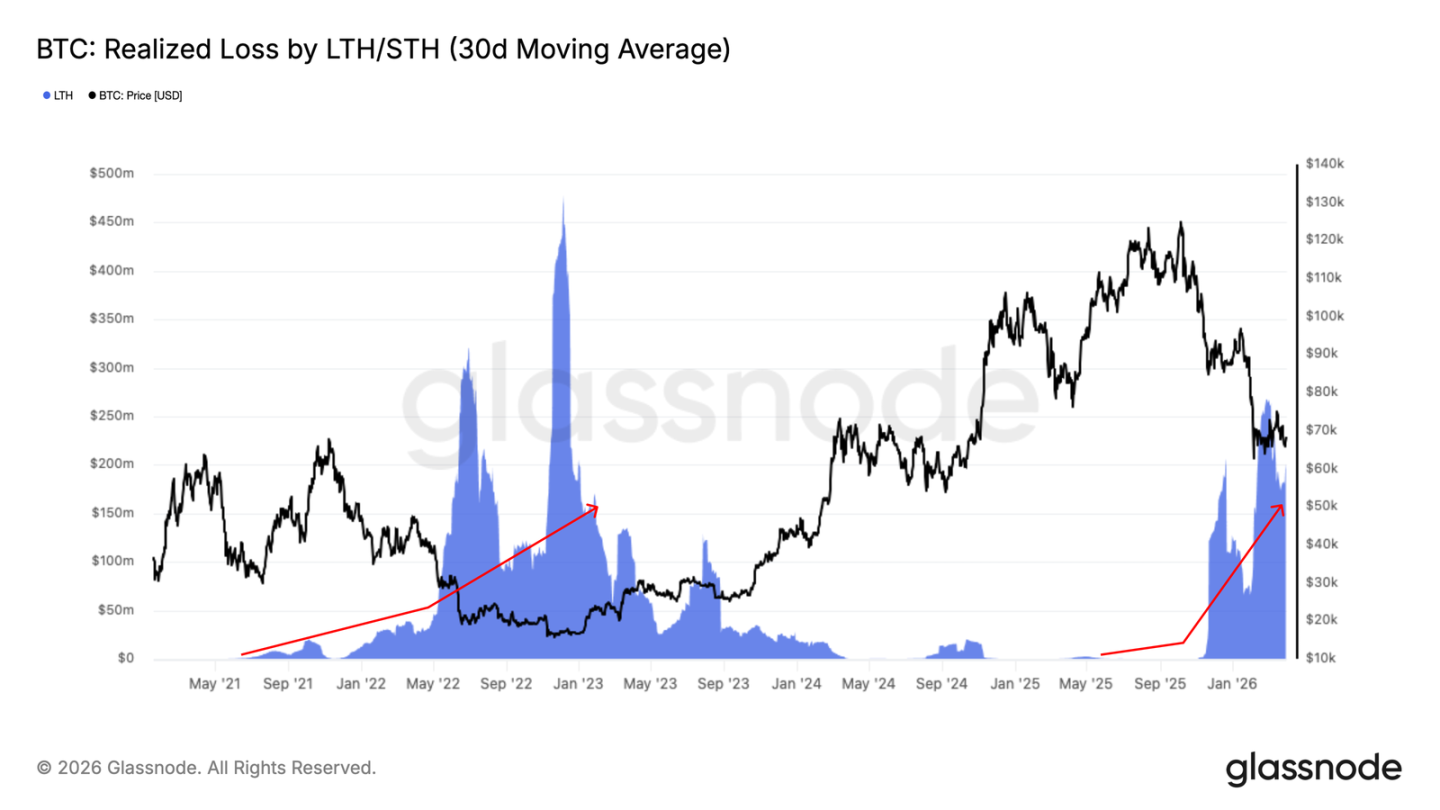
- Realized losses among long-term holders have risen steadily since November 2025 and now stand at roughly $200 million per day—a confirmed signal of active capitulation. A decline below $25 million per day would represent a critical threshold for market bottoming.
- The Coinbase spot cumulative volume delta has turned slightly positive, indicating that spot buyers are beginning to absorb seller pressure. Yet current demand levels remain far below those typically observed when durable market lows form.
- Treasury flows have grown increasingly concentrated: Marathon has distributed ~15,000 BTC, while Strategy remains the sole institutional buyer executing consistent large-scale purchases.
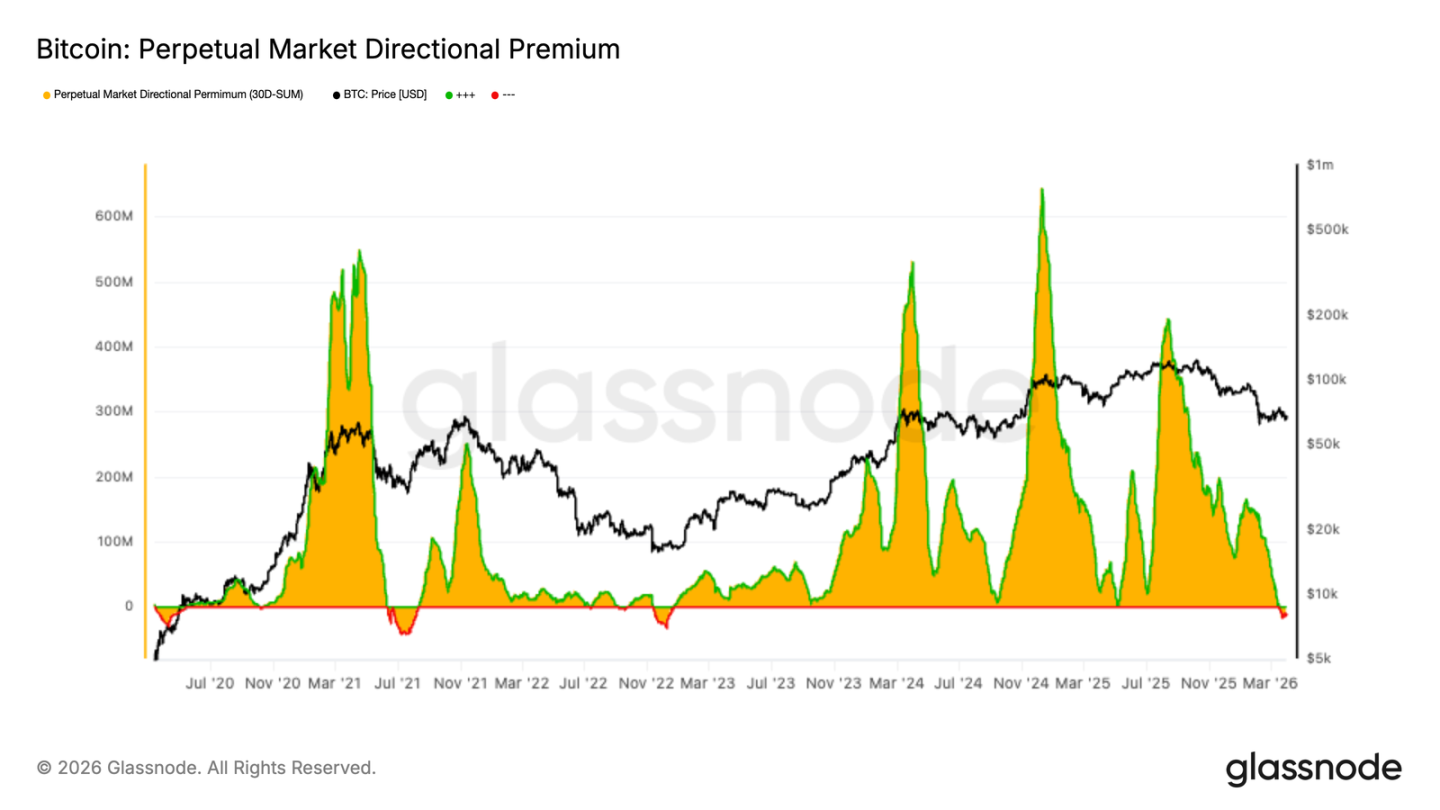
- Directional funding premiums in perpetual futures markets have compressed near neutrality—and slightly below zero—reflecting a reset of bullish leverage and cooling speculative enthusiasm.
- Perpetual contract positioning is no longer momentum-driven; long positions are being unwound and short interest is resurfacing. This renders the futures market more balanced overall—but also more cautious.
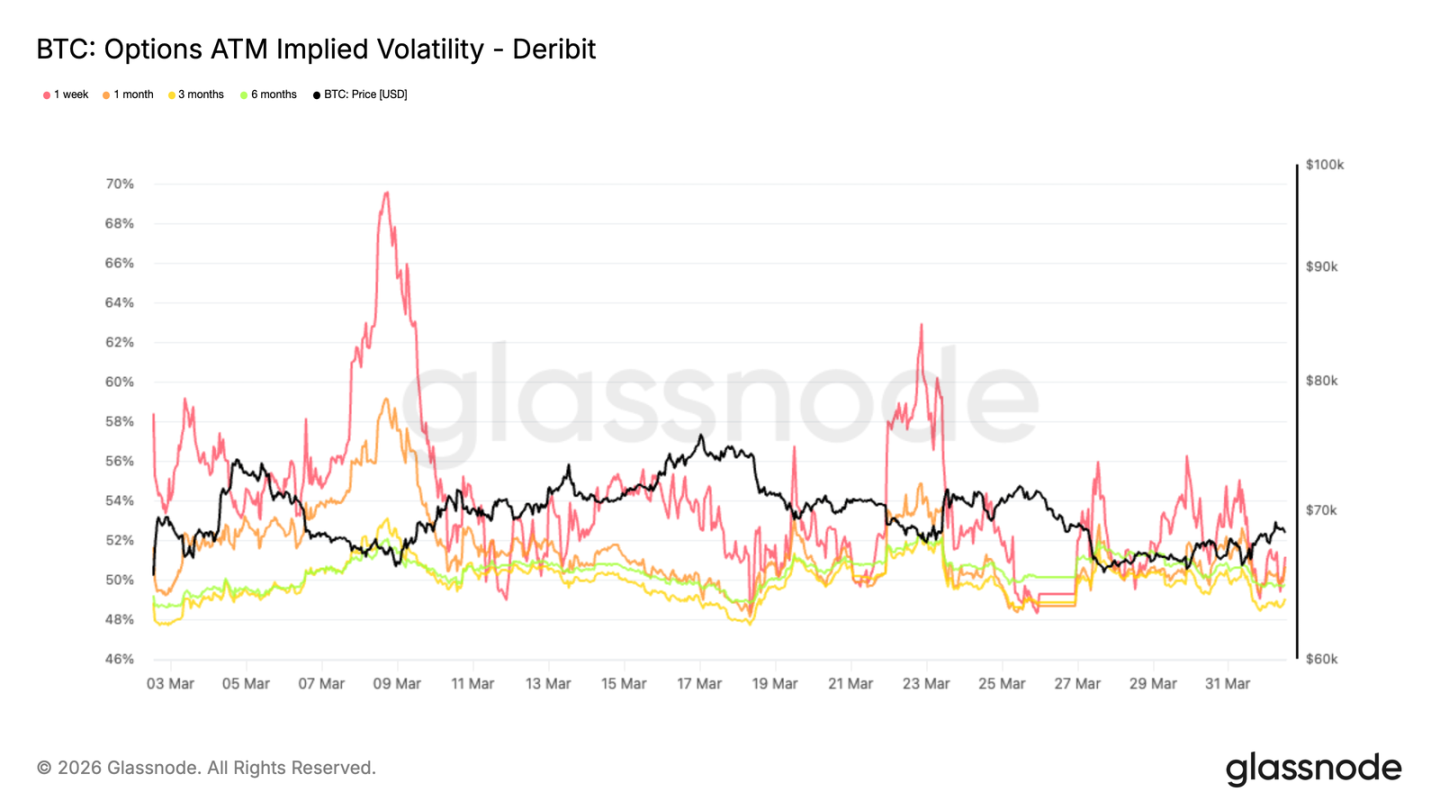
- Implied volatility continues to soften across the entire term structure, signaling that options markets are pricing in a quieter near-term environment and declining demand for volatility exposure.
- Skew indicators are turning downward again, suggesting renewed protective positioning—though levels remain well below those typically associated with strong hedging demand.
- Gamma positioning has reverted to net supportive, reducing convexity-driven downside acceleration during price declines and indicating stabilization in market makers’ short-term positioning following the recent negative gamma phase.
On-Chain Insights
Scale of Unrealized Loss Supply
With price consolidating between $60,000 and $70,000, this report steps beyond short-term price dynamics to assess the structural forces shaping the current market environment. As highlighted in recent reports, one of the most persistent sources of resistance to upward momentum is the large volume of supply purchased above $80,000—currently sitting underwater.
This cohort has endured over six months of bearish conditions and faces a binary behavioral choice: sell into any rally to limit further losses—or capitulate psychologically as drawdowns deepen.
The URPD chart makes this clear: a densely clustered supply zone sits firmly above current market prices, spanning $80,000–$126,000. Resolving this supply overhang will likely require either a substantial price discount to attract new buyers—or an extended period allowing these coins to migrate from underwater holders to more conviction-driven new owners.
Underwater Supply
To quantify the overhead supply overhang, we turn to the “Total Supply Underwater” metric—which counts the number of circulating bitcoins whose last movement occurred at a price higher than the current spot price. Smoothed using a 30-day simple moving average to filter out short-term noise, this indicator currently stands at ~8.4 million BTC, meaning roughly 8–9 million BTC have remained underwater over the past month.
This scale—combined with spot price trading near the current cycle’s median level—suggests structural parallels to conditions observed in Q2 2022. Historically, resolving supply of this magnitude requires large-scale redistribution from underwater holders to new buyers entering at lower prices. The 2022 bear market offers a useful precedent: typically, only after Total Supply Underwater falls from above 8 million BTC to ~5 million BTC does the market decisively reclaim its cycle median—implying ~3 million BTC changed hands before normalization.
Tracking Ongoing Redistribution
Having identified the scale of underwater supply requiring redistribution, the next step is monitoring the pace of that process. The “Long-Term Holder Realized Losses” metric tracks the aggregate realized losses incurred by investors who held for over six months before selling below their original cost basis. This indicator directly captures the active redistribution process occurring among the overhead supply cohort.
Its 30-day moving average has risen steadily since November 2025 and now sits at ~$200 million per day—confirming increasing capitulation among long-term holders. While this wave of realized losses is a necessary and constructive part of bear market cleansing, it alone is insufficient to trigger a market reversal. A significant decline below $25 million per day would signal meaningful exhaustion of seller pressure—and historically precedes sustainable bull market initiation.
Off-Chain Insights
Coinbase Spot Demand Returns
The spot market shows early signs of stabilization. The 30-day moving average of the Coinbase spot volume delta has turned marginally positive in the latest data—after remaining negative for an extended period through January and early February, reflecting sustained distribution pressure.
This recent shift suggests buyers are beginning to absorb available supply and provide support as price stabilizes. Yet the modest size of the positive delta indicates current demand remains tentative—not yet driven by strong conviction.
Historically, stronger market recoveries require sustained positive spot inflows; fleeting buying activity rarely sustains follow-through. For now, the recent uptick is constructive—but a more durable recovery likely requires expanding buyer pressure.
Treasury Flows Grow More Concentrated
The broad-based foundation of treasury flows has notably weakened over recent months. Latest data reveals a more uneven and selective activity pattern. Early in the cycle, corporate accumulation enjoyed support from a wider base of allocators. Recently, however, flows indicate buyer support is becoming increasingly concentrated.
Most notably, Marathon has sold ~15,000 BTC—the clearest recent example of corporate treasury reduction rather than expansion. In contrast, Strategy appears to be the sole consistent structural buyer; even as other firms’ participation grows more sporadic, it continues regular purchases.
This shift points to a major structural change. Corporate demand is no longer a broad-based accumulation trend—it now appears narrower and more reliant on a single dominant participant. The result is that while corporate buying persists, its foundation is less diversified and thus less reliable as a source of structural support compared to earlier cycle stages.
Perpetual Funding Reset
Directional funding premiums in perpetual futures markets continue compressing, with the 30-day sum now near neutral—and slightly below zero. This marks a clear cooling from prior pro-bull conditions that supported the rally.
This shift signals that bullish speculative positions are being unwound, while short interest begins re-emerging. The current structure reflects neither strong conviction nor directional bias—but rather a more cautious and balanced perpetual market landscape.
Historically, funding premium resets often accompany consolidation or trend exhaustion—since leverage is repriced after extended moves. In this sense, the recent funding compression signals waning speculative appetite and confirms a full reset of the perpetual market under reduced leverage.
Volatility Expectations Decline
After options positioning completes its reset, implied volatility is the first metric to shift. Bitcoin’s volatility term structure has declined broadly week-on-week—with front-end tenors leading the move. One-week at-the-money implied volatility now stands at 51%, three-month at 49%. Other tenors sit tightly bunched in between—six-month at 49.8%—pointing to a markedly compressed term structure.
This reflects a market lowering expectations for near-term large swings—even amid ongoing macro uncertainty. Longer-dated volatility retains relatively stronger support, indicating uncertainty hasn’t vanished—just been pushed further out in time. Near-term pricing is shifting toward a more convergent volatility regime, given the lack of immediate catalysts and fading demand for optionality.
Downside Protection Rebuilds
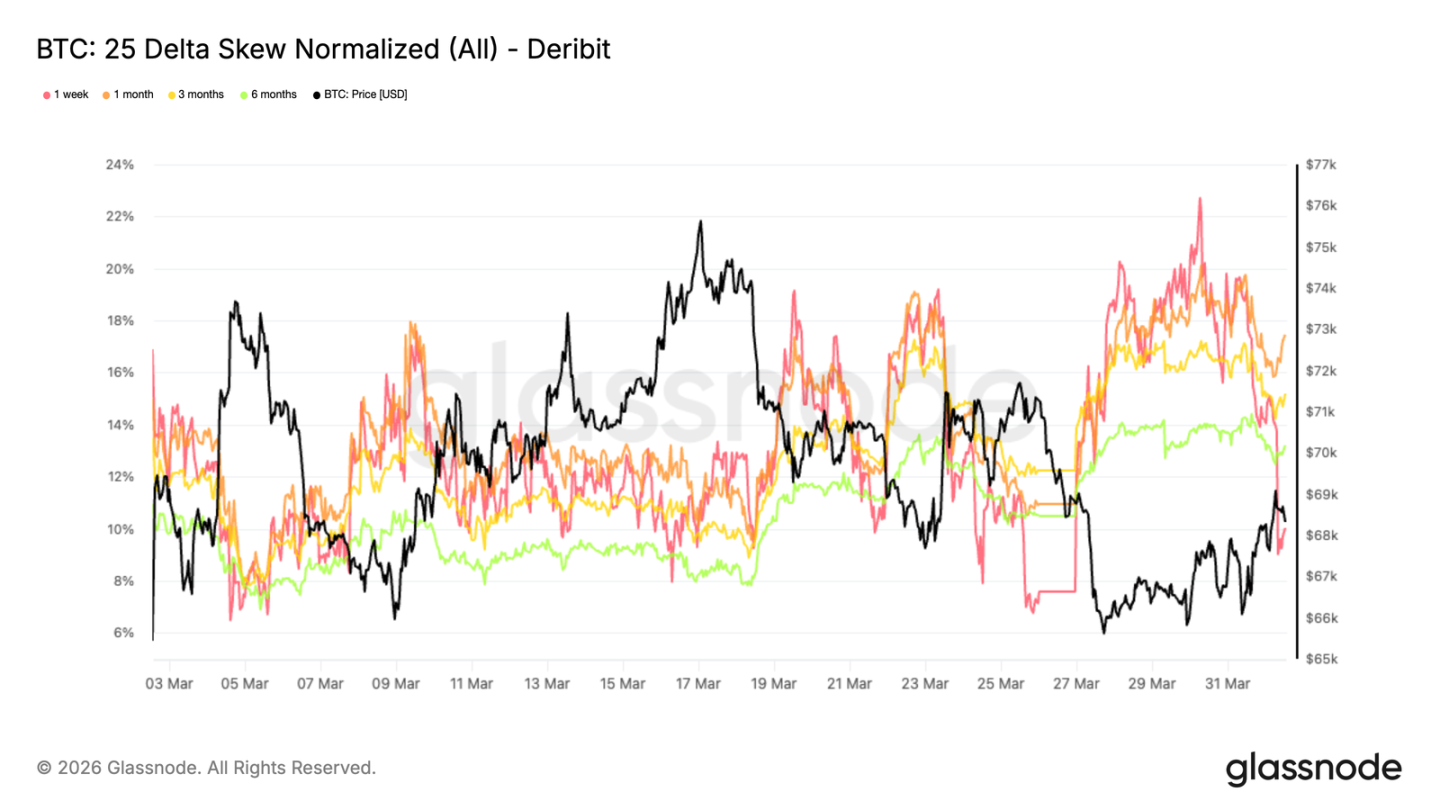
As volatility expectations soften, skew metrics reveal a shift toward more cautious positioning. 25-delta skew (calculated as put minus call) increases as markets price in more downside protection. Last week, one-week skew hit a monthly high of 22.7% ahead of the pullback—highlighting its sensitivity to immediate price action. By contrast, longer-dated skew continued rising and remains elevated: one-month at 17.4%, six-month at 13.2%.
This divergence across tenors is telling. While recent spot stabilization eased short-term hedging demand slightly, medium- and longer-term protective options retain strong buying interest. Markets aren’t aggressively pricing large moves—but consistently assign greater weight to downside risk across the term structure. This points to a persistent defensive bias—not merely a transient reaction to short-term volatility.
Short-Term Gamma Below Market Level
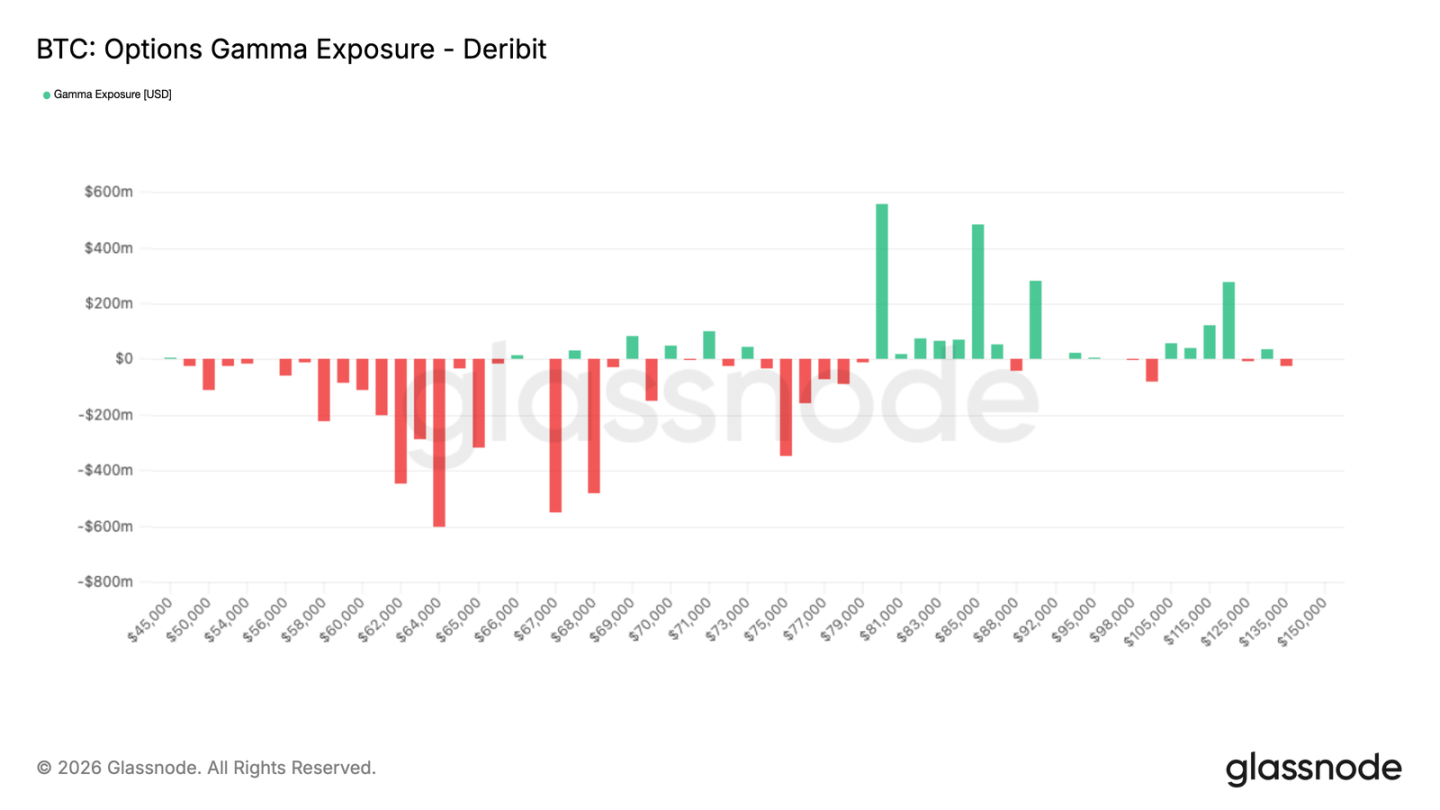
This more defensive positioning becomes especially relevant when mapped to market makers’ gamma exposure. Negative gamma is currently accumulating below current price—from $68,000 down to well below $50,000. This means the market is buying puts below current levels and not expecting any near-term rally to persist—forcing market makers to act as counterparties to these trades.
Under this dynamic, market makers must sell as price weakens—amplifying downside volatility. With liquidity still thin following the March 27 expiry, the overall market structure appears fragile. Once price enters this zone, hedging flows may accelerate the downtrend—transforming what might otherwise be a gradual adjustment into sharper repricing—and potentially retesting the $60,000 level—the low set on February 5.
Calm Realized Volatility Masks Fragility
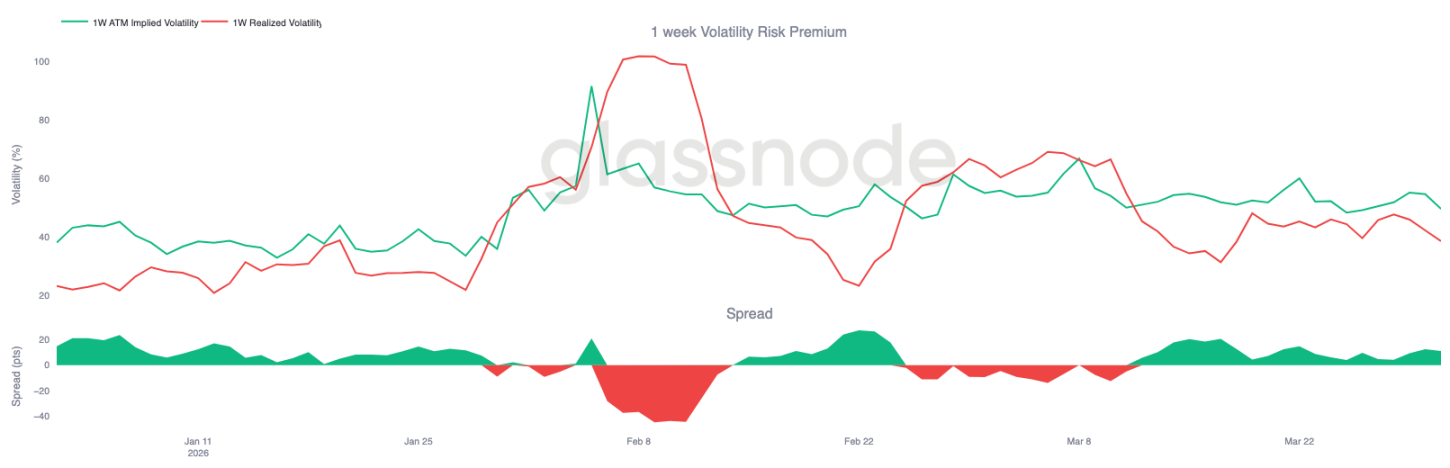
Compounding current instability is the persistent gap between implied and realized volatility. At the front end, one-week realized volatility stands at 38%, while one-week implied volatility is at 49%—an 11-percentage-point spread. This gap has persisted for over three weeks, indicating options consistently price above actual market movement.
At first glance, this suggests apparent stability—since realized volatility stays contained. Yet sustained premium signals participants continue pricing risk despite lacking directional follow-through—pointing to an environment of low market confidence.
When volatility pricing exceeds realized volatility and gamma is negative, even relatively small selling pressure can amplify price moves—because markets rapidly adjust from a compressed pricing base with limited capacity to absorb flow.
Conclusion
Bitcoin remains locked in a broad $60,000–$70,000 range. The market shows early stabilization signs—but lacks sufficient momentum for a decisive breakout in either direction. On-chain conditions still reflect repair-in-progress: underwater supply remains elevated, and long-term holder capitulation has yet to meaningfully cool. Meanwhile, spot demand shows improving signals—indicating sellers no longer fully dominate the market.
Off-chain, the picture is similarly balanced. Corporate treasury demand has narrowed sharply; perpetual leverage has reset; implied volatility has softened; and market maker positioning has stabilized. Collectively, these signals point to an environment no longer under acute stress—but still searching for stronger market conviction.
For now, Bitcoin appears to be undergoing a redistribution phase—not breaking clearly into a new trend. Range-bound trading is expected to persist until spot demand expands more substantially—and the overhead supply overhang begins clearing.
Join TechFlow official community to stay tuned
Telegram:https://t.me/TechFlowDaily
X (Twitter):https://x.com/TechFlowPost
X (Twitter) EN:https://x.com/BlockFlow_News
 @glassnode