Bear Market Bottoming Out—Will Bitcoin Test the $83,000 Support Level?
TechFlow Selected TechFlow Selected
Bear Market Bottoming Out—Will Bitcoin Test the $83,000 Support Level?
If prices fail to rebound above the critical breakeven level, recent buyers may face renewed selling pressure.
 Navigating Web3 tides with focused insights
By: Glassnode
Translated by: AididiaoJP, Foresight News
Executive Summary
- Bitcoin’s price remains near its critical on-chain cost basis, with key support levels under pressure. Sustained market confidence is required to prevent further structural deterioration.
- Short-term holders remain psychologically fragile. If price fails to recover above key breakeven thresholds, recent buyers may face renewed selling pressure.
- Overall holder behavior remains conservative, indicating the market is currently in an accumulation phase—not an expansionary uptrend phase.
- Liquidity remains a pivotal variable. Despite declining participation, price has held steady; however, sustained upside breakthroughs require follow-on buying interest.
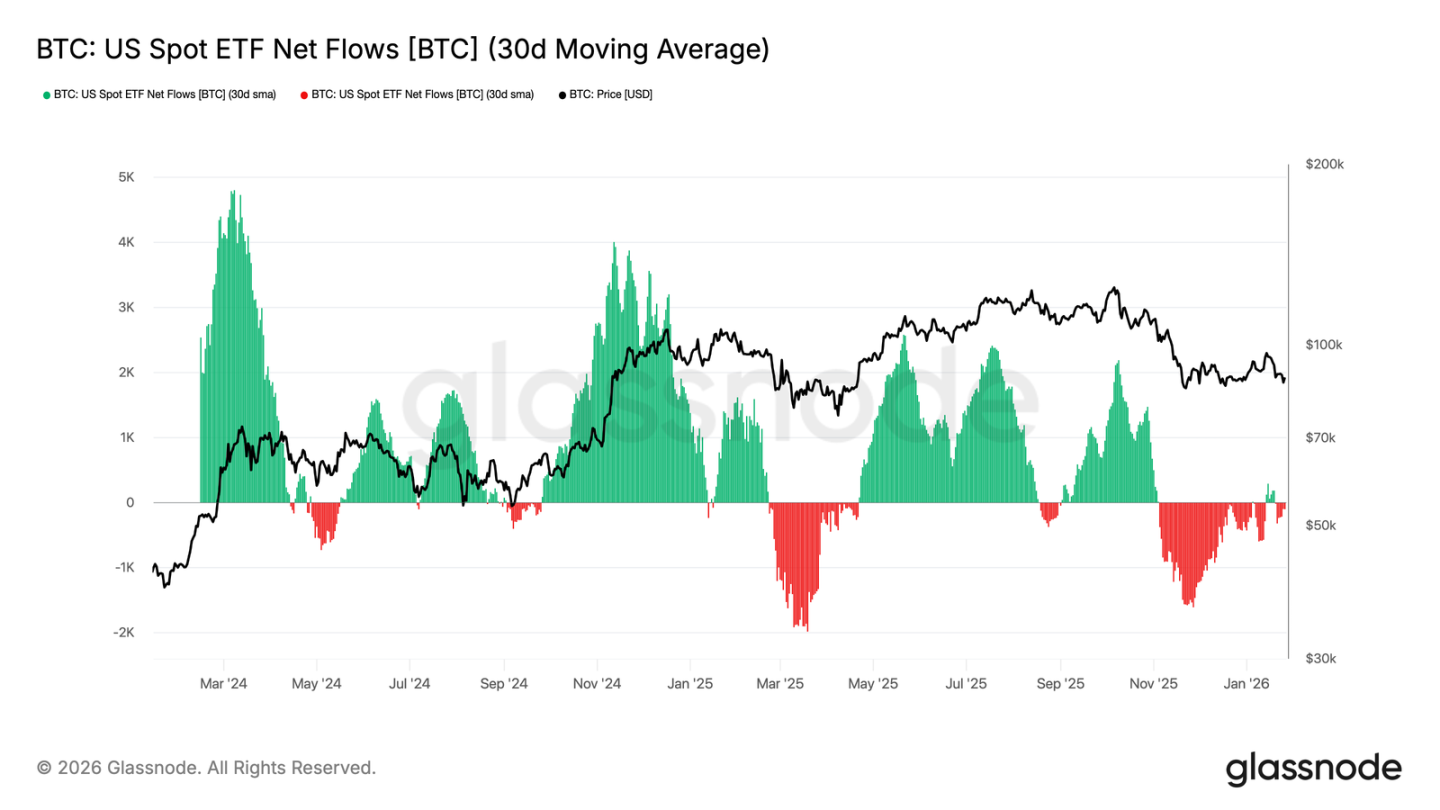
- Spot ETF fund flows have stabilized. After prolonged outflows, the 30-day average net flow has returned to near-neutral levels, easing mechanical selling pressure.
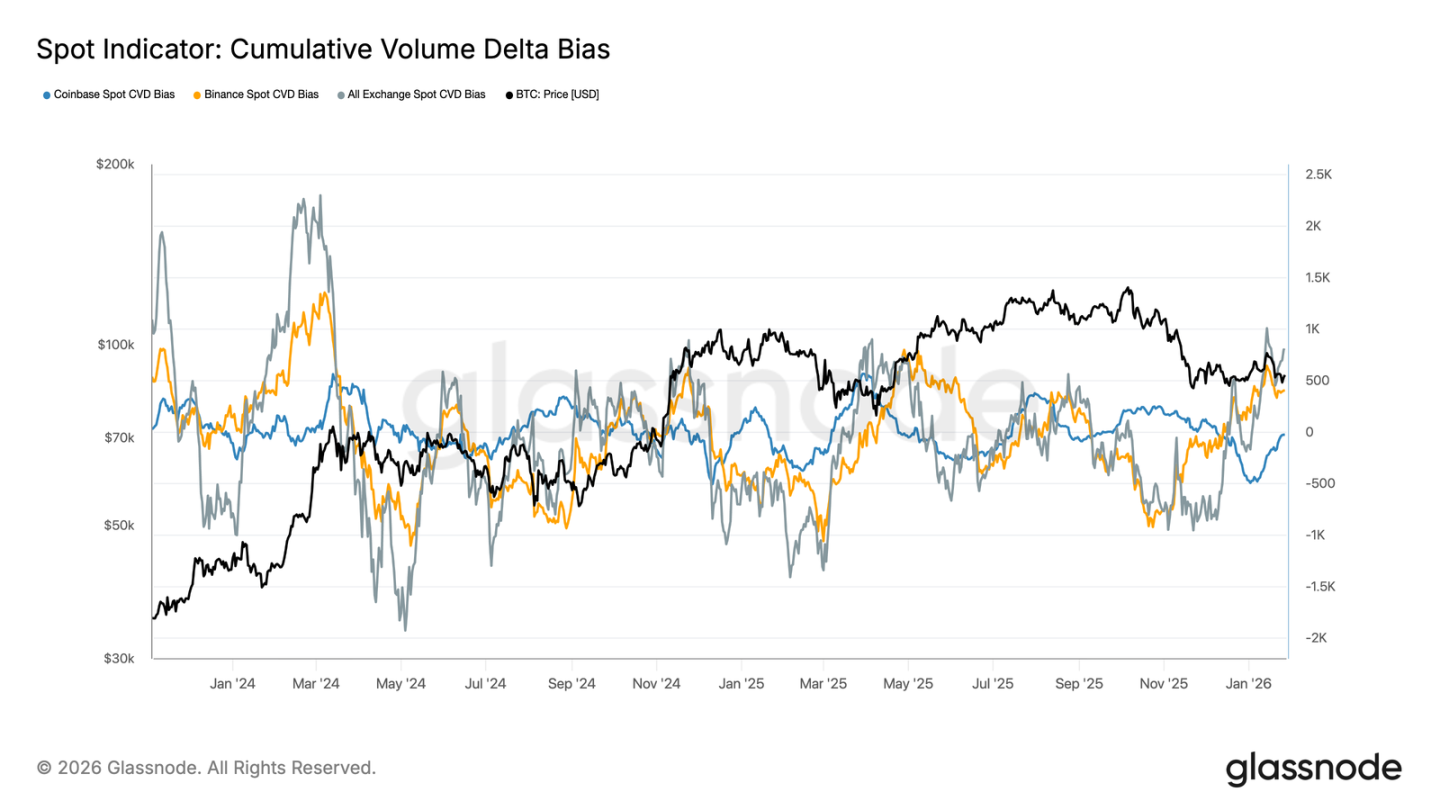
- Spot CVD (Cumulative Volume Delta) across major exchanges shows improving sentiment—led by Binance—indicating marginal buying pressure is returning. Coinbase remains relatively stable.
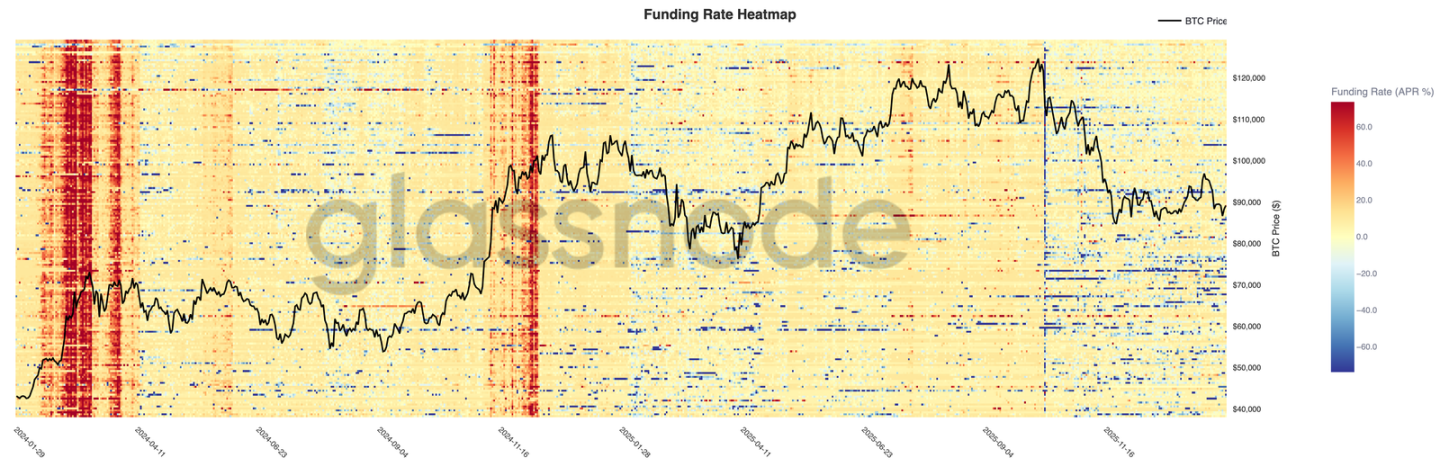
- Perpetual futures leverage remains low, and funding rates are broadly neutral. Speculative positions remain cautious and prone to liquidation amid volatility.
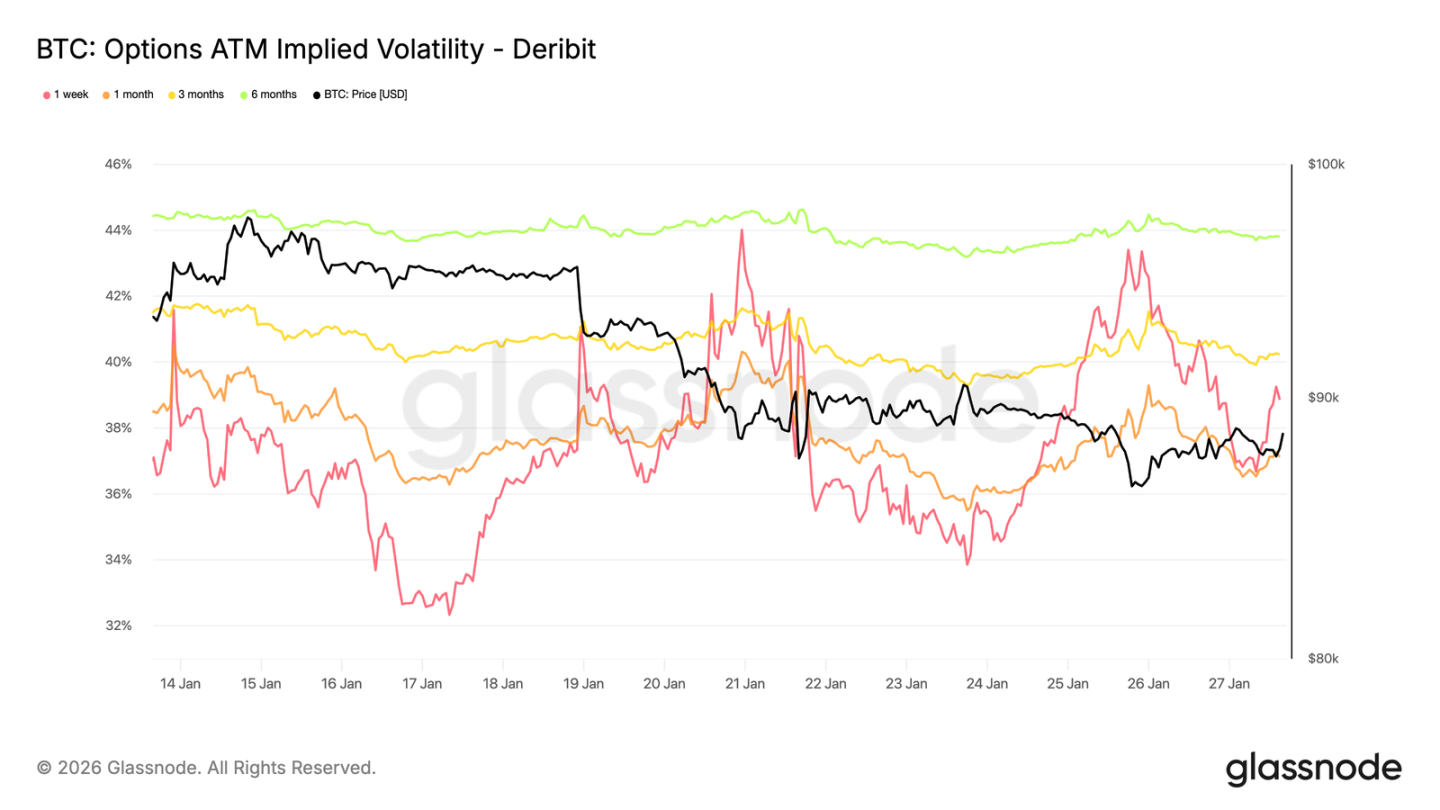
- The options market is shifting toward downside protection: put skew has increased, short-term implied volatility has risen, and dealer gamma has turned negative—heightening price sensitivity to downward moves.
On-Chain Insights
Renewed Weakness
After failing to sustain price above the short-term holder cost basis, the market has entered a modest correction.
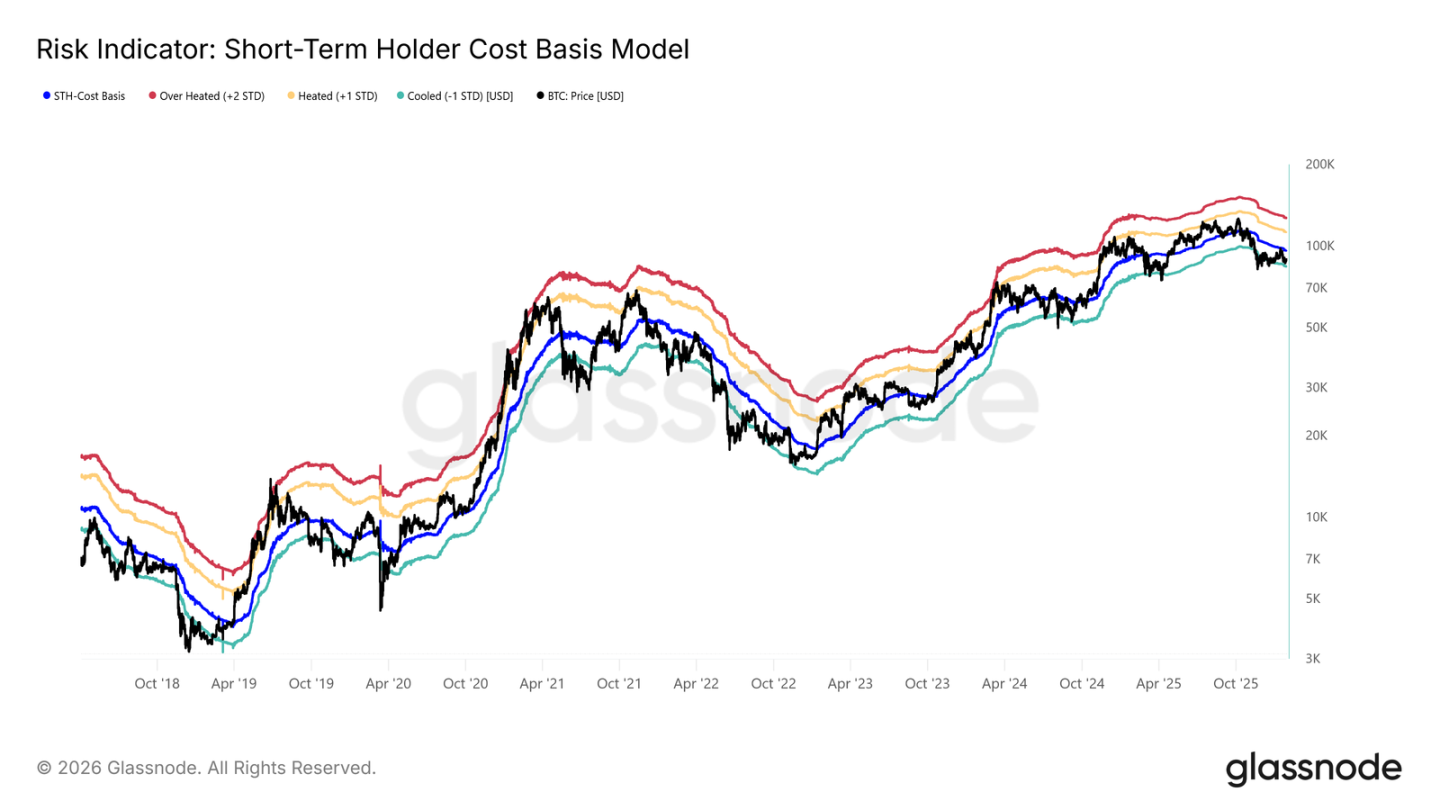
Price now trades below the critical bull/bear threshold of $96,500—a structure highly reminiscent of Q1 2022 and Q2 2018.
As shown in the chart, the lower bound of the current consolidation range (–1 standard deviation) sits at $83,400. This represents a critical near-term support level; a break below could trigger a deeper correction toward the true market mean of $80,700.
Sensitivity at Support Levels
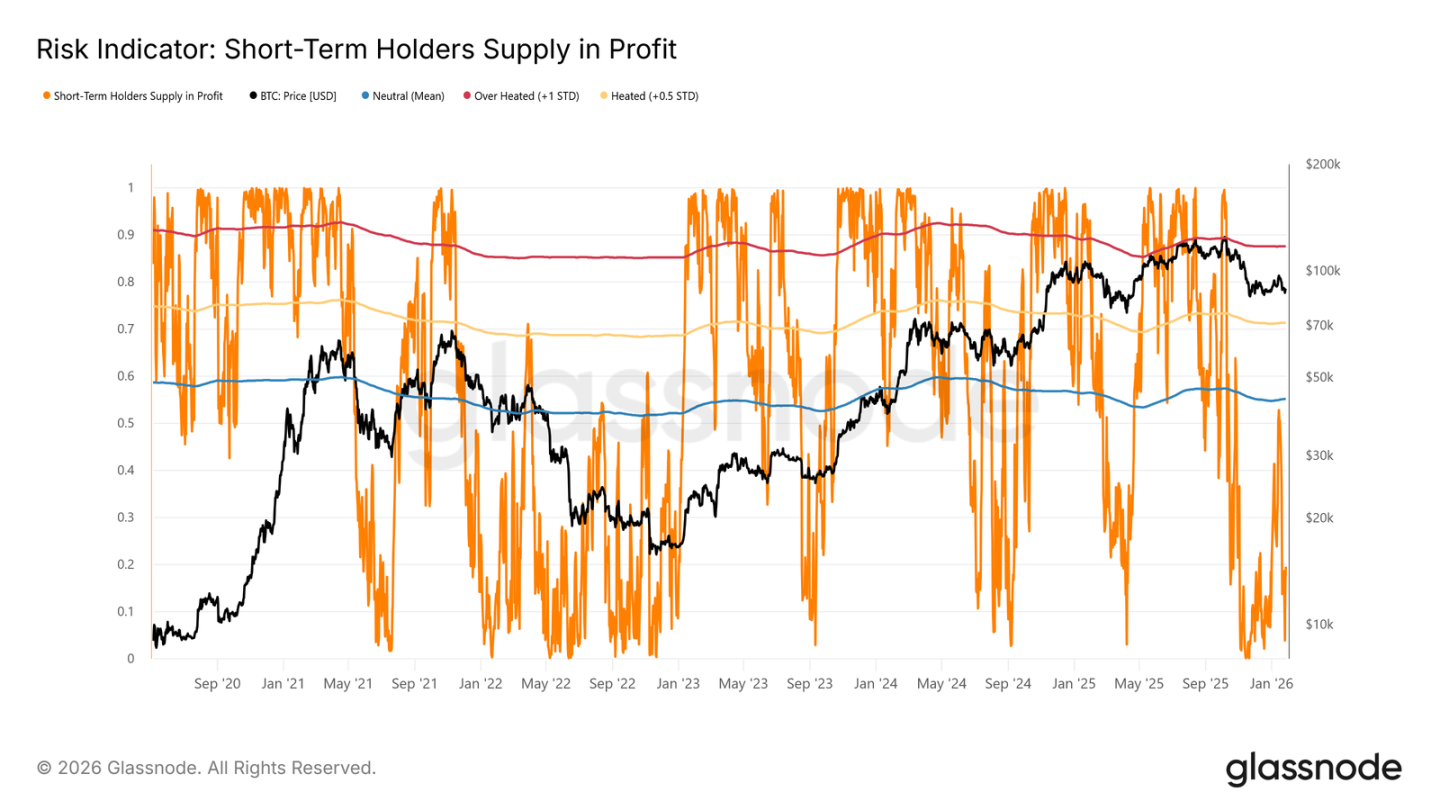
Market sensitivity to both the lower bound of the short-term holder cost basis and the true market mean stems from the high proportion of recently acquired, underwater coins. Historically, short-term holders—who tend to be price-sensitive—have been more likely to sell at a loss, thereby amplifying selling pressure.
Thus, these price levels represent the final line of defense against a slide into a deep bear market akin to 2022–2023.
Currently, the share of underwater coins held by short-term holders has fallen to 19.5%, well below the neutral threshold of 55%. While downside risk persists, large-scale panic selling by short-term holders has not yet materialized.
Liquidity Is Key
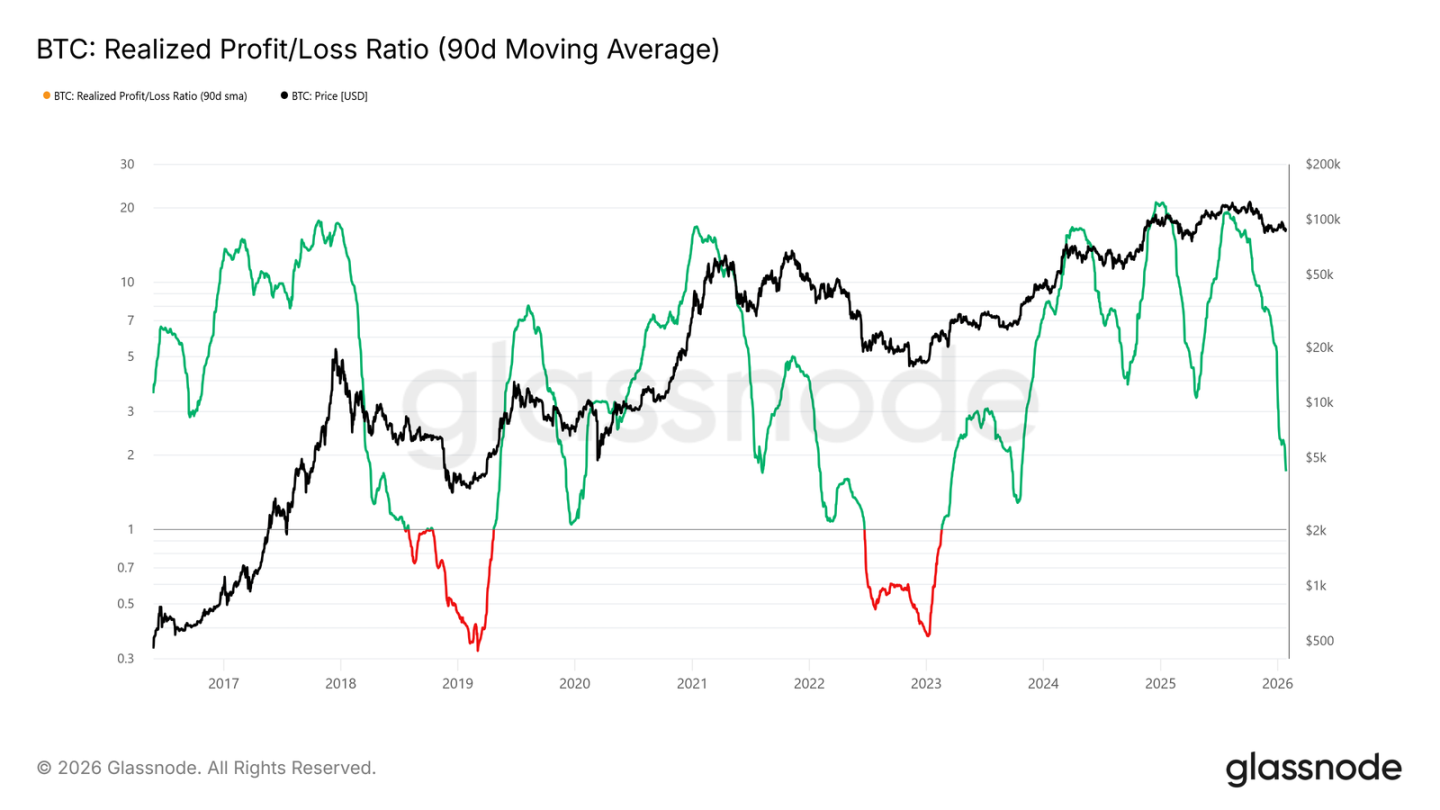
Given the importance of defending the critical support zone between $80,700 and $83,400, liquidity conditions are now front and center. Any meaningful shift toward a sustainable rebound should be visible in liquidity-sensitive metrics such as the “Realized Profit/Loss Ratio (90-day moving average).”
Historically—including during cyclical rebounds over the past two years—robust upward phases required this metric to rise and hold near 5, signaling fresh capital re-entering the market.
Supply Under Pressure
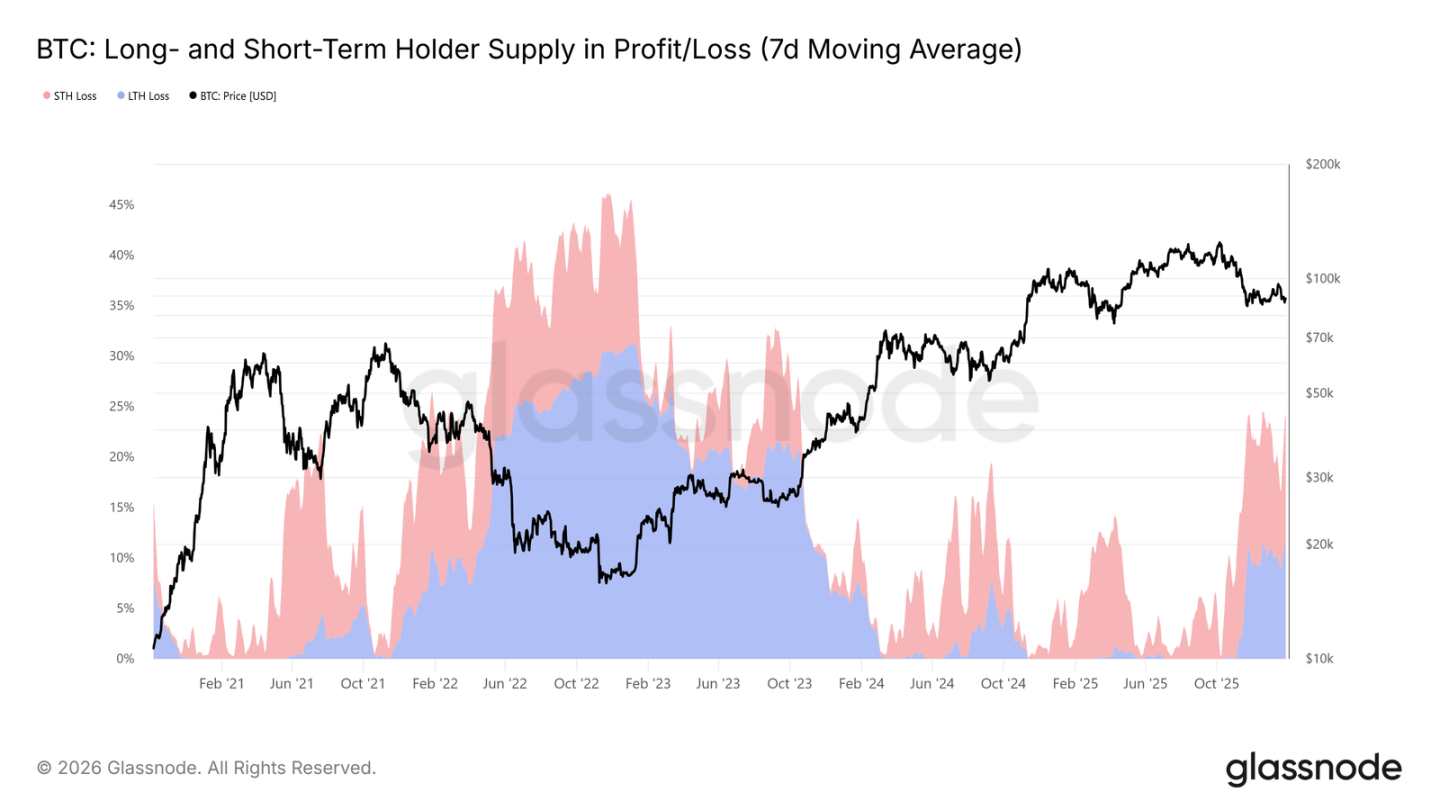
Another core on-chain indicator shaping medium-term market structure is “Profit/Loss Supply by Long/Short-Term Holders.” This metric shows over 22% of circulating supply is currently underwater—a dynamic consistent with Q1 2022 and Q2 2018.
As top-of-cycle purchases gradually mature into long-term holdings—and investors continue holding coins acquired during prior rallies—the share of underwater coins held by long-term holders rises over time.
These steadfast holders are now facing dual pressure: time and price. A breach below the aforementioned critical support levels (short-term holder cost basis lower bound and true market mean) could prompt long-term holders to cut losses, elevating medium-term downside risk.
Off-Chain Insights
Slowing Spot ETF Outflows
Net fund flows for U.S. spot Bitcoin ETFs have returned to equilibrium. After extended net outflows, the 30-day moving average has approached zero—signaling a significant reduction in structural selling pressure from ETFs.
Notably, the recent rebound in inflows falls far short of the accumulation surges seen in early and late 2024. This suggests institutional demand remains cautious rather than aggressively bullish. With inflow momentum waning, BTC’s ability to hold elevated price levels appears increasingly reliant on conviction among spot holders—not new ETF-driven demand.
A return to sustained net inflows would bolster the continuation of the uptrend. Conversely, failure to achieve this may result in continued consolidation, as the market lacks the external liquidity injection that previously fueled rallies.
Improving Spot Fund Flows
Spot CVD bias across major exchanges is rising, signaling the return of buying pressure after an extended period of weakness. Binance leads the rebound, rapidly recovering from deeply negative readings; aggregate CVD bias across all exchanges has also turned positive.
Coinbase’s CVD bias, however, continues to oscillate within its range—suggesting relatively stable domestic spot demand, but less vigor compared to offshore markets. This divergence indicates marginal buying pressure is returning, driven primarily by global risk appetite—not decisive U.S.-based buying.
If buyer dominance persists, it will support further price stabilization or even upside. Yet, in this cycle, markets have repeatedly failed to sustain positive CVD trends—making the continuity of subsequent buying pressure the decisive factor.
Perpetual Futures Market Remains Calm
Funding rates across major perpetual futures exchanges remain largely neutral despite notable price volatility—indicating leveraged positions have been largely unwound and long/short positioning is relatively balanced, with neither side consistently paying high funding fees.
It is worth noting that brief spikes in positive funding rates still occur during local rallies, reflecting transient long-side chasing behavior. However, these spikes fail to persist—reinforcing the view that speculative sentiment remains fragile and easily reversed.
With compressed and unbalanced funding rates, the market grows increasingly dependent on spot demand to drive trends. Sustained positive funding rates would signal leveraged position rebuilding and renewed risk appetite; persistently neutral rates suggest the market may enter a slow, choppy consolidation phase.
Implied Volatility: Short-Term Rise, Long-Term Stability
Over the past weekend, short-term at-the-money implied volatility surged sharply—reflecting heightened market sensitivity to the broader short-term risk environment (not just crypto-specific risks).
This shift coincides with rising geopolitical uncertainty and intensifying macro risks—factors that typically impact the front end of the volatility curve first. Re-pricing is concentrated in short-dated options, while long-dated option volatility remains relatively stable.
This suggests the market is reassessing short-term uncertainty—not altering long-term risk expectations—and reflects an external risk response, with no signs of internal stress or structural imbalance.
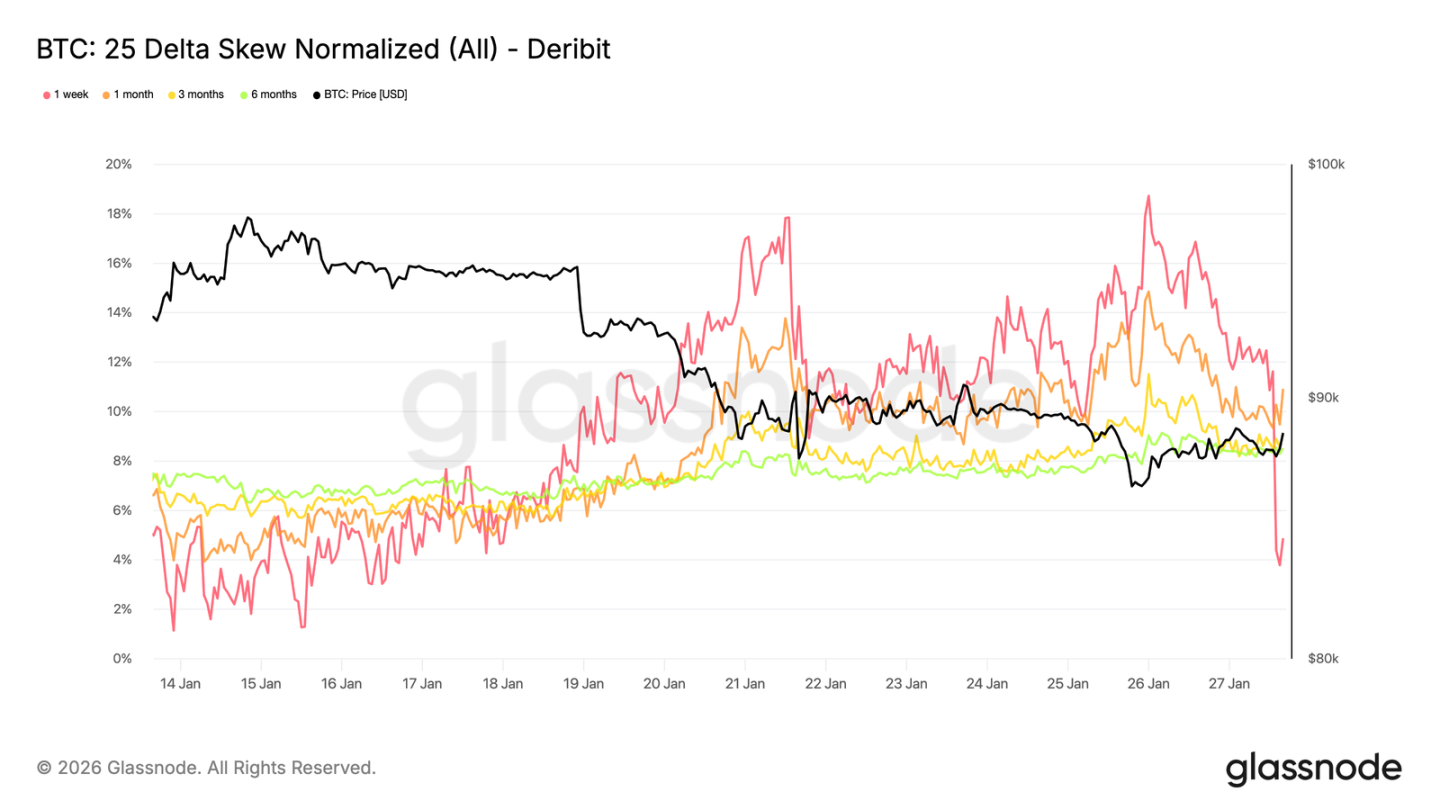
25-Delta Skew: Bearish Sentiment Spreading
As volatility adjusts, skew provides a clearer window into market sentiment. 25-Delta skew across all maturities has turned bearish—indicating relatively stronger demand for downside protection.
This shift implies growing caution in medium-to-longer term outlooks, even as spot price action remains orderly. The adjustment is gradual, suggesting deliberate hedging—not panic-driven put buying.
Short-term skew (especially 1-week) exhibits greater volatility, while the overall curve has shifted only slightly bearish week-on-week. This divergence signals caution across timeframes—but not extreme tension.
Downside Implied Volatility: Protection in Place, Collapse Not Priced In
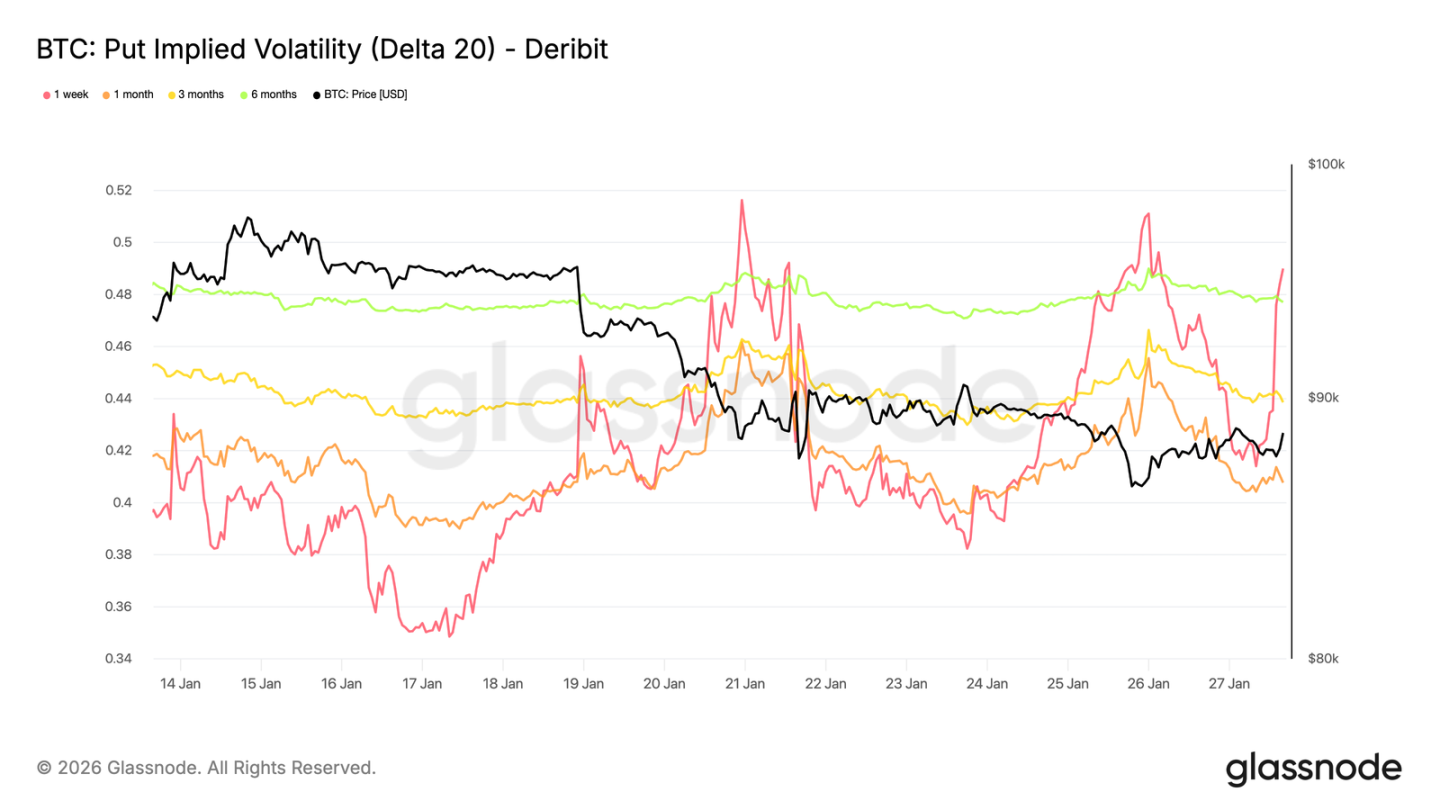
Interpolated delta-specific implied volatilities allow for smooth observation of the volatility surface across maturities. Here, we focus on 20-Delta puts, which clearly reflect long-term downside protection demand.
Despite the bearish skew, downside implied volatility remains relatively muted across all tenors. Even for options expiring at year-end 2026, the market prices only modest downside risk.
This reveals a critical nuance: participants are willing to pay more for downside protection than for upside calls—but do not anticipate a sharp collapse. Market sentiment is clearly defensive, yet expectations for downside magnitude remain limited.
This aligns with the recent spot market’s “orderly decline—not panic selling” character.
Put Volume Leads
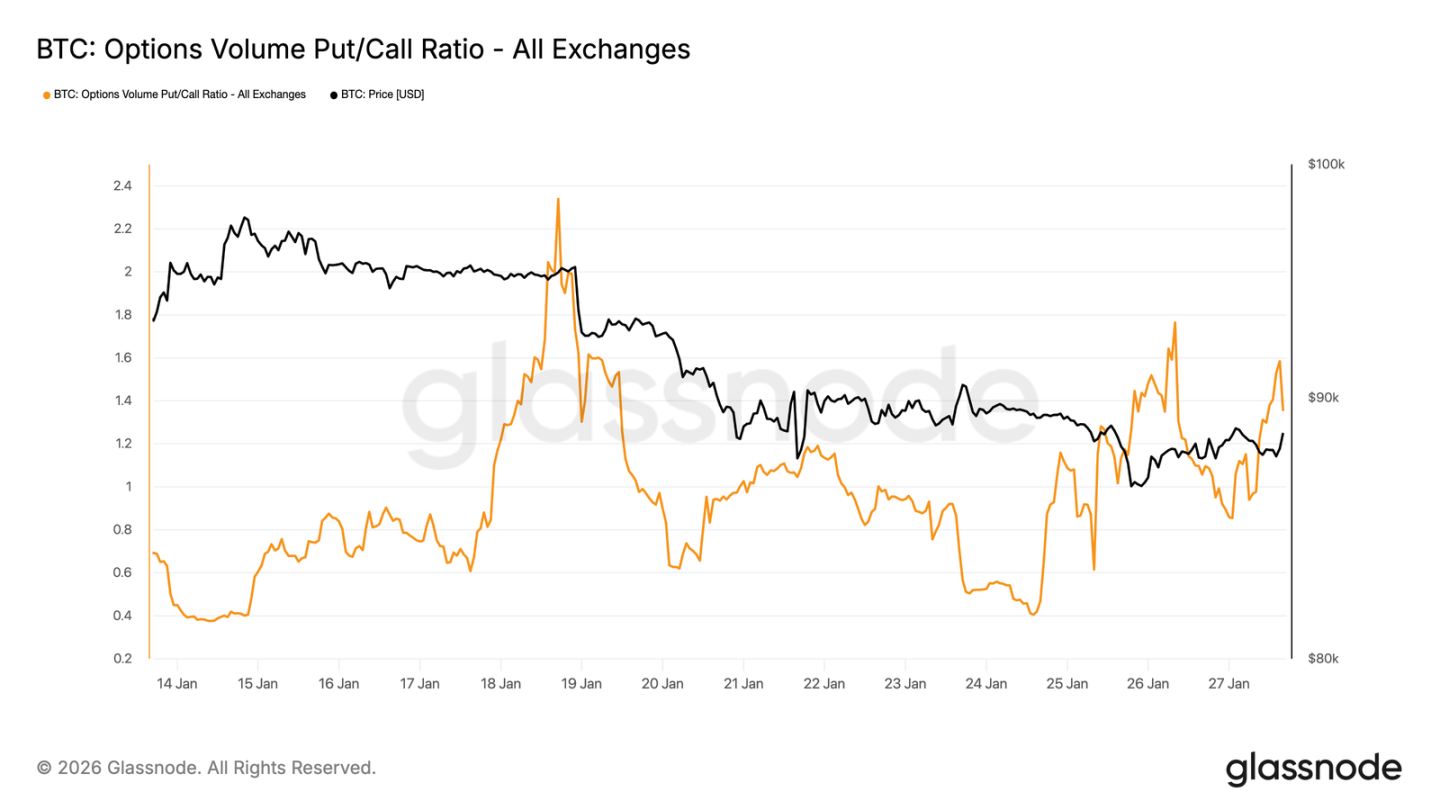
Option market put/call volume ratios confirm this defensive posture. Put volume has increased relative to call volume—but without the explosive surge typically associated with panic hedging.
Volume is active yet orderly, suggesting traders are adjusting positions methodically—not reacting emotionally. This aligns with a cautious market tone that acknowledges downside risk while managing declines in a controlled manner.
Dealer Gamma: Below $90K Favors Downside
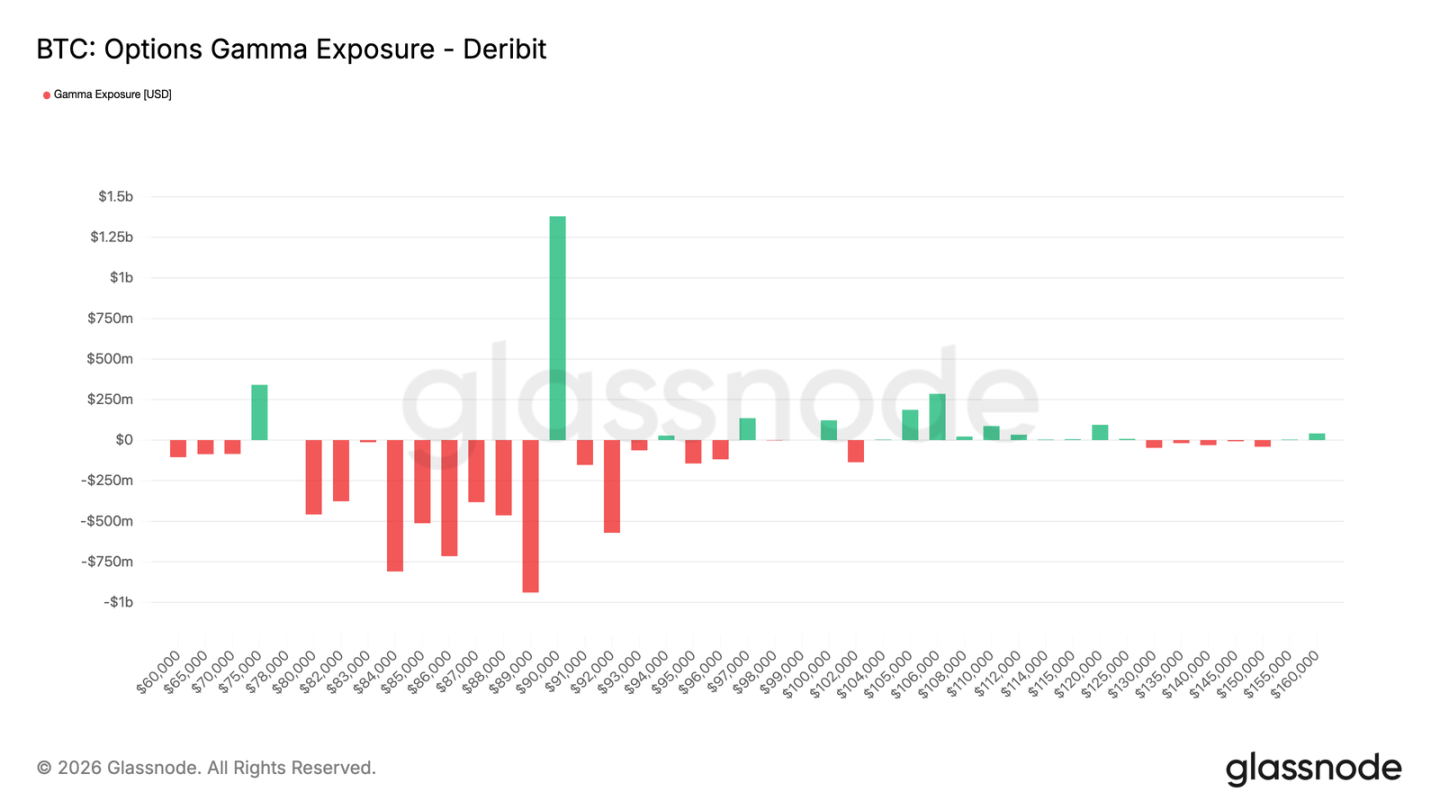
Dealer gamma exposure reveals an important structural feature of the current market. Dealers hold short gamma across a broad range—from $90,000 down to ~$75,000—a zone that coincides precisely with a critical support band.
In a short gamma environment, dealer hedging behavior amplifies price moves. As spot falls, dealers hedge their short put risk by selling futures or spot—mechanically exacerbating the decline. This explains why corrections can deepen even absent heavy selling.
Meanwhile, a notable concentration of long gamma persists near $90,000. This means breaking above that level requires sustained, strong buying—not sporadic bids.
Until those conditions emerge, market structure favors slow, controlled downside—not rapid reversal.
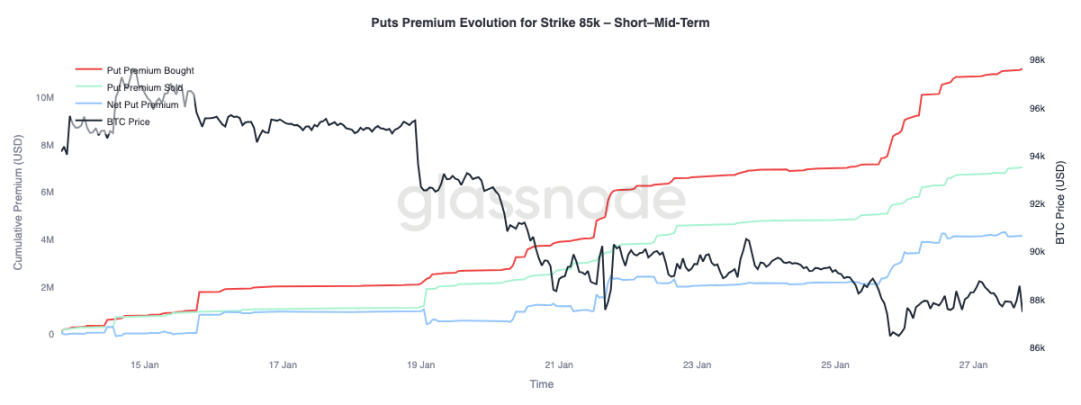
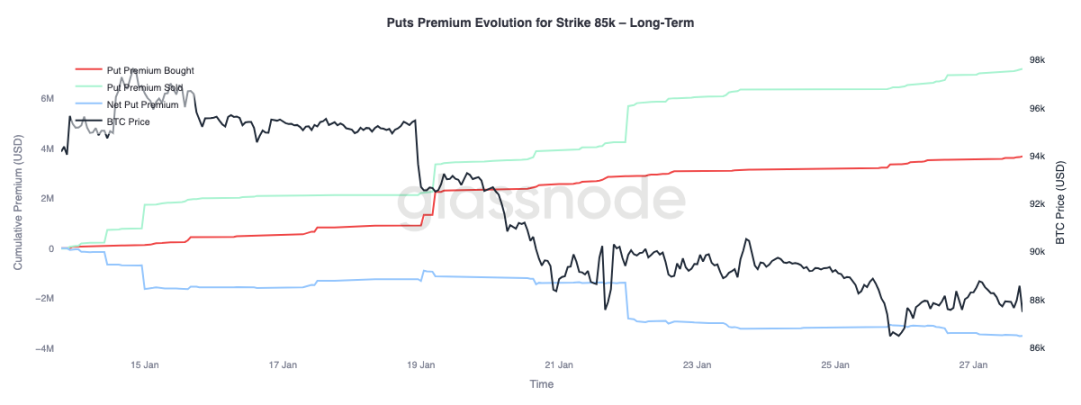
Put Premium: Buy Short-Term, Sell Long-Term
Focusing on put premium changes for the $85,000 strike reveals a maturity-based divergence: net premium buying dominates for options maturing within three months—pushing net premium higher—while options beyond three months show net premium selling.
This reflects the market’s reaction to BTC’s move from the $90,000 mid-range down to the $80,000 upper range: hedging near-term downside risk, while simultaneously selling longer-dated downside protection. This structure signals short-term caution—not worsening long-term risk expectations.
Conclusion
Bitcoin continues consolidating near critical on-chain price levels, with a delicate balance between holder conviction and marginal demand. Short-term holders remain vulnerable—if support breaks, renewed selling pressure could emerge.
However, overall fund flows have stabilized: ETF selling pressure has eased, and spot positioning—particularly in offshore markets—shows early signs of improvement, suggesting buying interest is reviving. Meanwhile, derivatives markets remain subdued; neutral funding rates indicate low leverage and reduced dependence on speculative capital.
Options positioning reinforces market caution: skew has turned bearish, short-term protection demand has risen, and negative dealer gamma increases the risk of amplified downside volatility.
The path forward hinges on whether demand from spot and ETF channels can sustain. If fund flows resume sustained net inflows and spot buying strengthens, the trend may continue. Conversely, if market fragility persists and downside hedging intensifies, further consolidation or a deeper correction becomes more likely.
Join TechFlow official community to stay tuned
Telegram:https://t.me/TechFlowDaily
X (Twitter):https://x.com/TechFlowPost
X (Twitter) EN:https://x.com/BlockFlow_News
 @glassnode