At the Crossroads of Bear and Bull, Could Bitcoin Hit $100K at the Start of the New Year?
TechFlow Selected TechFlow Selected
At the Crossroads of Bear and Bull, Could Bitcoin Hit $100K at the Start of the New Year?
The market is gradually shifting from a mode dominated by defensive selling to a phase of selectively increasing risk exposure and rebuilding participation.
 Navigating Web3 tides with focused insights
Written by: Glassnode
Translated by: AididiaoJP, Foresight News
After a significant year-end rebalancing, Bitcoin is entering 2026 with a clearer market structure. Current profit-taking pressure has eased, and risk appetite is recovering moderately. However, to establish a sustained upward trend, it remains critical for prices to firmly hold and reclaim key cost baselines.
Summary
Following a deep correction and months of consolidation, Bitcoin has officially entered 2026. On-chain data indicates that profit realization pressure has notably subsided, and the market structure shows initial signs of stabilization near the lower end of the range.
Although selling pressure has diminished, substantial unrealized losses from earlier positions remain stacked above current price levels—mainly concentrated in the upper half of the current trading range—continuing to cap upside potential and highlighting the importance of breaking through key resistance levels to restore an uptrend.
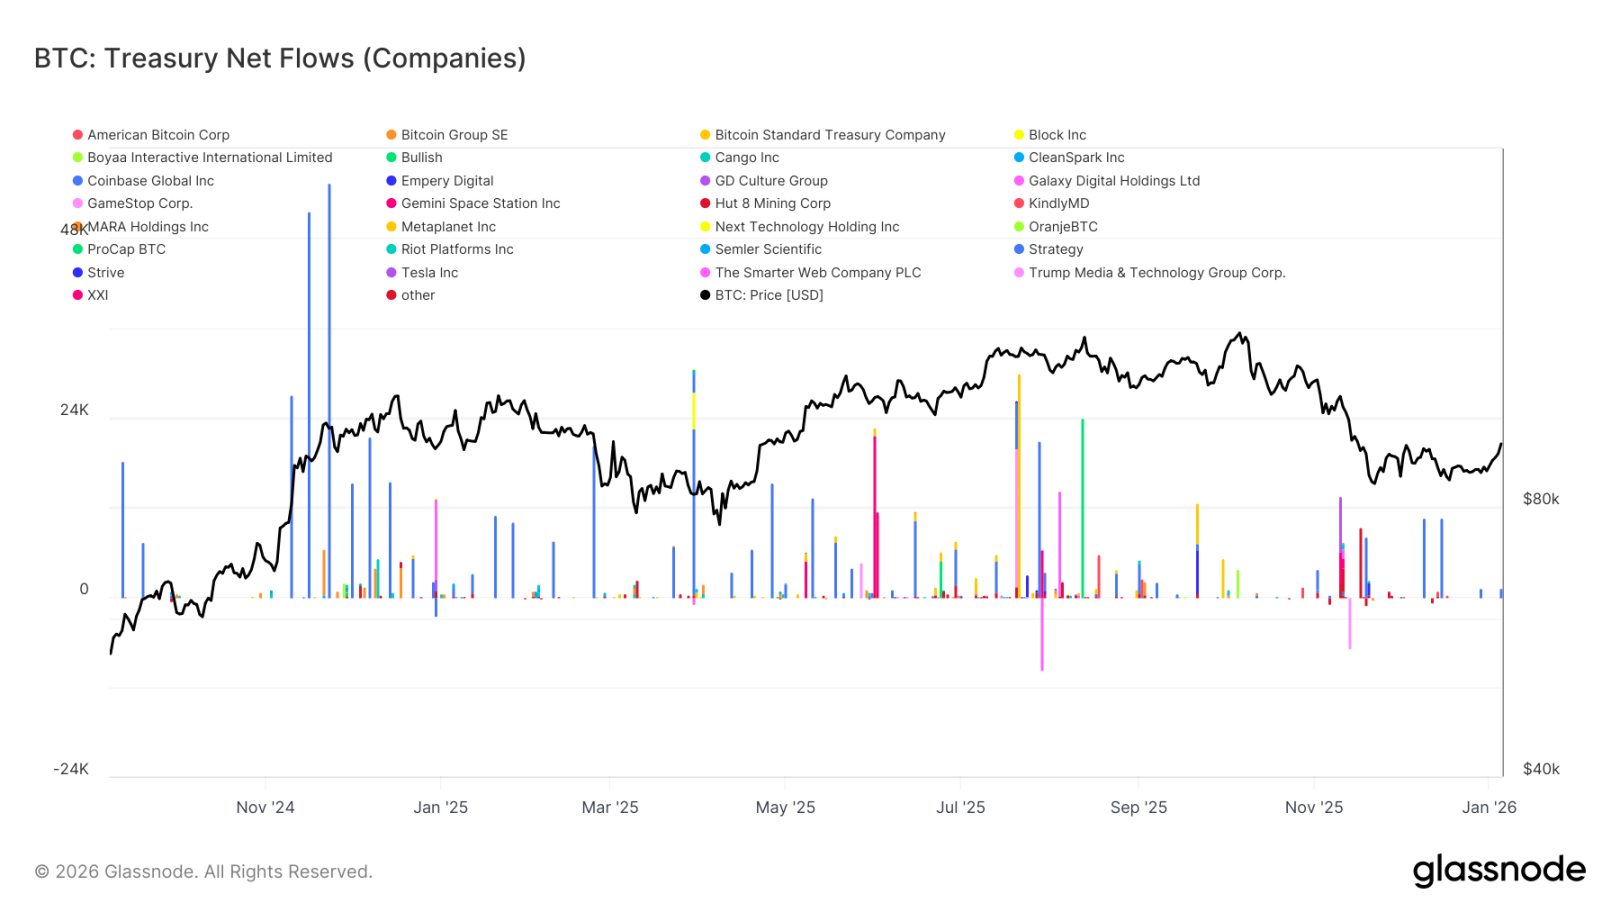
Corporate treasury demand for Bitcoin continues to provide underlying price support, yet this demand remains pulsed rather than continuous or structural.
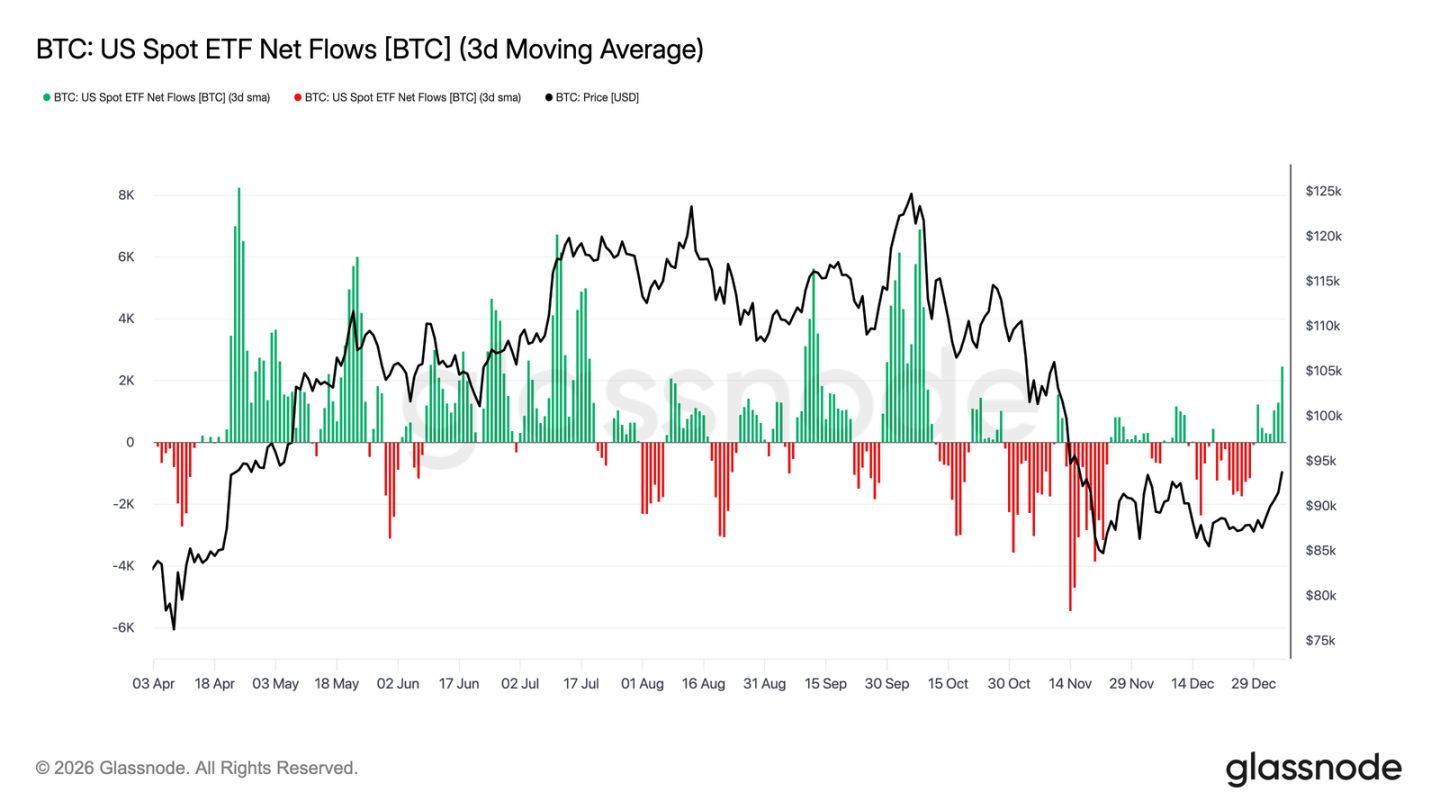
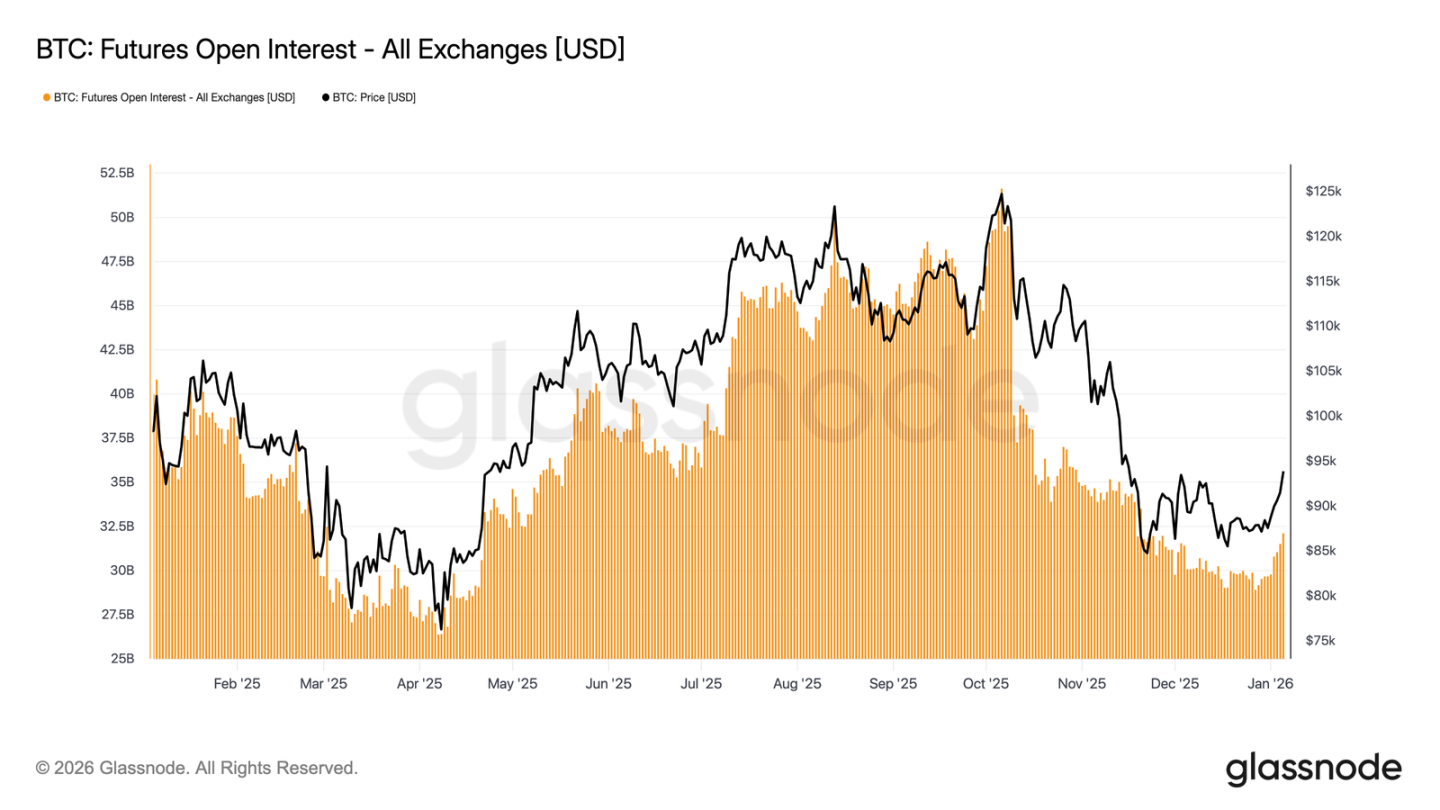
U.S. spot Bitcoin ETF flows, which saw net outflows at the end of 2025, have recently turned positive again. At the same time, open interest in futures markets has stopped declining and started to rebound, indicating institutional investors are re-engaging and derivative market activity is rebuilding.
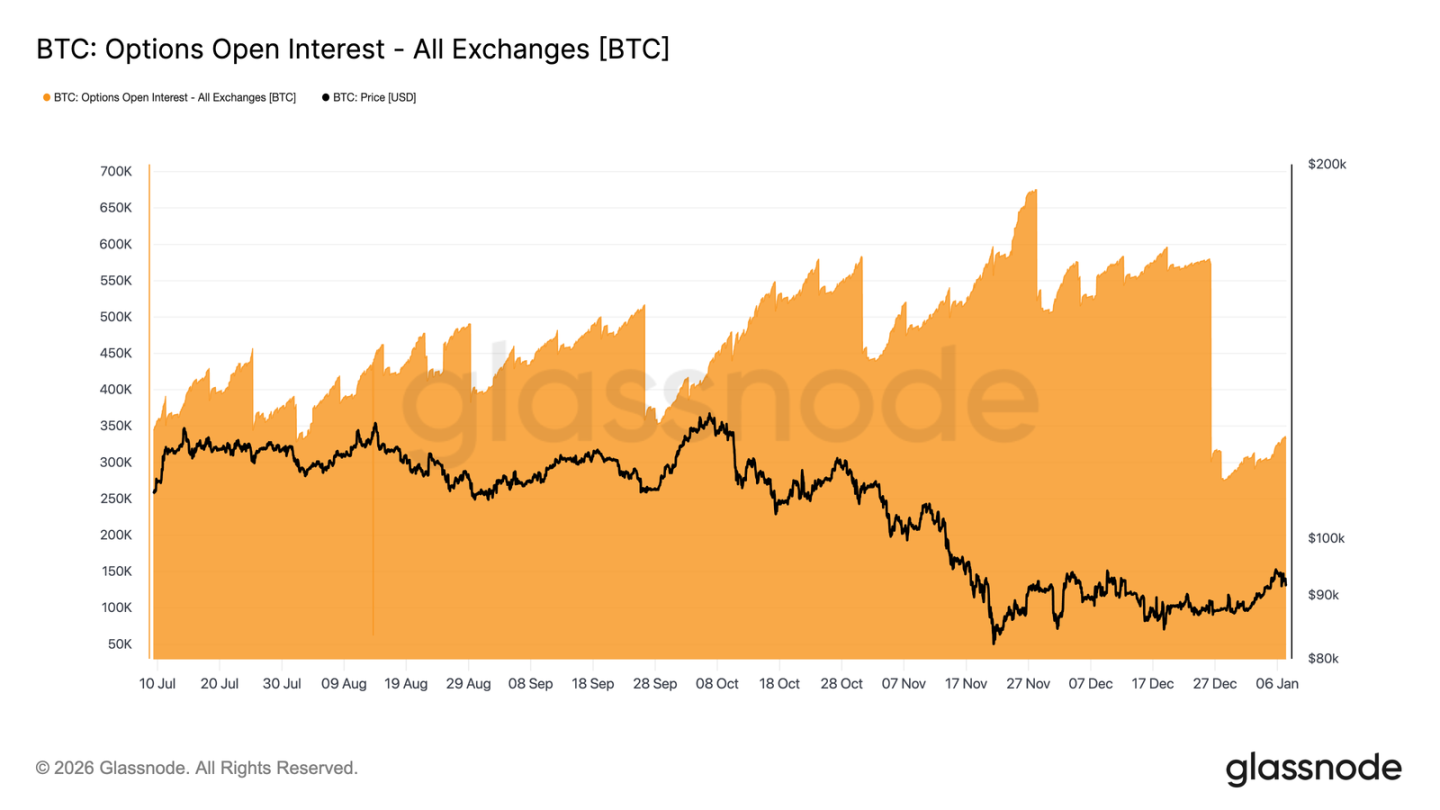
A record-sized options position expired at year-end, with over 45% of outstanding contracts liquidated. This cleared structural hedging constraints from the market, allowing genuine risk appetite to be more clearly reflected in price action.
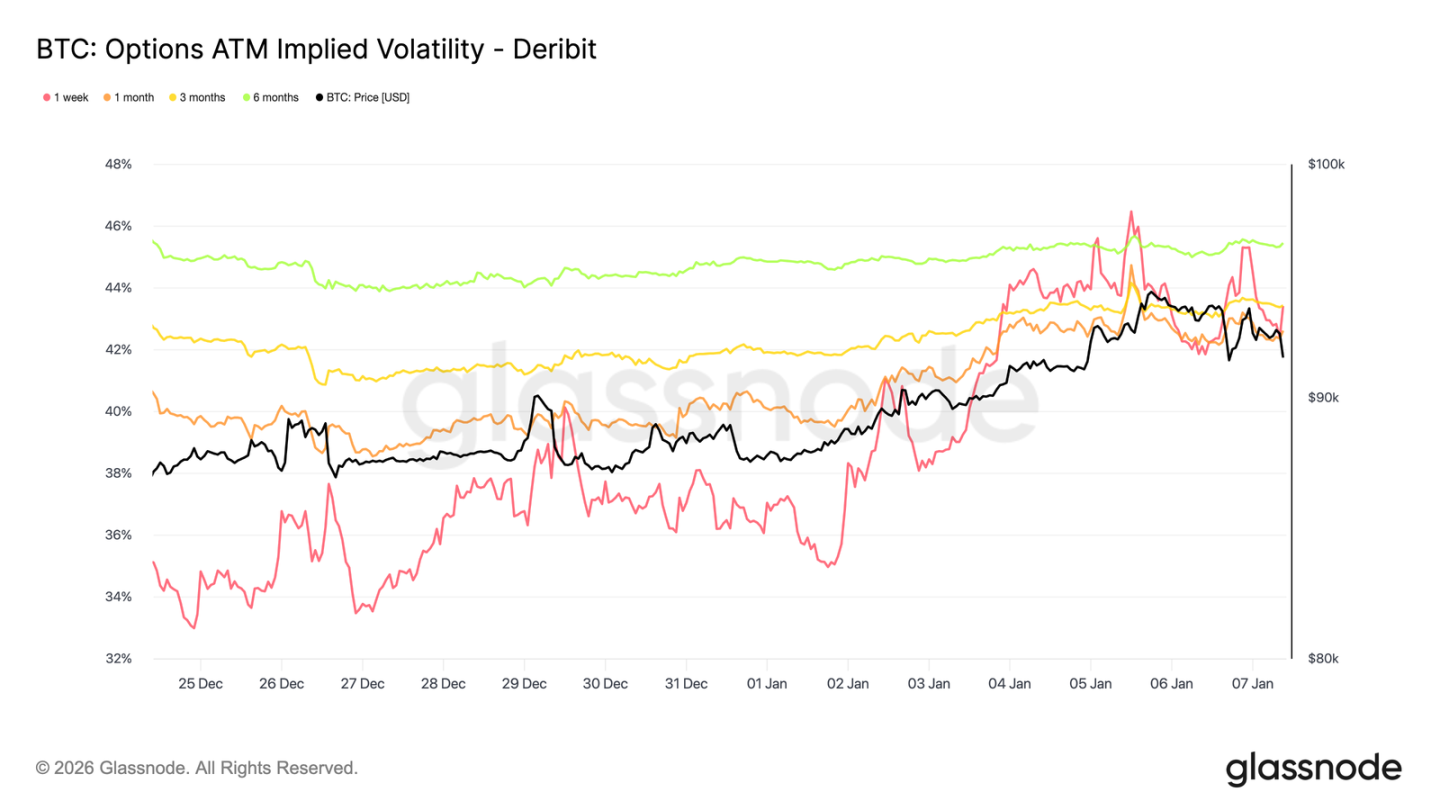
Implied volatility is likely at a cyclical low, with early-year buyer demand gently lifting the volatility curve—though it still remains toward the lower end of the past three-month range.
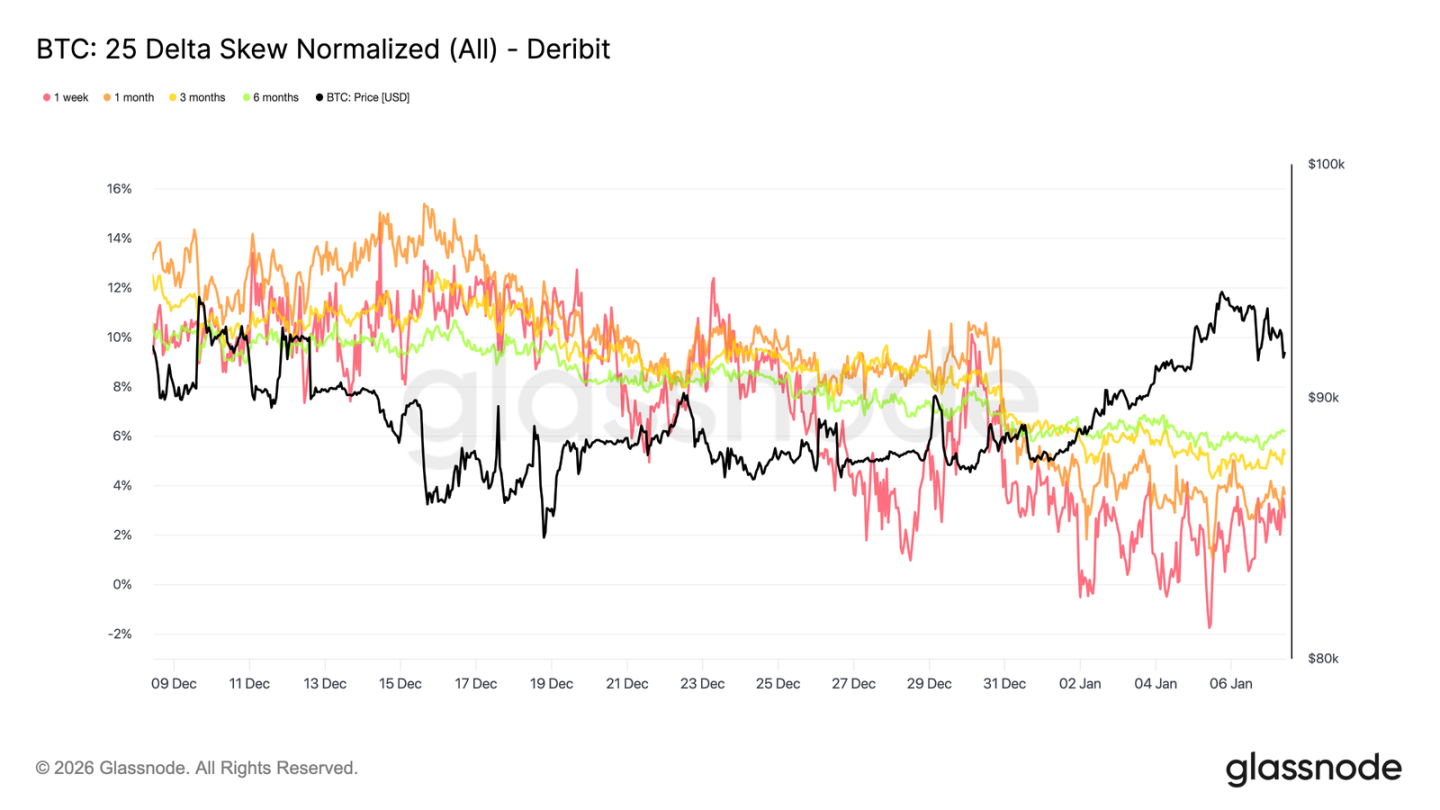
As put option premiums narrow and call option trading increases as a share of volume, market skew continues reverting toward normality. Since the new year, options trading has clearly tilted bullish, signaling investors are shifting from defensive hedging to actively positioning for upside opportunities.
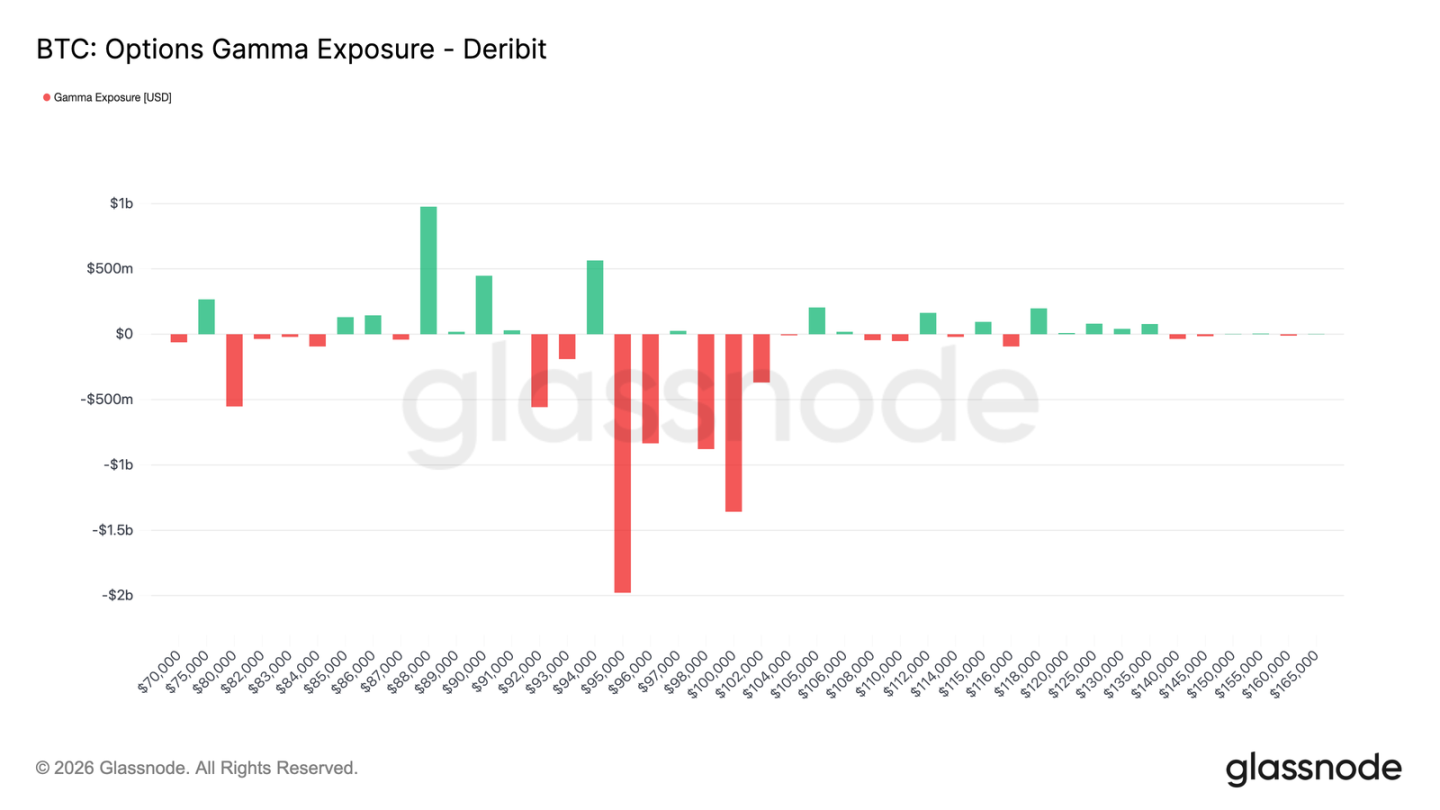
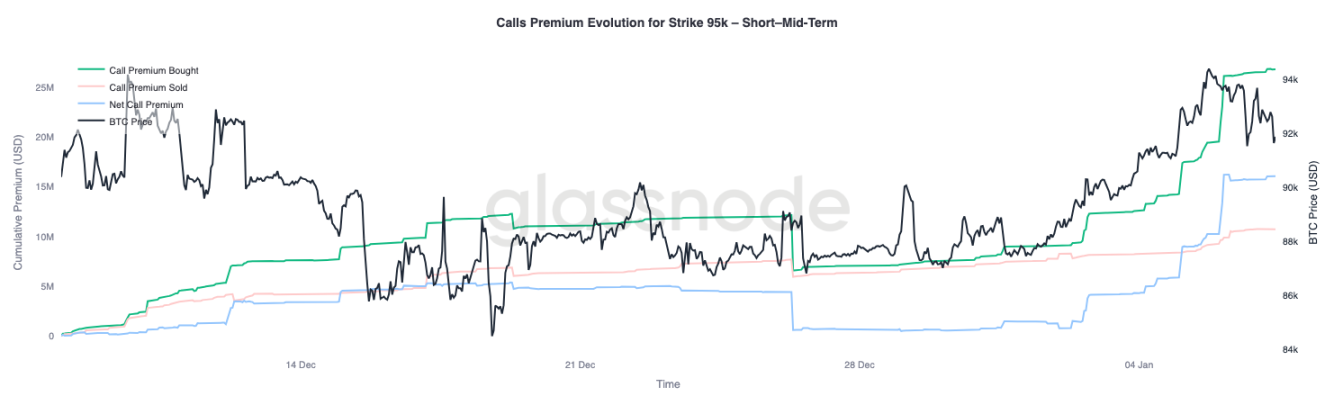
In the $95,000–$104,000 range, market makers have shifted into net short positions, meaning their hedging behavior will passively amplify price gains if prices rise into this zone. Additionally, call option premium behavior around the $95,000 strike suggests long-position holders prefer holding over rushing to take profits.
Overall, the market is gradually transitioning from a defensive deleveraging phase to selective risk accumulation, entering 2026 with a clearer structure and greater elasticity.
On-Chain Insights
Significant Relief in Profit-Taking Pressure
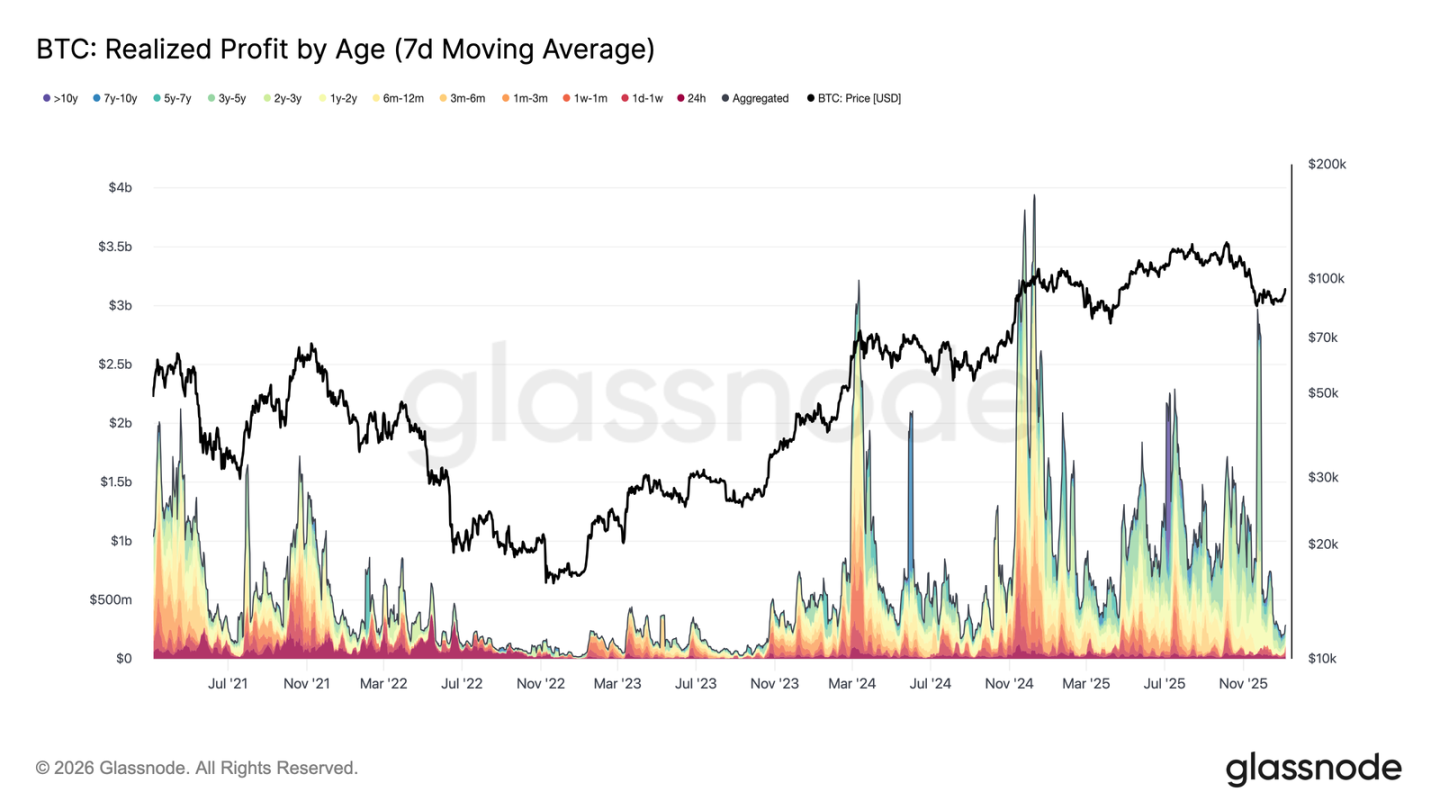
In the first week of 2026, Bitcoin broke out of a multi-week consolidation range near $87,000, rising approximately 8.5% and reaching a high of $94,400. This rally was built upon a marked cooldown in overall realized profit-taking. In late December 2025, the 7-day average realized profit dropped sharply from a fourth-quarter average above $1 billion per day to just $183.8 million.
The decline in realized profit, especially reduced selling pressure from long-term holders, indicates that the primary supply overhang suppressing prices has been released on a cyclical basis. With selling pressure waning, the market has stabilized and regained confidence, enabling a fresh upward move. Thus, the year-start breakout marks effective digestion of profit-taking pressure, opening room for further price appreciation.
Facing Resistance from Above-Level Trapped Supply
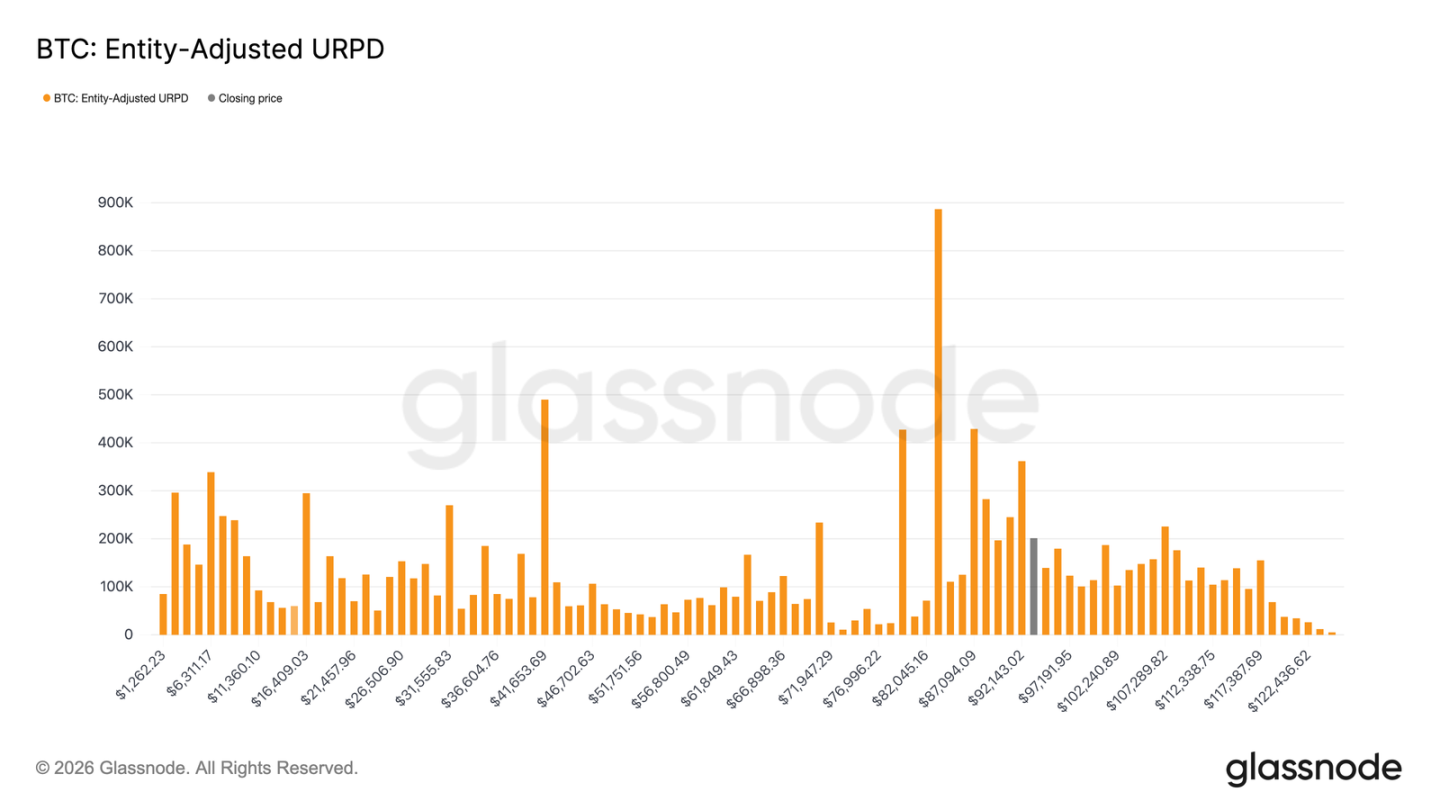
With profit-taking pressure easing, prices are able to advance further—but the current rebound is now entering a supply zone composed of various cost bases. The market has now entered a range dominated by "recent top buyers," whose cost basis is densely clustered between $92,100 and $117,400. These investors bought heavily near prior highs and held through the drop from all-time highs down to around $80,000, only now participating in the recovery phase.
Therefore, as prices return to their cost zone, these investors gain opportunities to break even or exit with small profits, creating natural upward resistance. To truly reignite a bull market, the market will need time and resilience to absorb this overhead supply and push prices meaningfully beyond this region.
Key Recovery Level
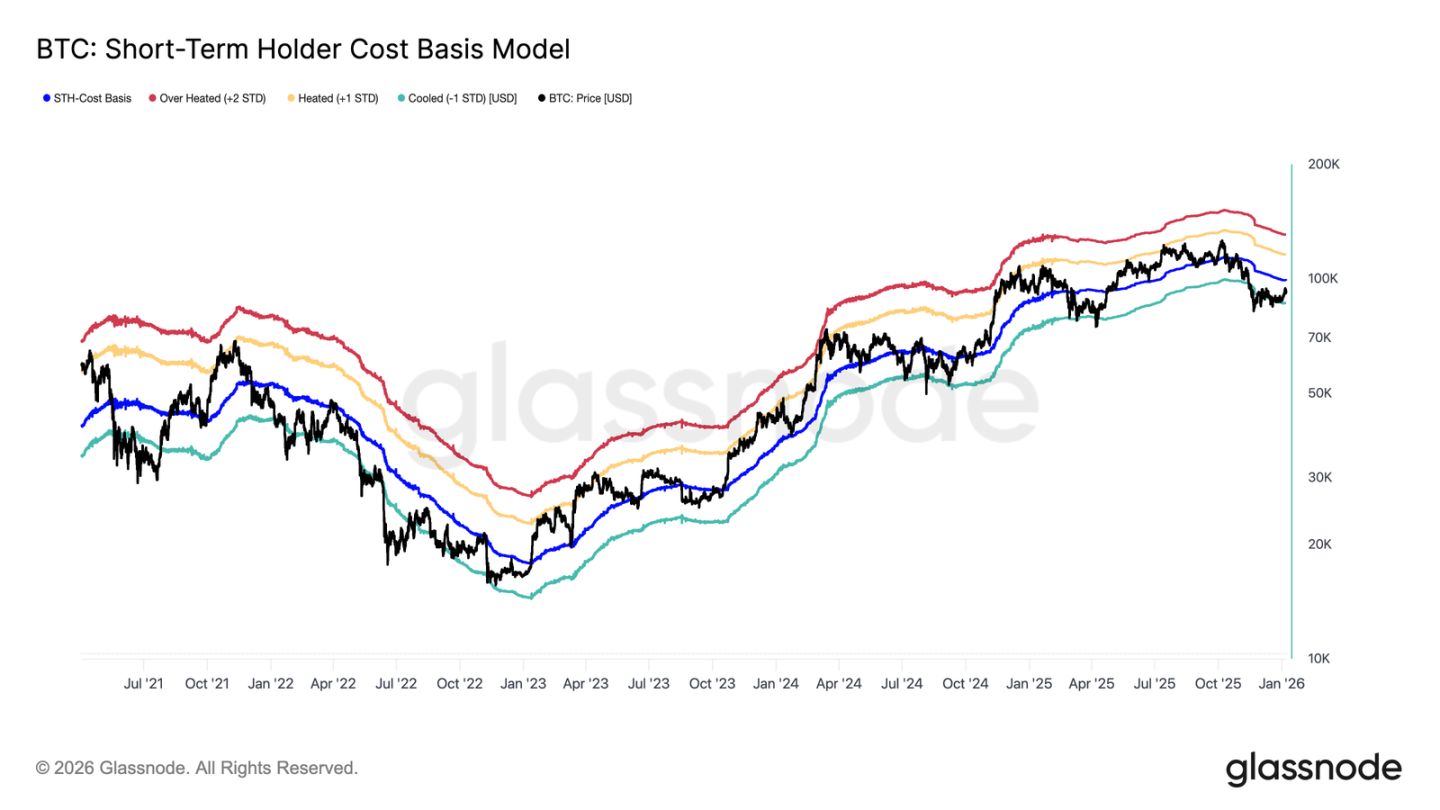
Amid resistance from above-level trapped supply, determining whether the recent rebound can genuinely reverse the prior downtrend and transition into a sustainably demand-driven phase requires reliable price analysis frameworks. The Short-Term Holder (STH) Cost Basis model is particularly important during such transitional periods.
Notably, last December’s fragile market equilibrium formed near the lower band of this model, reflecting weak sentiment and insufficient buyer conviction at the time. The subsequent rebound pushed prices back toward the model's mean level—the STH cost basis at $99,100.
Thus, the first key confirmation signal for market recovery would be sustained trading above the STH cost basis, indicating renewed confidence among new entrants and a potential shift toward a positive trend.
Crossroads of Profit and Loss
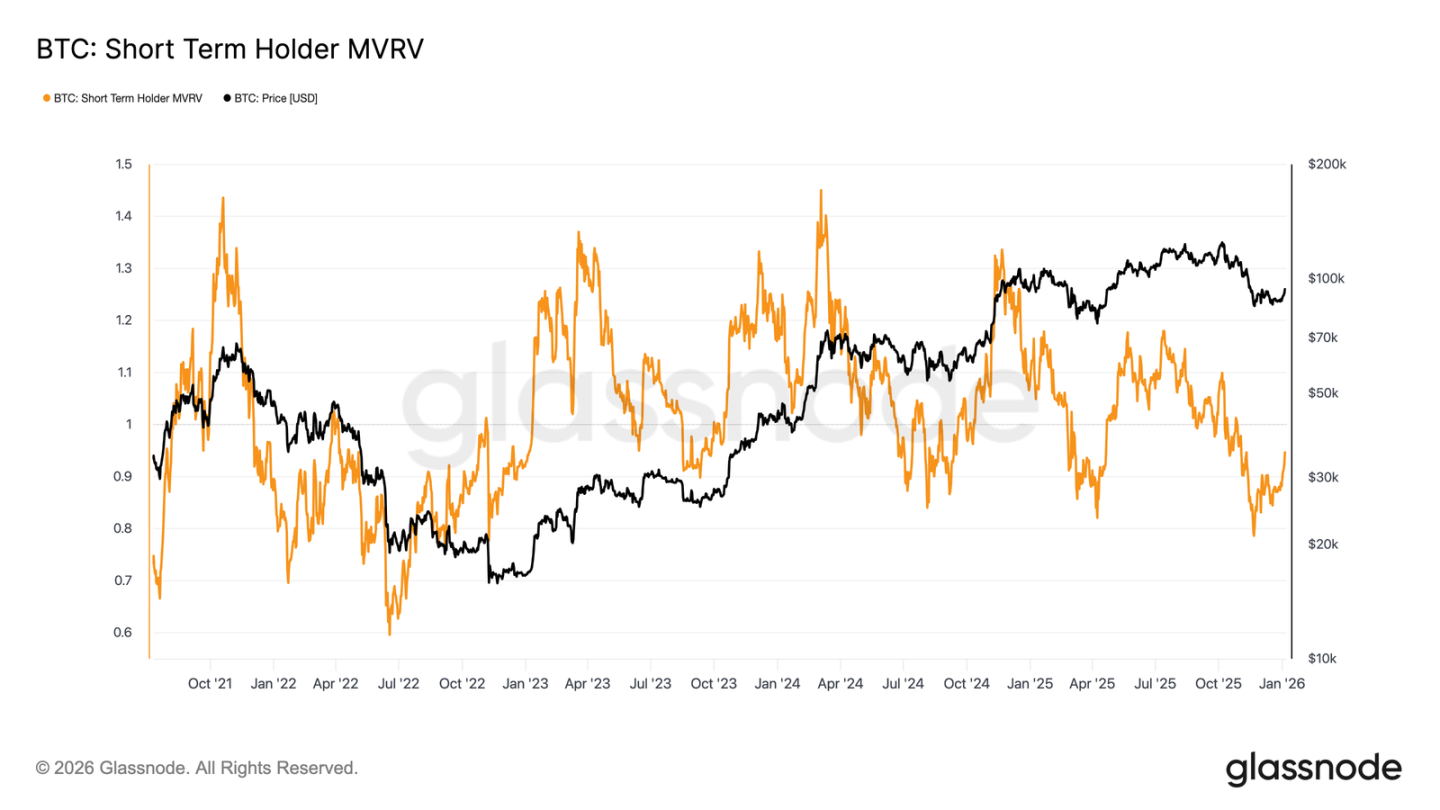
As market focus shifts to whether the STH cost basis can be effectively reclaimed, the current market structure bears some resemblance to the failed rebound seen in Q1 2022. If prices continue to fail to rise above this level, deeper downside risks may emerge. Persistent loss of confidence could lead to further contraction in demand.
This dynamic is also clearly reflected in the Short-Term Holder MVRV (Market Value to Realized Value) ratio. By comparing spot price to the average cost of recent buyers, this metric reveals their unrealized profit/loss status. Historically, when this indicator remains below 1 (i.e., price below average cost), markets tend to be bearish-dominated. Currently, the metric has rebounded from a low of 0.79 to 0.95, meaning recent buyers are still sitting on an average unrealized loss of about 5%. Failure to return to profitability soon (MVRV > 1) would leave the market vulnerable to downward pressure, making this a key watchpoint over the coming weeks.
Off-Chain Insights
Cooling Corporate Treasury Demand
Corporate treasuries continue to provide meaningful marginal demand for Bitcoin, but their buying remains intermittent and event-driven. Treasury entities have repeatedly posted weekly net inflows of several thousand BTC, yet these purchases have not evolved into a consistent, stable accumulation pattern.
Large-scale inflows often occur during local price pullbacks or consolidation phases, suggesting corporate buying remains price-sensitive and opportunistic rather than part of a long-term structural accumulation strategy. While participation has broadened across institutions, overall inflows exhibit a "pulsed" pattern interspersed with extended quiet periods.
Without sustained treasury buying, corporate demand plays more of a price "stabilizer" role rather than serving as a driver of trending upside. Market direction will depend increasingly on changes in derivatives positioning and short-term liquidity conditions.
ETF Flows Return to Net Inflows
Recent U.S. spot Bitcoin ETF flows show early signs of institutional capital re-entering the market. After prolonged net outflows and thin trading at the end of 2025, flows have clearly turned positive in recent weeks—coinciding with price stabilization and rebound from the $80,000 level.
While current net inflow volumes have not yet reached mid-cycle peak levels, the directional shift is now confirmed. Increasing numbers of net-inflow days indicate ETF investors are transitioning back from net sellers to marginal buyers.
This shift means institutional spot demand is once again becoming a positive supporting force rather than a source of liquidity stress, providing structural bid support during the early-year market stabilization phase.
Futures Market Participation Rebounds
After severe deleveraging triggered by price declines at the end of 2025, total futures market open interest has begun to recover. Having pulled back from cycle highs above $50 billion, open interest has now stabilized and started to grow modestly, indicating derivatives traders are gradually re-establishing risk exposure.
This repositioning coincides with price stabilization above the $80,000–$90,000 range, suggesting participants are adding risk cautiously rather than chasing rallies aggressively. The pace of reaccumulation remains moderate, with open interest still far below previous cycle peaks—reducing the risk of large-scale liquidations in the near term.
The gentle rebound in open interest signals improving local risk appetite and a gradual return of derivative buy-side activity, helping facilitate renewed price discovery during this early-stage normalization of liquidity.
Options Market Position 'Reset'
At the end of 2025, the Bitcoin options market underwent its largest-ever position reset. Open contracts fell sharply from 579,258 on December 25 to 316,472 after expiry on December 26—a decline exceeding 45%.
When large open interest concentrates at certain key strikes, market maker hedging activities can indirectly influence short-term price movements. By year-end, this concentration had reached extreme levels, causing "price stickiness" and limiting volatility.
Now, that structure has been broken. With the expiration and clearance of year-end positions, the market has been freed from prior structural hedging constraints.
This post-reset environment offers a clearer window into true market sentiment, as new positions reflect current investor risk appetite rather than legacy exposures. As a result, options trading in the first weeks of the year more directly reflects market expectations for future price direction.
Implied Volatility Likely at Bottom
Following the massive options position reset, implied volatility hit a short-term low during the Christmas period. With light holiday trading, one-week implied volatility declined to its lowest level since late September last year.
Since then, buyer interest has returned, with investors gradually building long volatility positions—especially on the call side—pushing volatility curves gently higher across maturities.
Despite this recovery, implied volatility remains compressed. Across tenors from one week to six months, volatility ranges between 42.6% and 45.4%, with a relatively flat curve shape.
Volatility remains at the lower end of its recent three-month range; the modest rebound primarily reflects improving market engagement rather than a full repricing of risk.
Market Moving Toward Balance
With implied volatility stabilizing, skew provides a clearer lens into directional preferences. Over the past month, put option premiums relative to calls have steadily narrowed, and 25-Delta skew has gradually moved back toward zero.
This reflects a growing tilt toward bullish positioning. Investor demand is shifting from merely guarding against downside moves to increasing exposure to upside potential—consistent with portfolio rebuilding after year-end position clean-up.
At the same time, defensive positioning has decreased. Some downside protection hedges have been unwound, reducing premium paid for "black swan" insurance.
Overall, skew indicates that market risk expression is becoming more balanced, with rising expectations for price increases or volatility expansion.
New Year Options Activity Shows Bullish Bias
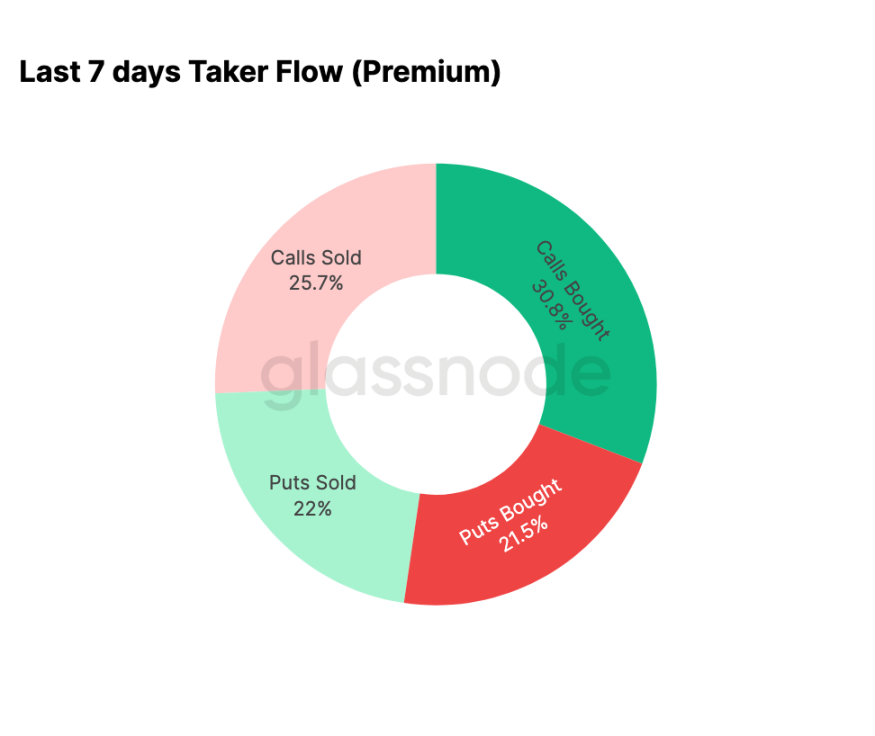
Flow data confirms the trend indicated by skew. Since the beginning of the year, options market activity has shifted from systematic short-call positioning (betting on falling volatility) to active call buying (betting on price rises or increased volatility).
Over the past seven days, call buying accounted for 30.8% of total options activity. Rising call demand has also attracted volatility sellers, who sell calls (25.7% of total activity) to collect higher premiums.
Put-side transactions made up 43.5% of total volume—a relatively moderate share given the recent price increase. This aligns with the balanced skew reading, reflecting reduced immediate demand for downside protection.
Market Makers Turn Negative in Key Range
With bullish call trading accelerating since the new year, market maker positioning has adjusted accordingly. Currently, in the $95,000–$104,000 range, market makers are collectively net short.
Within this zone, rising prices force market makers to hedge by buying spot or perpetuals—creating a passive feedback loop that amplifies upward momentum, contrasting sharply with the volatility-suppressing positive environment seen at the end of last year.
The concentration of call buying at strikes between $95,000 and $100,000 in Q1-expiring contracts further confirms the shift in market risk expression. The current market maker positioning implies that their hedging activity will no longer dampen price volatility in this range—and may instead amplify upside strength.
Call Option Premium at $95K Reflects Patience
The premium behavior of the $95,000-strike call option serves as an effective gauge of shifting market sentiment. On January 1, when spot prices were still near $87,000, accelerated buying of these calls began—and continued rising as price climbed toward the recent high of $94,400.
Thereafter, while call premium accumulation slowed, it did not reverse significantly. More importantly, there was no notable surge in call option selling.
This indicates limited profit-taking. Since the recent peak, call selling has only increased modestly, suggesting most long-position holders are choosing to hold rather than lock in profits prematurely.
Overall, the premium behavior around the $95,000 strike reflects patience and conviction among bullish participants.
Conclusion
As Bitcoin enters the new year, it has undergone significant cleansing of historical positions across spot, futures, and options markets. The deleveraging at the end of 2025, combined with year-end options expiry, effectively removed prior structural constraints, leaving behind a cleaner market with clearer signals.
Now, early signs of renewed market participation are emerging: ETF flows have stabilized and turned positive, futures market activity is recovering, and options markets have decisively shifted toward bullish positioning—with normalized skew, bottoming volatility, and market makers turning net short in key upper ranges.
Together, these dynamics suggest the market is gradually moving away from a phase dominated by defensive selling and entering one of selective risk accumulation and rebuilt engagement. While structural buying forces still need strengthening, the release of legacy position pressure and the re-gathering of bullish sentiment mean Bitcoin has started 2026 with lighter steps, improved internal structure, and greater potential for the next leg of its price journey.
Join TechFlow official community to stay tuned
Telegram:https://t.me/TechFlowDaily
X (Twitter):https://x.com/TechFlowPost
X (Twitter) EN:https://x.com/BlockFlow_News
 @glassnode