2025 Public Chain Reshuffle: Which Projects Are Worth Holding Through Bull and Bear Markets?
TechFlow Selected TechFlow Selected
2025 Public Chain Reshuffle: Which Projects Are Worth Holding Through Bull and Bear Markets?
Not a prediction, nor a gamble, but a selection based on data.
 Navigating Web3 tides with focused insights
Written by: Cecelia, TechFlow

In 2025, which public blockchains will emerge as the true winners after enduring the test of analyzing 8762 data points throughout the year?
Can blockchains that rely solely on narratives and hype withstand the year-end scrutiny? Which truly substantial projects have had their brilliance obscured by market fluctuations and shifting traffic?
Does the performance of public blockchains this year live up to the high expectations and real capital investment of their supporters?
Only by laying out the full year's data on TVL, fees, users, and ecosystem can we distinguish between those that are merely surviving a phase and those that possess the essential demand to reach the endgame. This is not a prediction or a bet, but a screening process based on data.
Grasping Growth Rate and Scale Simultaneously: The 2025 Coordinates of 40 Public Blockchains
When discussing public blockchains, the first unavoidable metric is TVL. Therefore, let's start by examining the most core metric for blockchains: TVL.
For public blockchain TVL, what truly matters is not the absolute annual increase.
Simple statistics on the increase from the beginning to the end of the year are more suitable for quick, rough horizontal comparisons; but attempting to judge a blockchain's true potential based on this can often be misled by temporary spikes or extreme events.
What truly reflects a public blockchain's medium to long-term potential is the growth speed and sustainability it demonstrates throughout the entire year.
Based on this judgment, to more authentically and comprehensively reflect the evolution of public blockchain ecosystems within the year while maintaining high abstraction and comparability, and to minimize the interference of extreme market conditions on our assessment, we chose to use monthly average TVL as the core statistical metric when conducting a preliminary evaluation of the ecosystem development and growth potential of 40 public blockchains in 2025.
Looking further, public blockchain TVL itself can be understood from two complementary dimensions:
- Dynamic Dimension: The month-over-month growth rate of TVL, reflecting the intensity of capital inflow and growth elasticity;
- Static Dimension: The absolute size of TVL, reflecting the current scale tier and ecosystem carrying capacity of the blockchain.
To make a detailed, authentic, and objective judgment about a public blockchain's overall performance, any single dimension is insufficient; growth speed and absolute scale must be considered simultaneously.
Based on this logical framework, we cross-referenced Growth Amplitude (Growth) and Scale Size (Size) to construct a highly standardized Four-Quadrant Analysis Model, using it to uniformly classify and compare the 40 public blockchains.
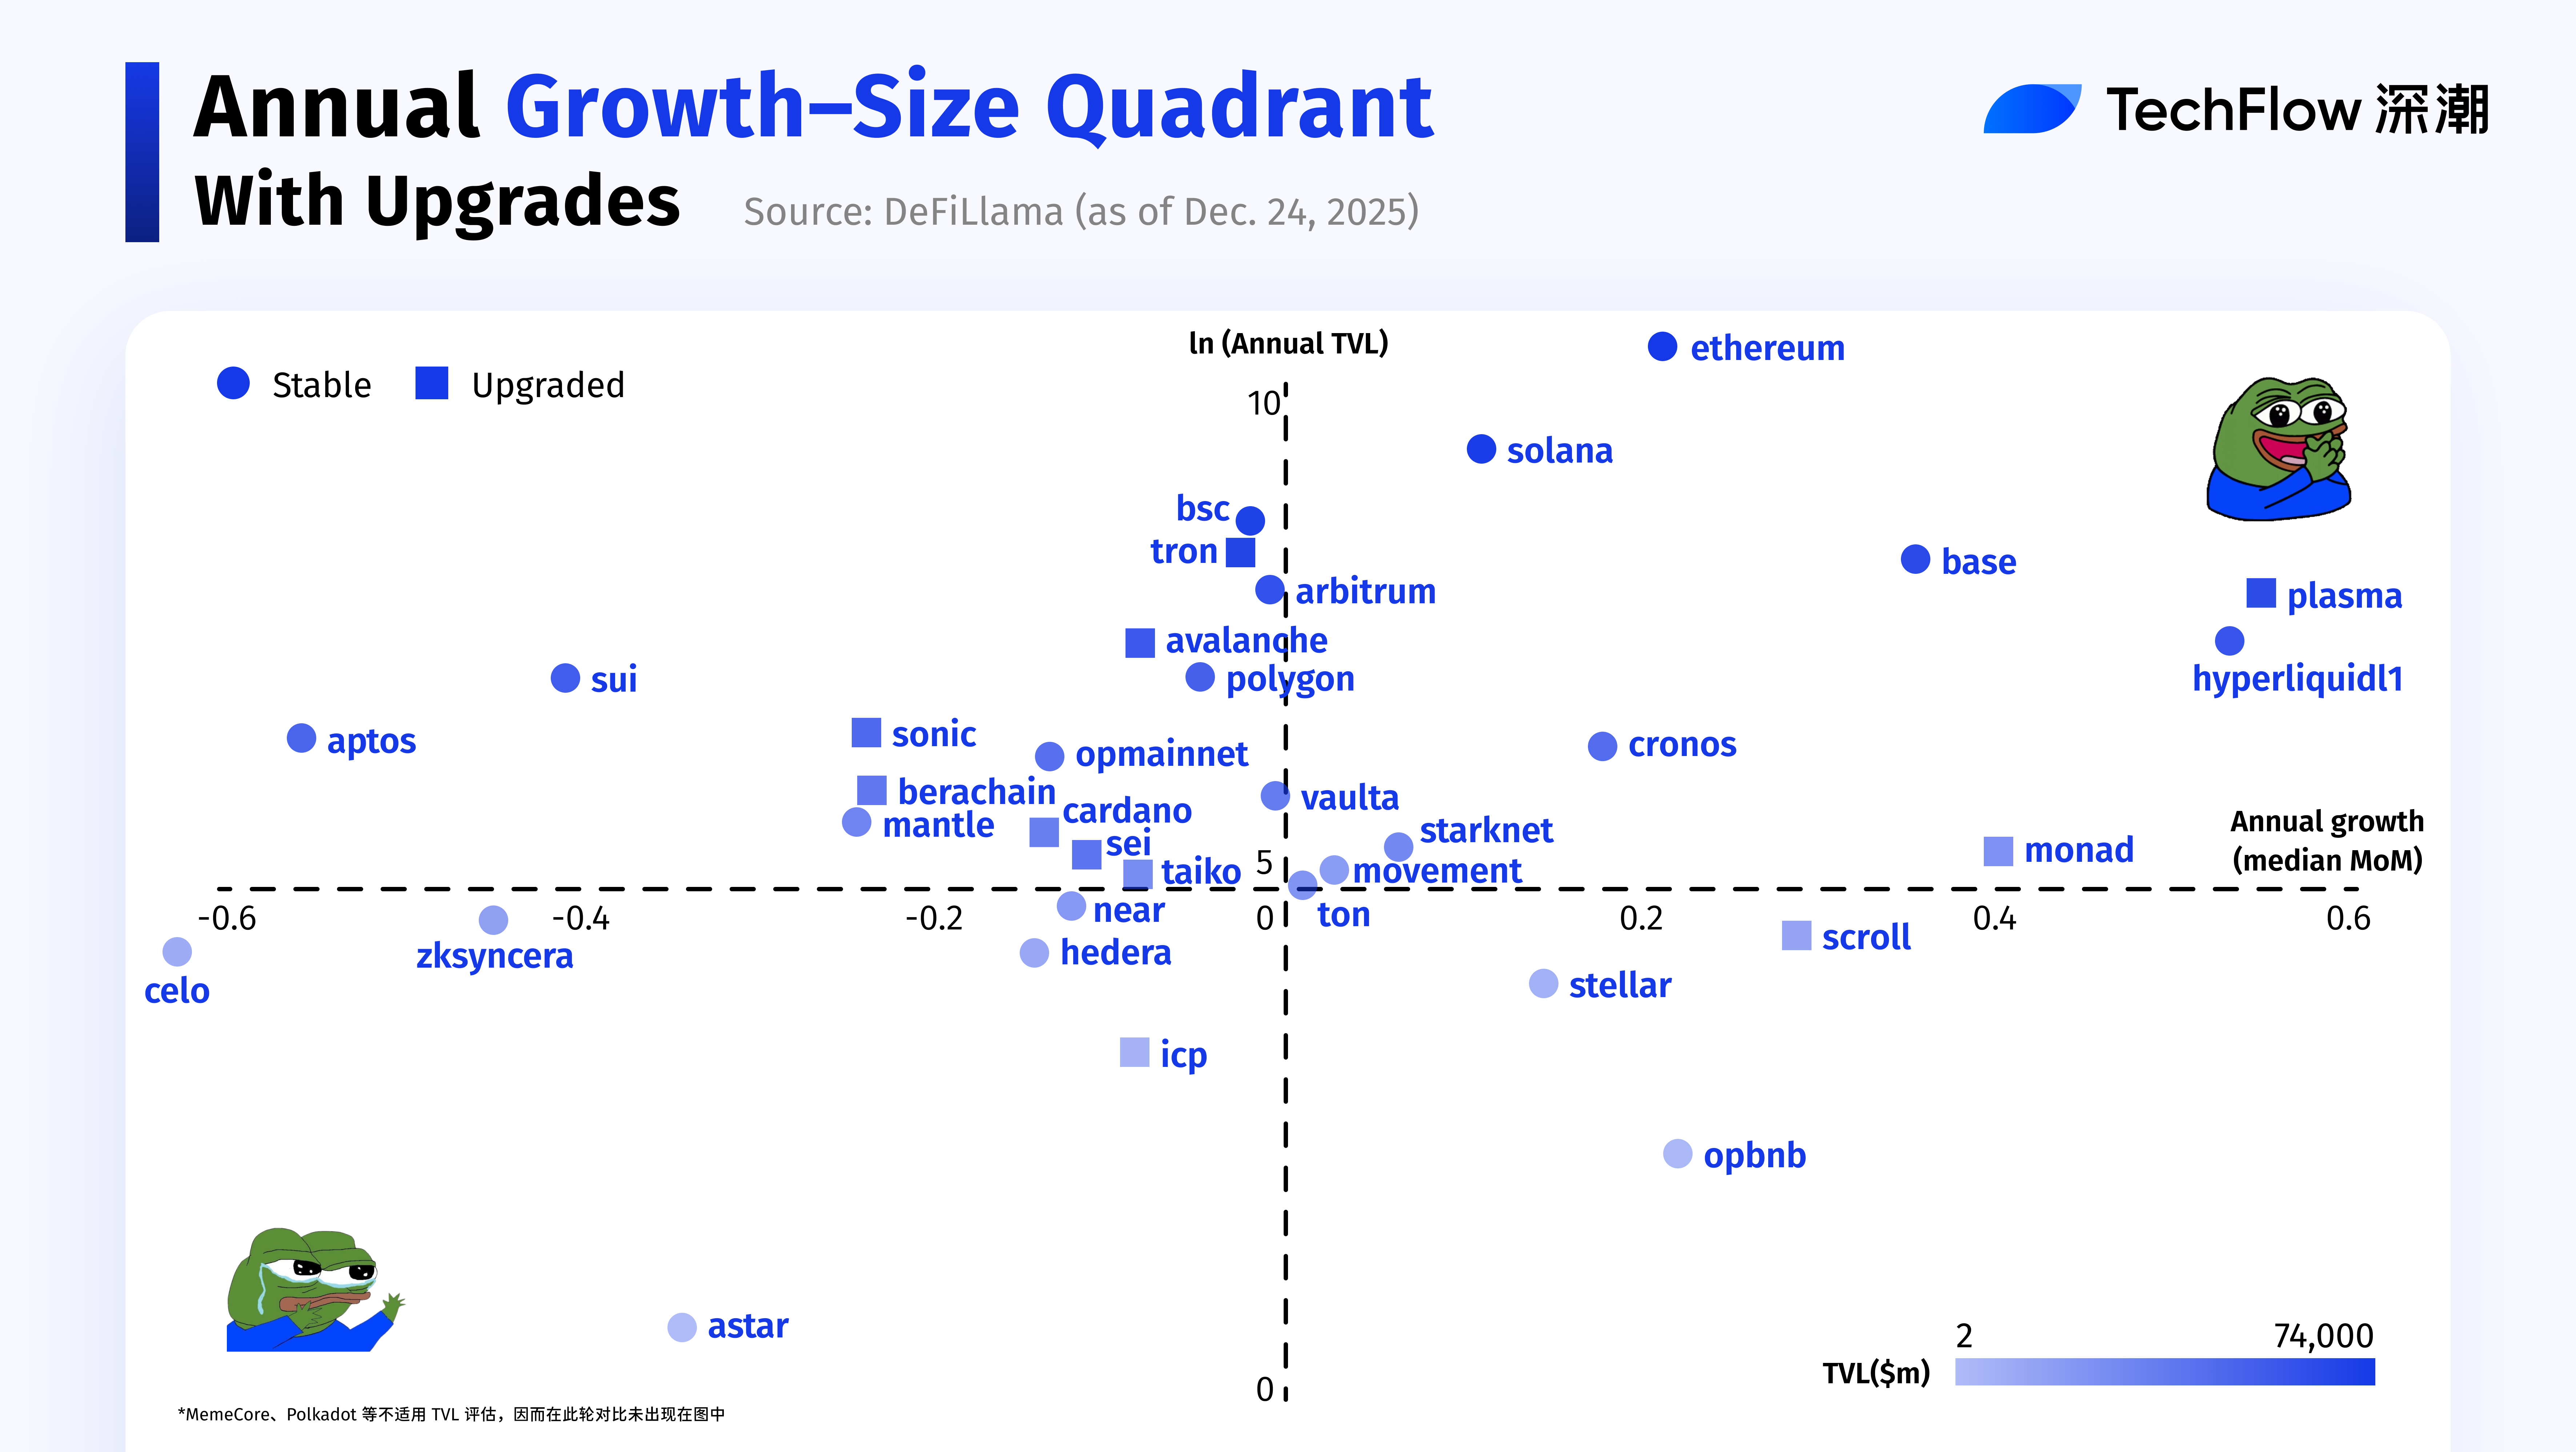
What is ultimately presented to the reader is a four-quadrant structure that intuitively reflects the development stage of a public blockchain:
- High Growth × Large Scale: Main forces in the first tier that have already achieved scale and are still accelerating.
- High Growth × Small Scale: Explosive forces with significant room for scale growth and the strength to leap forward.
- Low Growth × Large Scale: Mature networks with established scale but slowing momentum.
- Low Growth × Small Scale: Potential growth observation zone where projects are poised for action, awaiting validation.
Through this method, the ecological status, growth potential, and potential ceiling of different public blockchains in 2025 are clearly presented within the same coordinate system.
It must also be emphasized that a public blockchain's ecological niche is not static.
In 2025, not all public blockchains remained in the same quadrant throughout. Some projects experienced changes in quadrant position during different stages, reflecting fluctuations in their capital attractiveness and ecological status. For this reason, we differentiated between stable and migratory projects using colors in the four-quadrant chart to visually represent this change.
Compared to methods that rely solely on absolute TVL scale or ranking order, the advantage of this analytical framework lies in: it does not emphasize linear differences in scale, but systematically depicts the differences among public blockchains in terms of capital attractiveness, ecosystem expansion speed, and stage-specific momentum from a structural perspective.
In the specific results, the performance of three public blockchains was particularly outstanding, with their growth trajectories and quadrant migration amplitudes significantly stronger than other projects. To avoid extreme values interfering with the overall readability of the chart, we temporarily excluded them from the main chart and analyzed them separately to more clearly present their uniqueness and representative significance.
- Ink|High Growth × Small Scale
Supported by Kraken, despite Ink's extremely fast growth rate, its TVL surged from about 7m to 273m within two weeks, a cumulative increase of approximately 3,800%, showing an extremely steep short-cycle explosive growth pattern.
Significantly higher than other public blockchains in the same quadrant. While its TVL remains at a relatively limited scale, the speed of capital inflow is very fast. As another case of a CEX deploying a Layer2, attracting substantial capital, Ink's growth is not driven by a single event but formed a sustained rhythm of capital injection within a relatively short period.
- World Chain|High Growth × Small Scale
The prominence of World Chain lies not in its scale itself, but in the extremity and high instability of its relative rate of change. In the early part of the year, its TVL base was extremely small, almost negligible; but subsequently, within a relatively short period, it showed obvious explosive growth, rapidly propelling it into the high-growth range on the growth dimension.
Specifically, World Chain's TVL grew from about 2M at the beginning of the year to 102M in September at one point, exhibiting typical "low base + high slope" characteristics. This type of performance often corresponds to the later stages of ecosystem cold start or early capital validation phases: absolute scale has not yet expanded, but growth signals are already very clear.
From the perspective of narratives and events, this stage of growth did not occur in isolation. World Chain continued to advance ecosystem expansion around its core positioning of identity verification, and in September, it intensively announced multiple collaborations, began embracing the AI Agent narrative, and introduced the key issue of "the boundary between AI and humans" into on-chain scenarios.
In the same month, Nasdaq-listed company Eightco Holdings announced plans to inject $250 to $270 million into Worldcoin and position WLD as its primary reserve asset. This move objectively strengthened market recognition of World Chain's long-term ecological value and became an important background factor for its rapid concentration of capital during that stage.
- Unichain|High Growth × Small Scale
Compared to Ink and World Chain, Unichain's scale base is significantly higher, but its growth speed is still sufficient to make it stand out among similar public blockchains. Its core characteristic is not "taking off from an extremely small scale," but rather being able to consistently achieve growth rates above the industry average even after already possessing a certain scale of ecosystem.
Looking at the data, from the end of April to early May, within a short span of 30 days, Unichain's TVL grew from about 7m to 784m, a cumulative increase of approximately 11,100%. With the advancement of Uniswap v4, Unichain's trading volume within that ecosystem rapidly amplified, once surpassing the Ethereum mainnet to become the primary trading platform on Uniswap v4, with market share approaching or even reaching a dominant position.
This not only reflects the actual effect of the Uniswap ecosystem extending outward but also makes Unichain a direct recipient of protocol-level liquidity spillover.
Overall, Unichain is clearly positioned at the edge of the quadrant as a "potential transition type": its subsequent performance will directly determine whether it completes a substantial leap from the High Growth × Small Scale quadrant to a higher scale range.
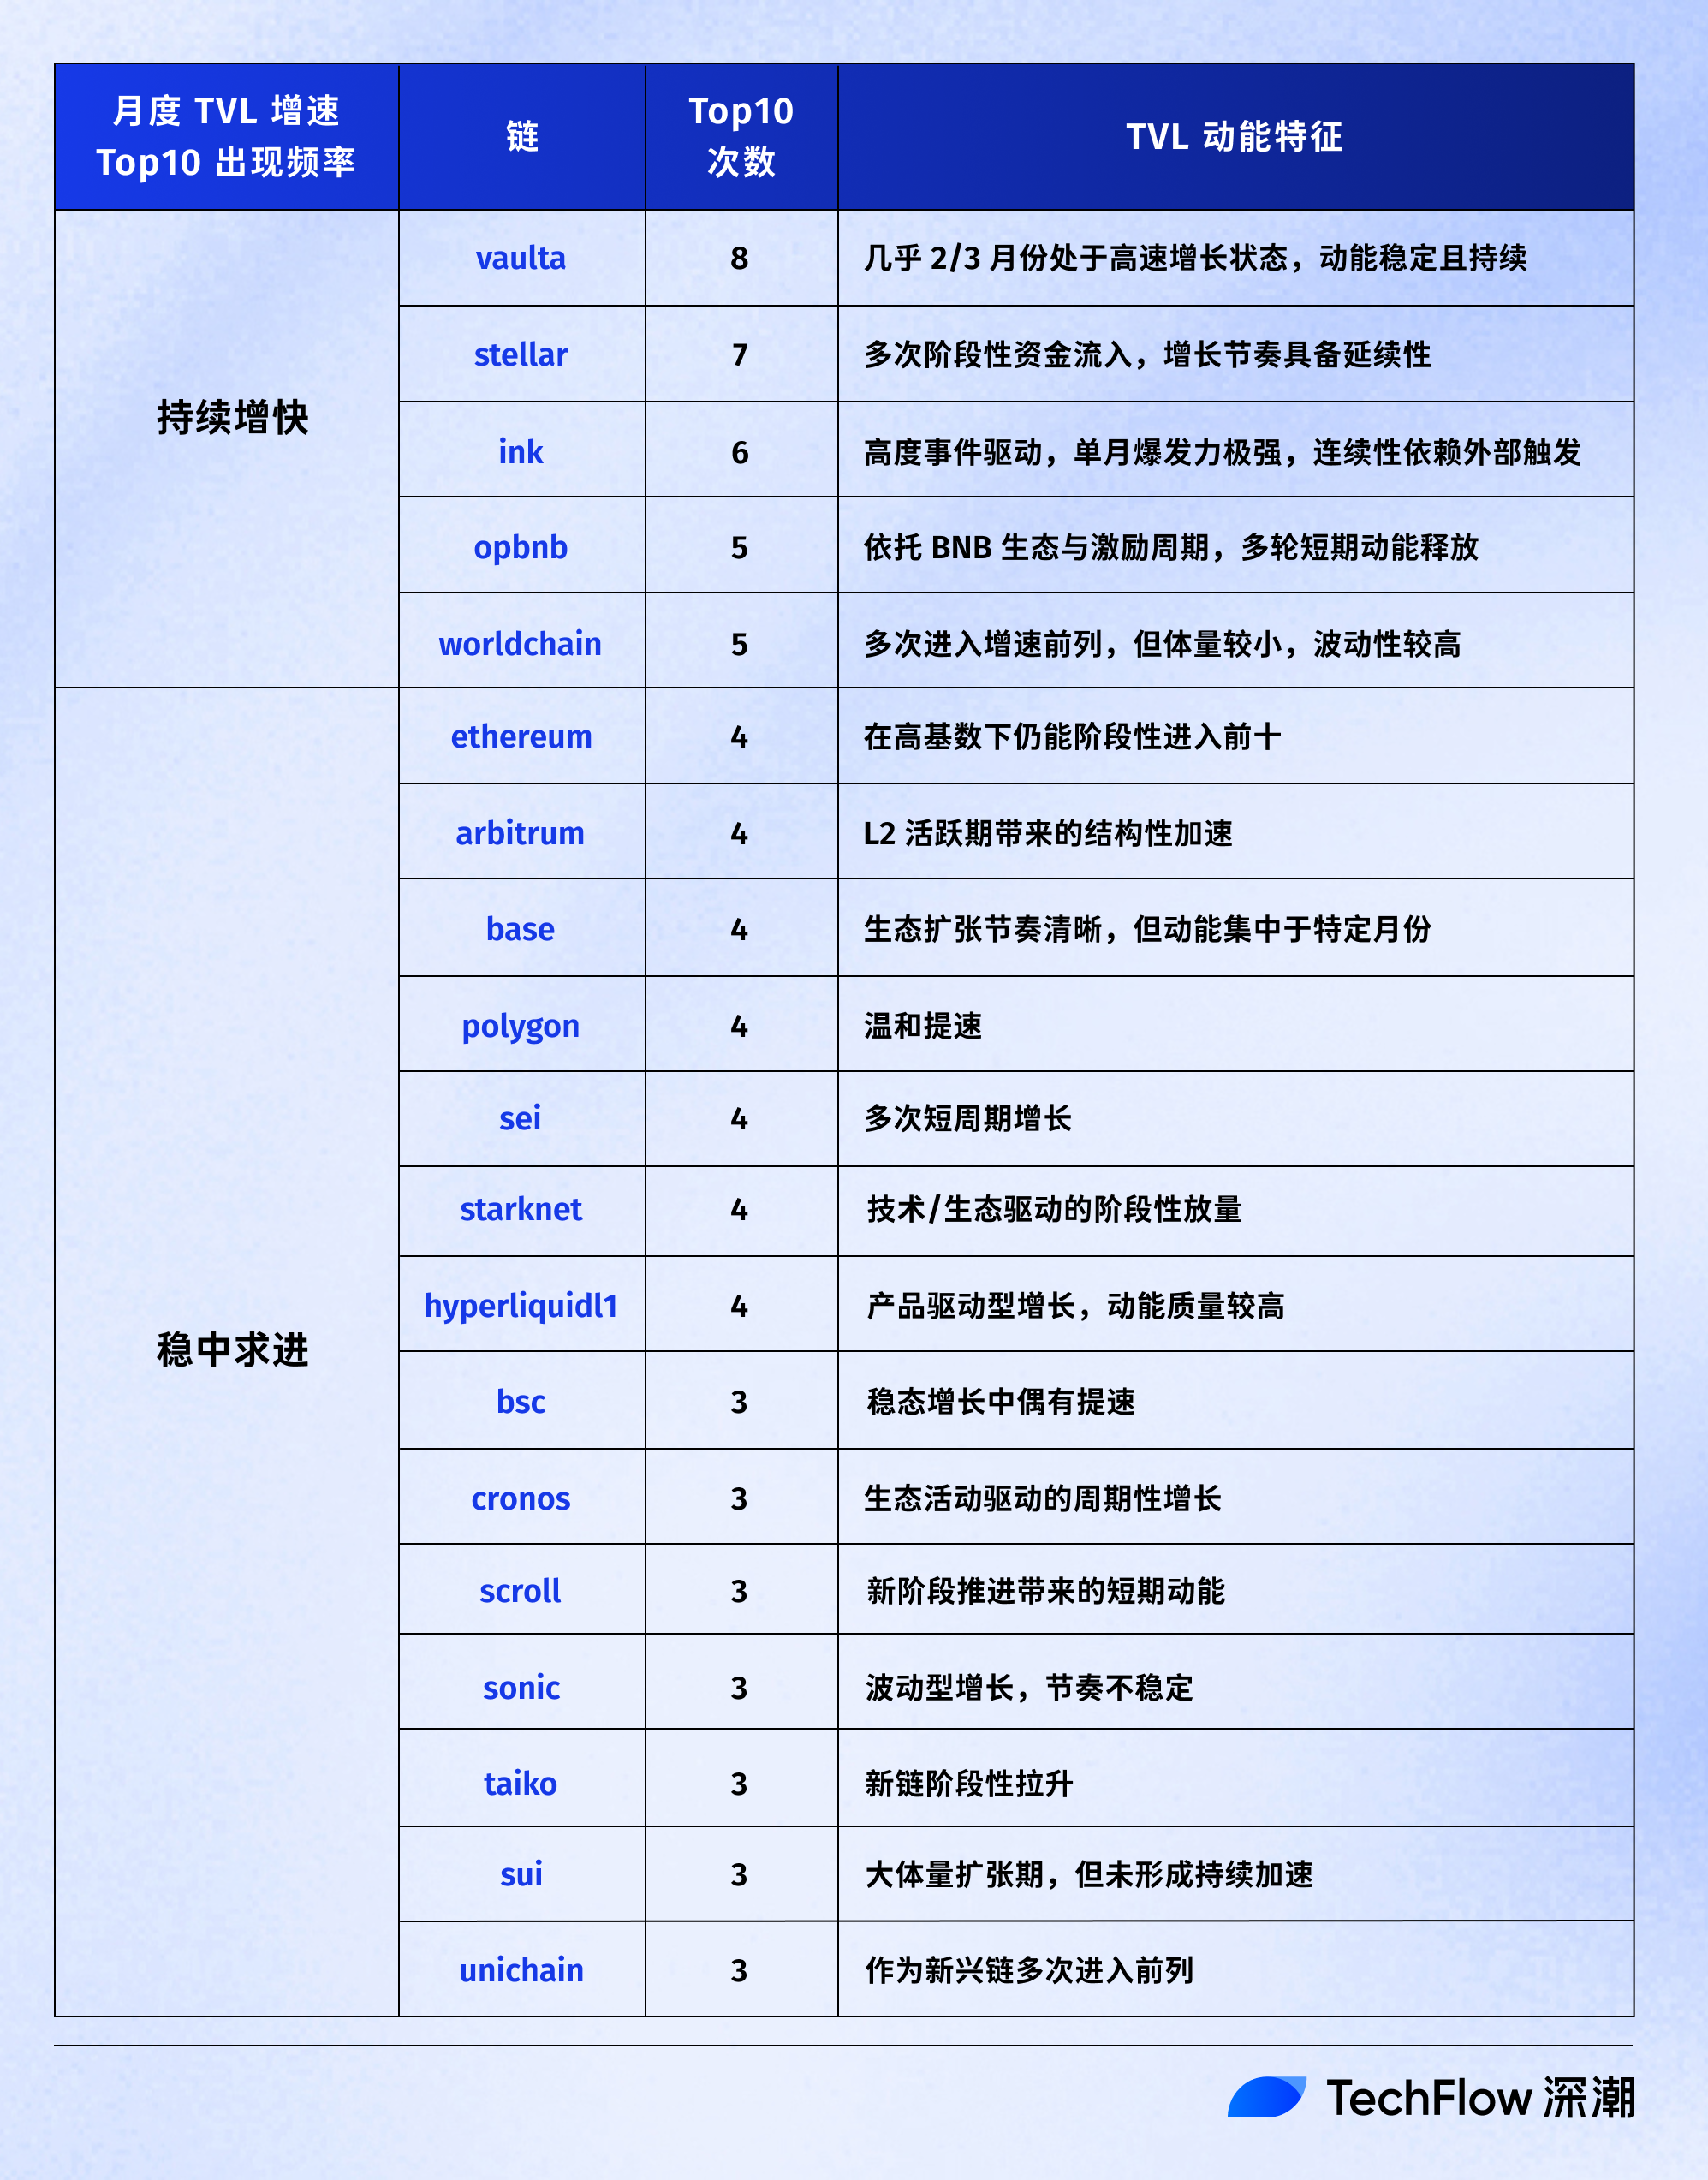
When Growth is Repeatedly Verified: Under Monthly Rotation, Who is the Perpetual Motion Machine with Full Momentum
40 chains are a bit too many? No problem, let's reduce dimensionality again.
Using more intuitive ranking data, after characterizing each chain, we observe their relative growth rates and TVL characteristics. This also supplements the depiction of "dynamic paths" in the four-quadrant analysis.
Behind the Hype, Who is Really Making Money: The Layered Status of Public Blockchain Value Capture Capability
Having looked at TVL, let's now shift our perspective to protocol fees.
This step focuses on value capture capability. Therefore, we have marked the top ten protocols by fees to observe their potential profitability and ecosystem activity.
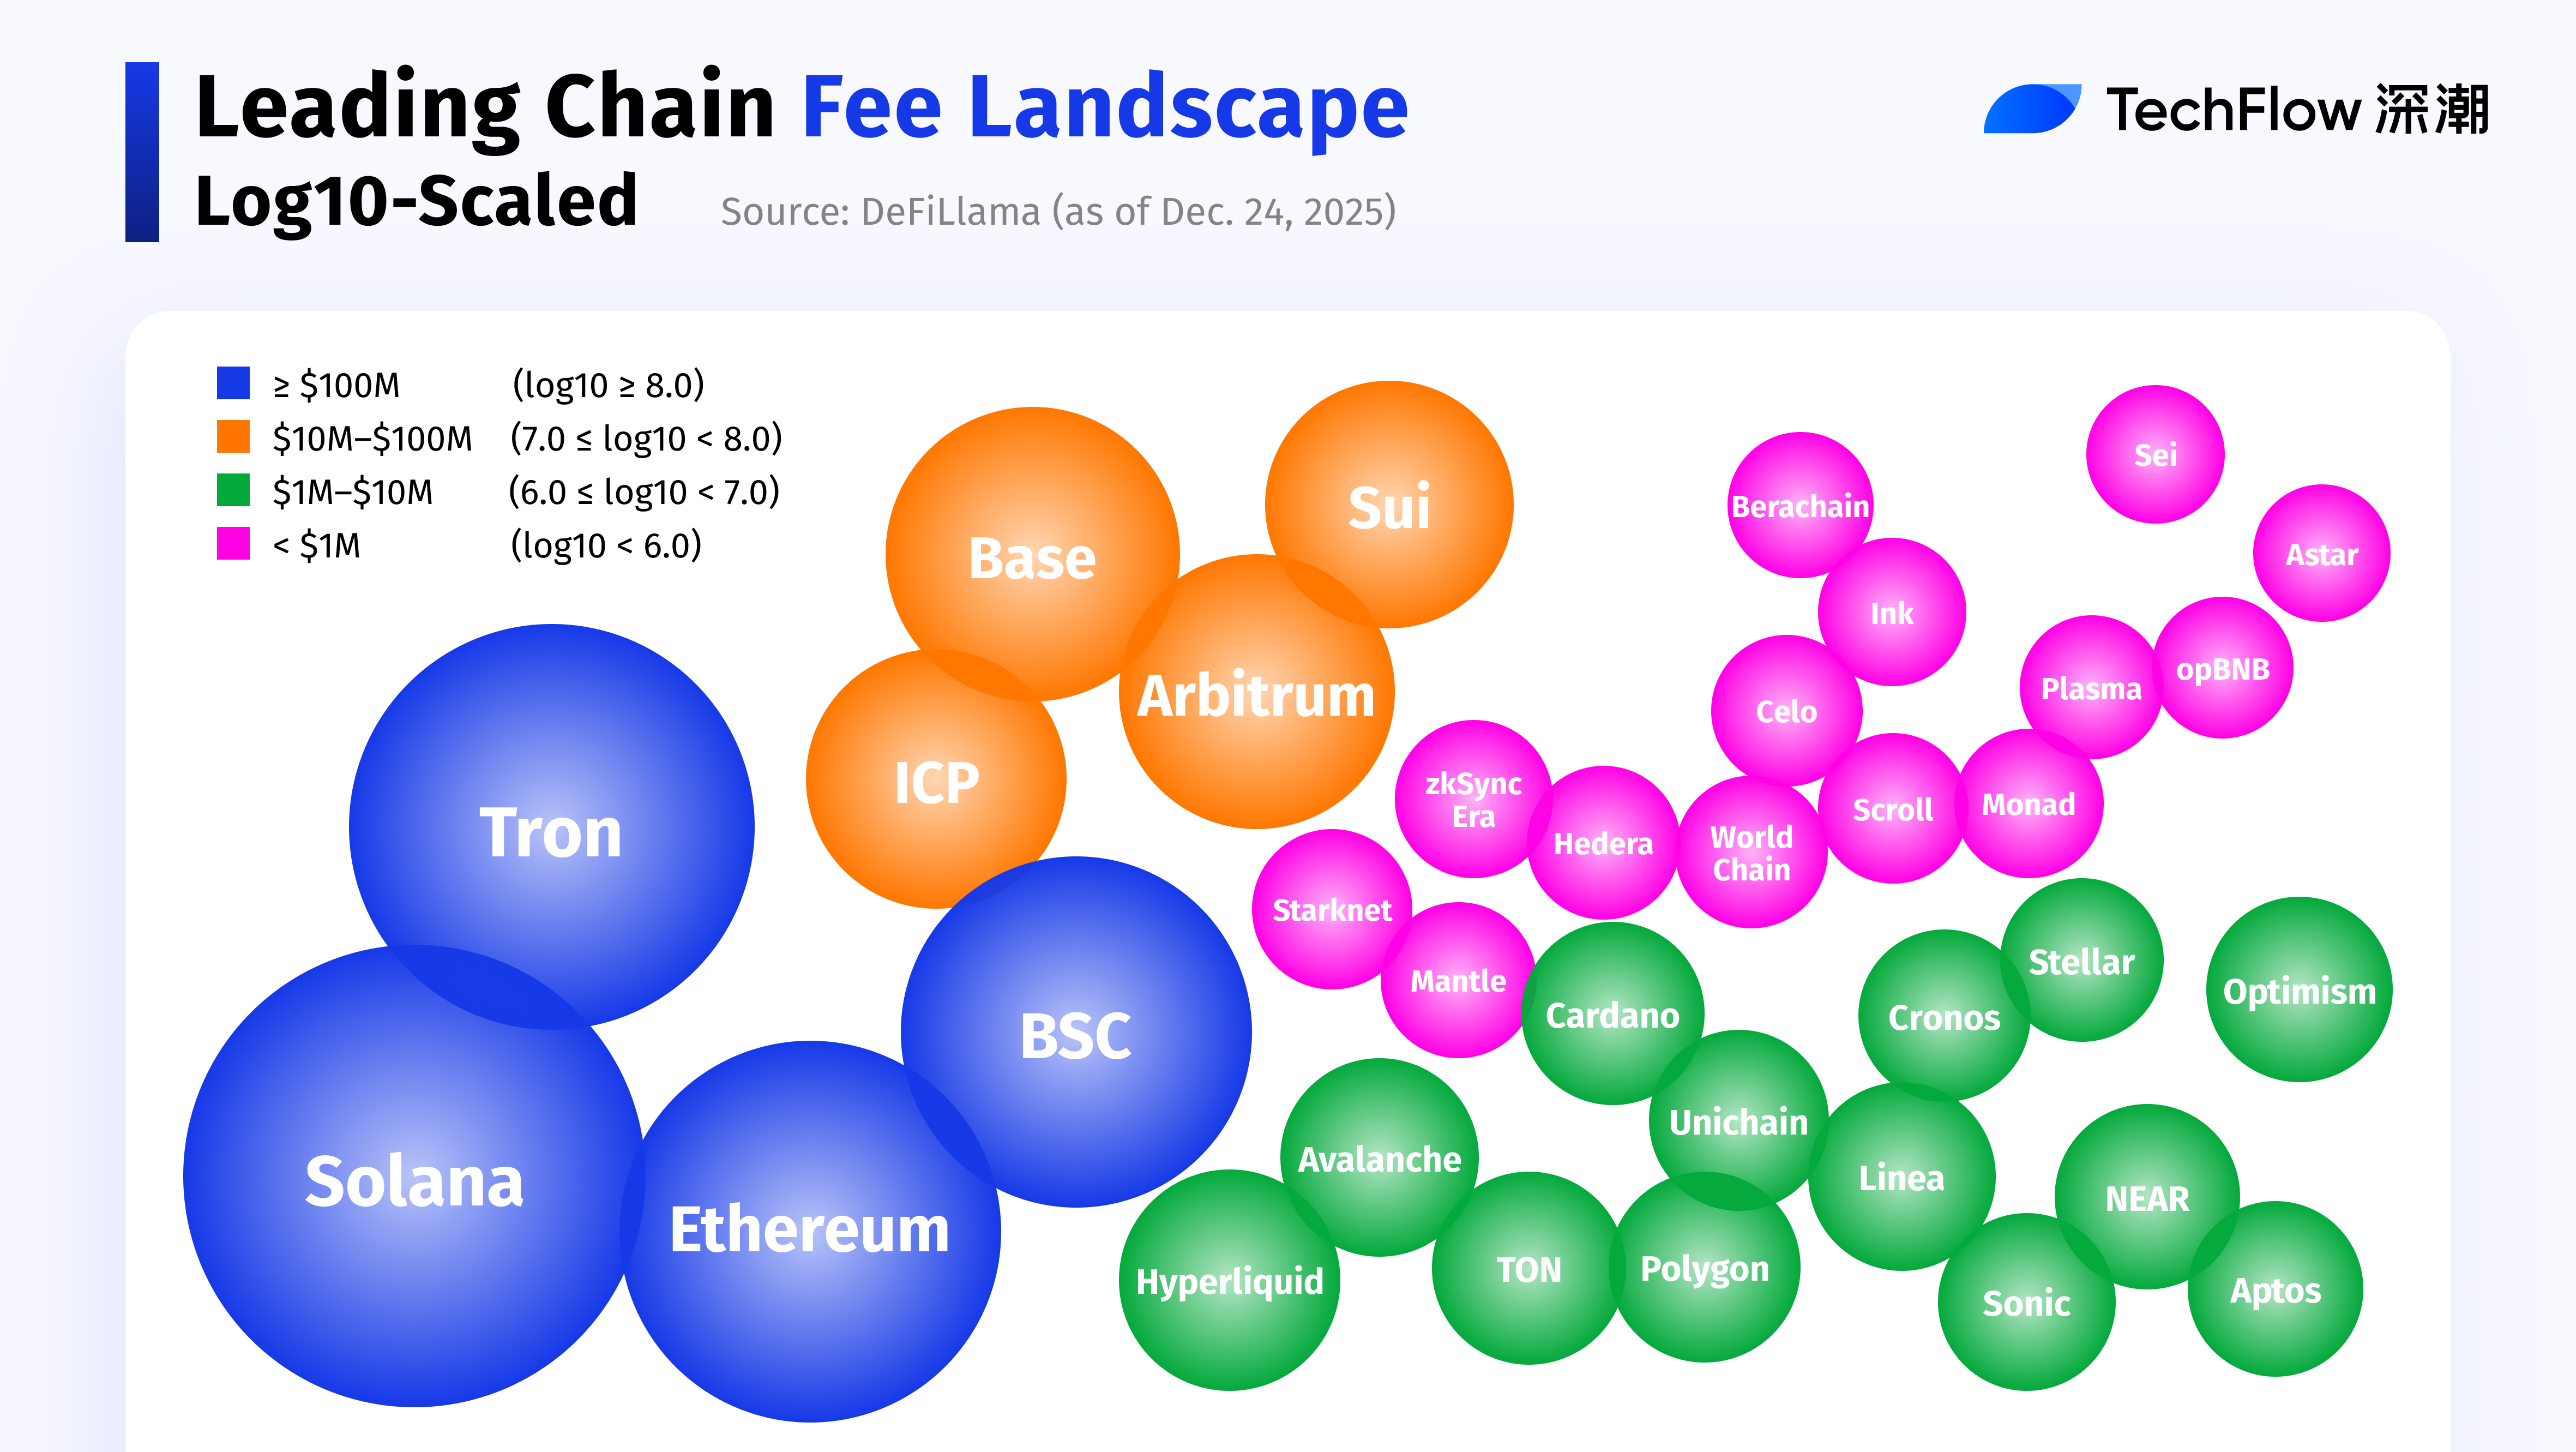
- Solana shows a cliff-like lead in terms of fees.
Its annual fee scale reached $641.92M, not only ranking first but also establishing a significant gap with the second tier. This lead is not from a single event but is built upon the superposition of multiple factors such as high-frequency trading, active DEX ecosystem, density of Meme and bot trading, reflecting sustained, high-turnover real usage intensity.
- Hyperliquid's performance is particularly special.
Its fee scale is not particularly large, but considering its high focus on perpetual contract trading and relatively restrained fee structure, this level already reflects extremely high trading activity and capital turnover efficiency.
- Tron and Ethereum, following closely, represent two different fee source structures:
Tron, with stablecoin transfers and payment-type transactions at its core, derives fees more from high-frequency, low-unit-price but massive-scale basic transfer demands;
Ethereum, although its transaction frequency is lower than Solana's, has a fee structure more inclined towards high-value transactions and complex interactions, maintaining strong "unit value capture capability" among L1s.
The Golden 24 Hours of Top Public Blockchains in 2025: How Much Can They Earn in a Single Day at Most?
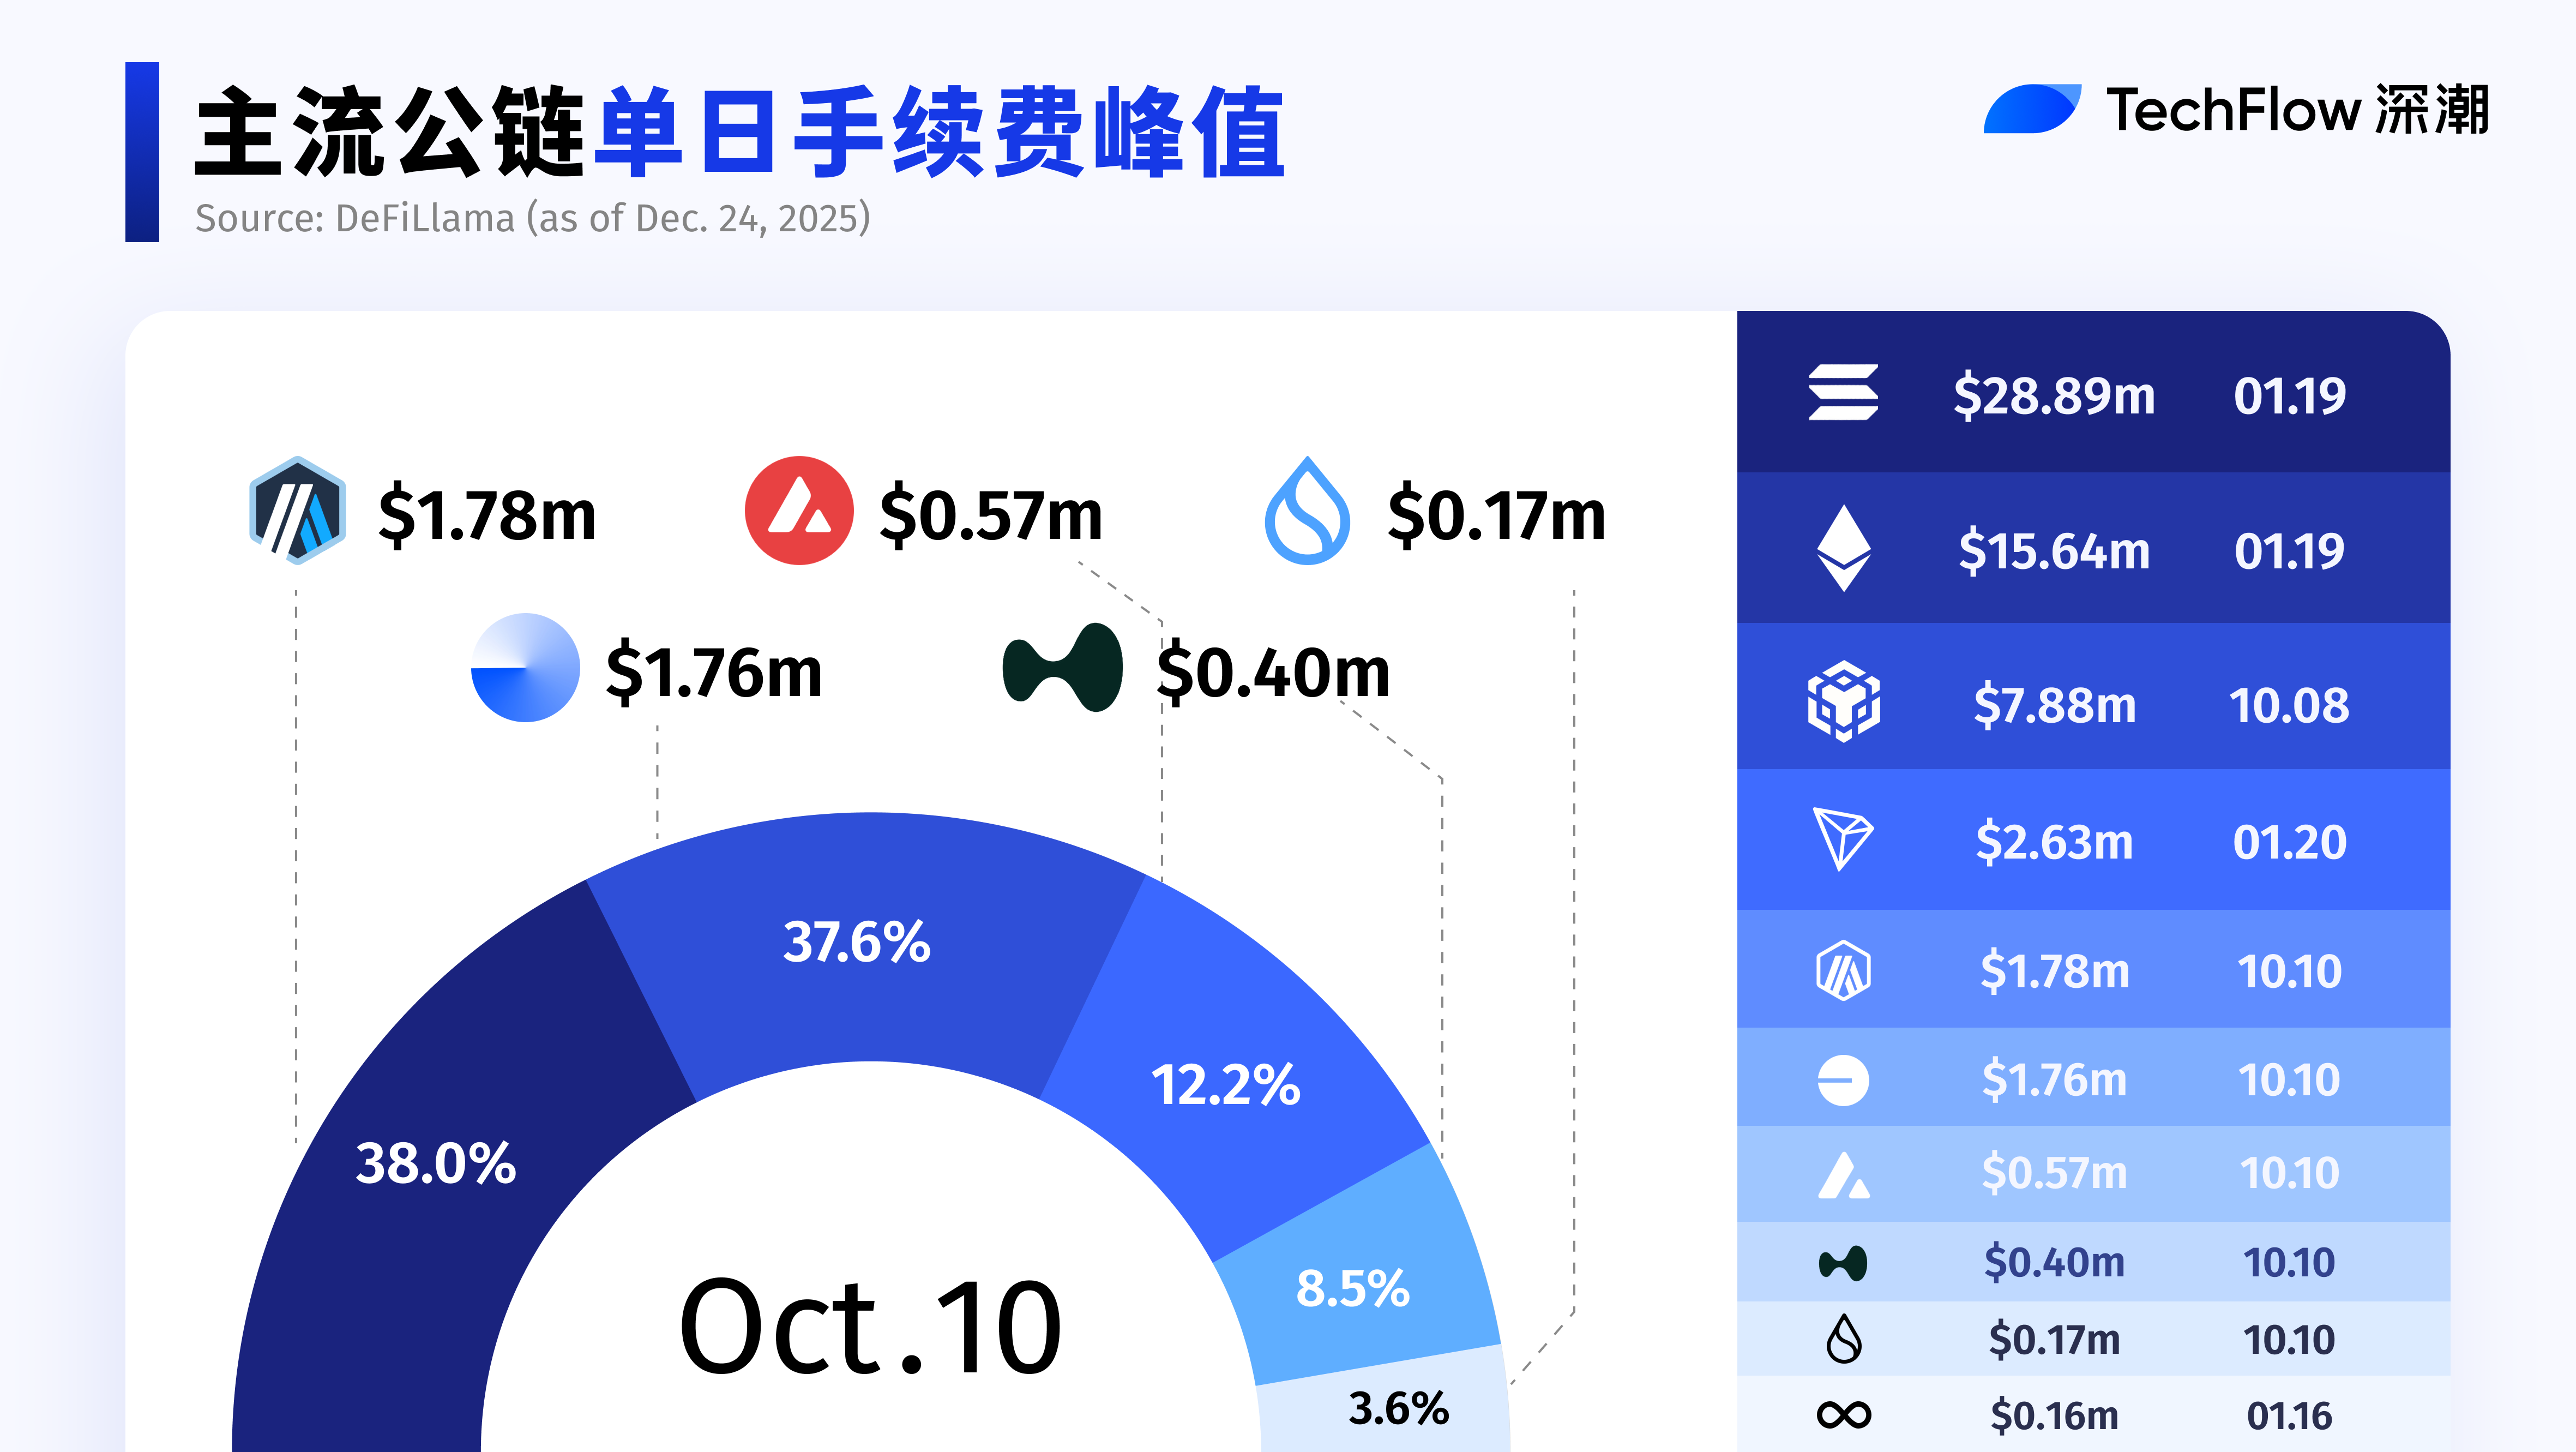
January 19th: The Network-wide Frenzy Triggered by Meme Coins
Looking at the entire year, the TRUMP Meme was undoubtedly one of the most "wealth-creating" single nodes in the 2025 public blockchain ecosystem, bringing immense fee dividends to multiple mainstream public blockchains. In this round, both Solana and Ethereum recorded their annual single-day fee peaks, becoming the most direct beneficiaries.
On the day of the TRUMP Meme coin launch, market sentiment was quickly ignited, and network-wide transaction congestion significantly intensified. Solana, as the primary network carrying Meme trading, saw its on-chain activity and transaction density surge frantically in a short time, with the SOL price once touching $293.
Meanwhile, this frenzy was not confined to a single network. Ethereum was also affected by the spillover of Solana's heat, with L1 activity and Gas prices rising simultaneously, leading to a rapid increase in on-chain fees.
October 10th: Market-wide Liquidation and High-pressure Testing
If the Meme frenzy represents a sentiment-driven flood of traffic, then the subsequent liquidation event was a typical systemic stress test.
On that day, the entire market experienced severe volatility, triggering automatic liquidation mechanisms in numerous DeFi protocols, causing on-chain transaction density and call frequency to rise abruptly. For multiple networks, this was both a stress test of stability and throughput capacity and a direct fee opportunity.
Data shows that this day became one of the most important single-day nodes in the second half of 2025. Multiple public blockchains, including Arbitrum, Base, and Avalanche, recorded their annual highest or near-highest single-day fee income on this date, significantly benefiting from the network activity pushed by liquidations and high-frequency trading.
After looking at key nodes with a wide impact range, let's zoom in: which public blockchain-specific events had an even stronger impact on fees than the two major events mentioned above?
October 8th: The On-chain Traffic Ignition Point for BSC After Fee Reduction
BSC also maintained a certain level of activity in early 2025, but its true annual ATH did not occur during the initial Meme frenzy, but on October 8th. The key variable came from the Gas fee reduction policy implemented on October 1st: BSC directly lowered the base Gas fee to 0.05 Gwei, a reduction of about 50%.
This seemingly "profit-sharing" measure instead became a powerful transaction stimulator. The low-cost environment quickly amplified Meme and high-frequency trading behaviors, driving on-chain interaction density to leap within a short period. The result was that on October 8th, BSC's single-day fee income once surged to $7.88M, briefly topping the list as the blockchain network with the highest fees globally. A large number of Meme platforms and launchers (like Four.meme) erupted under the low Gas environment, allowing BSC to regain traffic and attention in the fiercely competitive public blockchain landscape.
January 20th: Tron's Fee Peak Before Fee Reduction
Unlike BSC, Tron's annual fee peak was clearly front-loaded.
Its 2025 single-day ATH occurred on January 20th ($2.63M), driven not by Meme speculation but by a concentrated release of stablecoin transfer demand.
Around June, due to the rising price of TRX, the cost of USDT transfers on the Tron network once surged to over $4.28 per transaction. As one of the world's most important stablecoin settlement channels, this cost change was directly transmitted to fee income, causing Tron to record relatively high fee levels in the early part of the year.
However, high fees are not a sustainable long-term path. To maintain cost advantages and competitiveness in stablecoin transfer scenarios, the Tron community passed a proposal at the end of August, significantly reducing overall fees by about 60%.
The direct result of this adjustment was: the network became more attractive after the fee reduction, but it also simultaneously lowered the fee contribution per transaction. Therefore, Tron's fee peak for 2025 ultimately remained in the beginning of the year, not in the second half after the fee reduction.
The Chain is Monetizing, But Are the Assets Worth Holding?
Having discussed whether public blockchains can make money, let's see if we can make money by looking at the status of major public blockchain tokens this year.
First, looking at absolute values, which token can bring the highest returns?
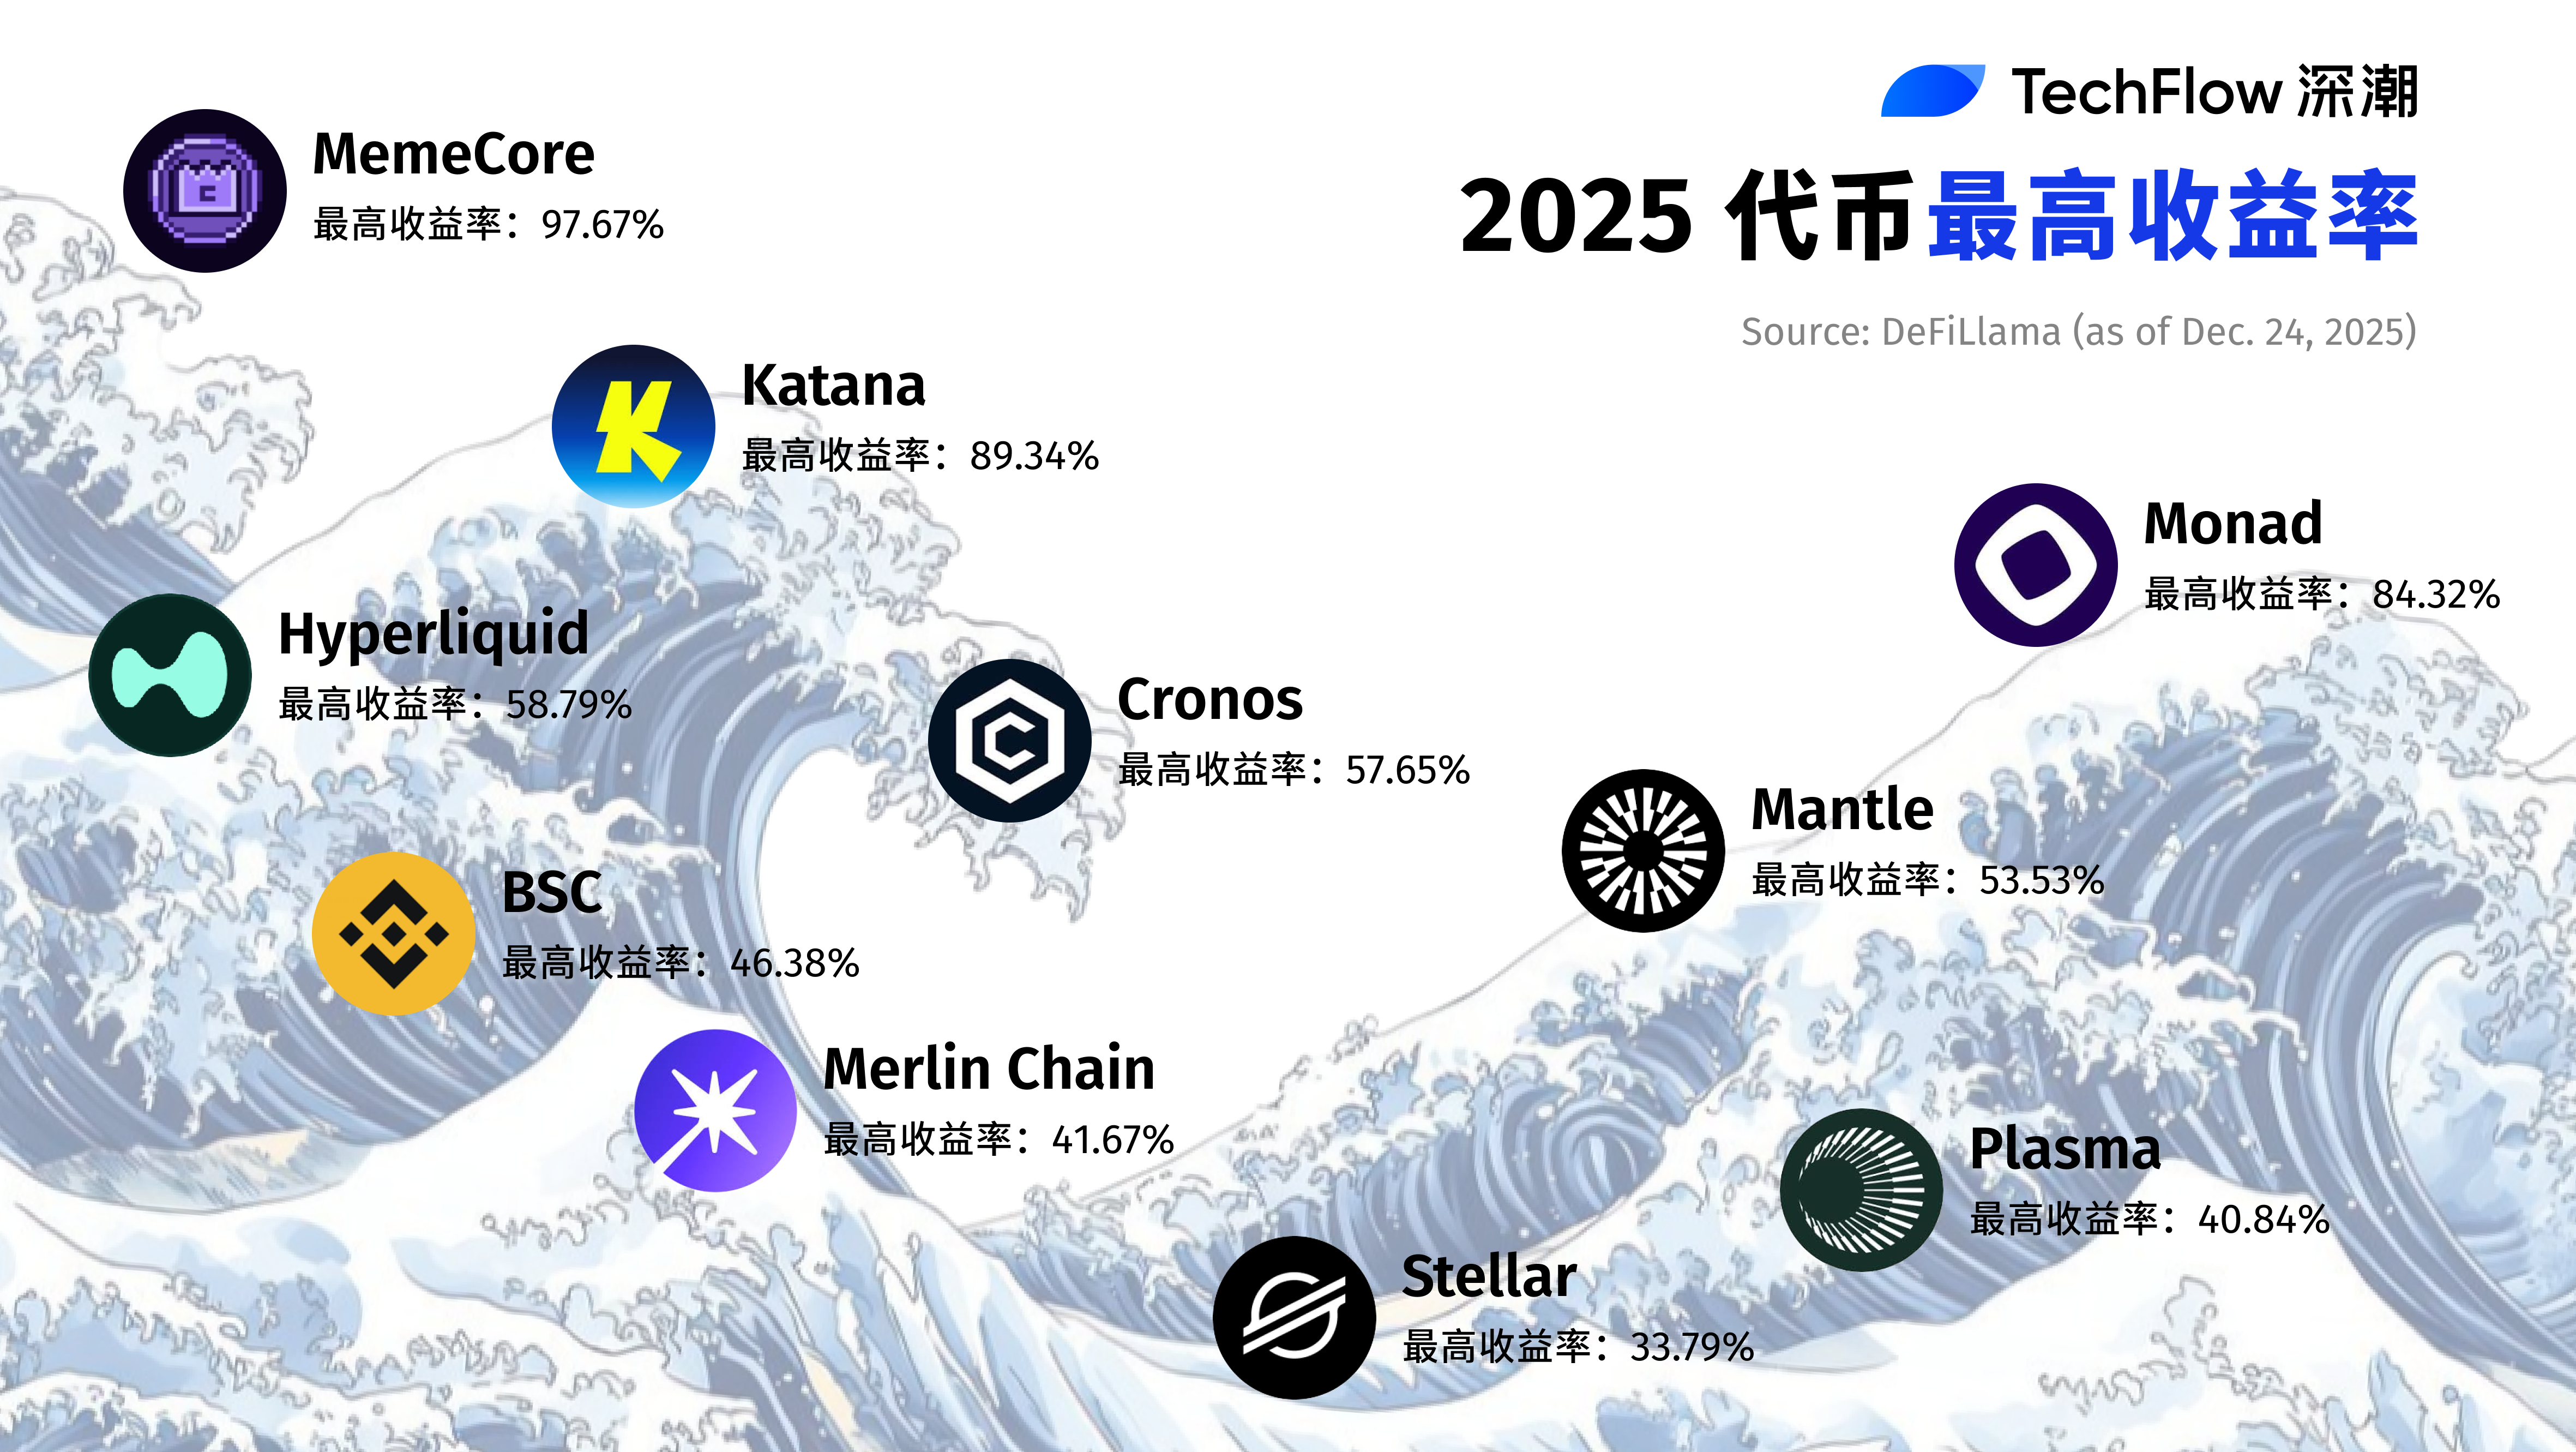
Among the public blockchain assets mentioned above, including Tron ranked 11th, their maximum returns within 2025 have already outperformed Ethereum's gains.
- MemeCore
Among the top ten, MemeCore ranks first with a maximum return of 97.67%, its token price experiencing astonishing growth in the second half of 2025. Its core competitiveness stems from its L1 infrastructure specifically optimized for the Meme ecosystem.
2025 was the year Meme truly entered the mainstream discourse: from AI Memes, celebrity Memes, to Chinese Memes, attention gathered and spread on-chain at an unprecedented speed, only to recede quickly. The real challenge for Memes has never been "whether they can become popular," but how to solidify this surging yet fleeting attention economy. This is precisely what MemeCore attempts to solve. On the basis of承接 Meme trading traffic, MemeCore, by building its own Perp DEX MemeMax, locks the originally overflowing speculative demand within its own ecosystem.
In November 2025, the official announcement of a $300 million ecosystem grant allocation to the MemeMax perpetual contract DEX directly locked a large amount of liquidity, significantly increasing trading depth and usage frequency, while also strengthening demand for the native token, leading to another substantial rise in the token price.
- Katana
Katana's ecosystem is supported by three core sectors: lending, yield aggregation, and DEX. In October, Katana generated $462,000
Join TechFlow official community to stay tuned
Telegram:https://t.me/TechFlowDaily
X (Twitter):https://x.com/TechFlowPost
X (Twitter) EN:https://x.com/BlockFlow_News
 深潮TechFlow