On the Eve of the Bank of Japan's Rate Hike, Why Did Bitcoin Drop First?
TechFlow Selected TechFlow Selected
On the Eve of the Bank of Japan's Rate Hike, Why Did Bitcoin Drop First?
The answer may need to be found in Tokyo.
 Navigating Web3 tides with focused insights
By David, TechFlow

On December 15, Bitcoin dropped from $90,000 to $85,616, a single-day decline of over 5%.
There was no major blow-up or negative event that day, and on-chain data showed no unusual selling pressure. If you only read crypto news, it would be hard to find a "plausible" reason.
But on the same day, gold was quoted at $4,323 per ounce—down just $1 from the previous day.
One fell 5%, the other barely moved.
If Bitcoin truly is "digital gold," a hedge against inflation and fiat devaluation, its performance during risk events should resemble gold. But this time, its behavior clearly mirrored high-Beta tech stocks in the Nasdaq.
What drove this downturn? The answer may lie in Tokyo.
The Butterfly Effect in Tokyo
On December 19, the Bank of Japan (BOJ) will hold its monetary policy meeting. Markets expect a 25 basis point rate hike, raising the policy rate from 0.5% to 0.75%.
0.75% doesn't sound high, but it's Japan’s highest interest rate in nearly 30 years. On prediction markets like Polymarket, traders are pricing in a 98% probability of this hike.

Why would a central bank decision made far away in Tokyo cause Bitcoin to drop 5% within 48 hours?
This traces back to something called the "yen carry trade."
The logic is simple:
With Japan’s interest rates near zero—or even negative—for decades, borrowing yen has been virtually free. So global hedge funds, asset managers, and trading desks have borrowed large amounts of yen, converted them into dollars, and invested in higher-yielding assets such as U.S. Treasuries, U.S. equities, and cryptocurrencies.
As long as these assets return more than the cost of borrowing yen, the spread becomes profit.
This strategy has existed for decades, with scale too vast to measure precisely. Conservative estimates suggest thousands of billions of dollars; including derivatives exposure, some analysts believe it could reach several trillions.
Additionally, Japan holds a unique status:
It is the largest foreign holder of U.S. Treasury bonds, holding $1.18 trillion in U.S. debt.
This means changes in Japan’s capital flows directly impact the world’s most important bond market, which then transmits to the pricing of all risk assets.
Now, when the BOJ decides to raise rates, the fundamental logic of this game is disrupted.
First, the cost of borrowing yen increases, narrowing arbitrage margins. More troublingly, rate hike expectations drive the yen higher. These institutions originally borrowed yen and exchanged them for dollars to invest.
To repay their loans, they now need to sell dollar-denominated assets and convert back into yen. The stronger the yen rises, the more assets they must sell.
This kind of "forced selling" does not pick timing or assets. Whatever is most liquid and easiest to cash out gets sold first.
Thus, it's easy to see why Bitcoin—with 24-hour trading, no circuit breakers, and shallower market depth compared to stocks—is often the first to get dumped.
Looking back at past BOJ rate hikes over recent years, this theory finds partial support in the data:
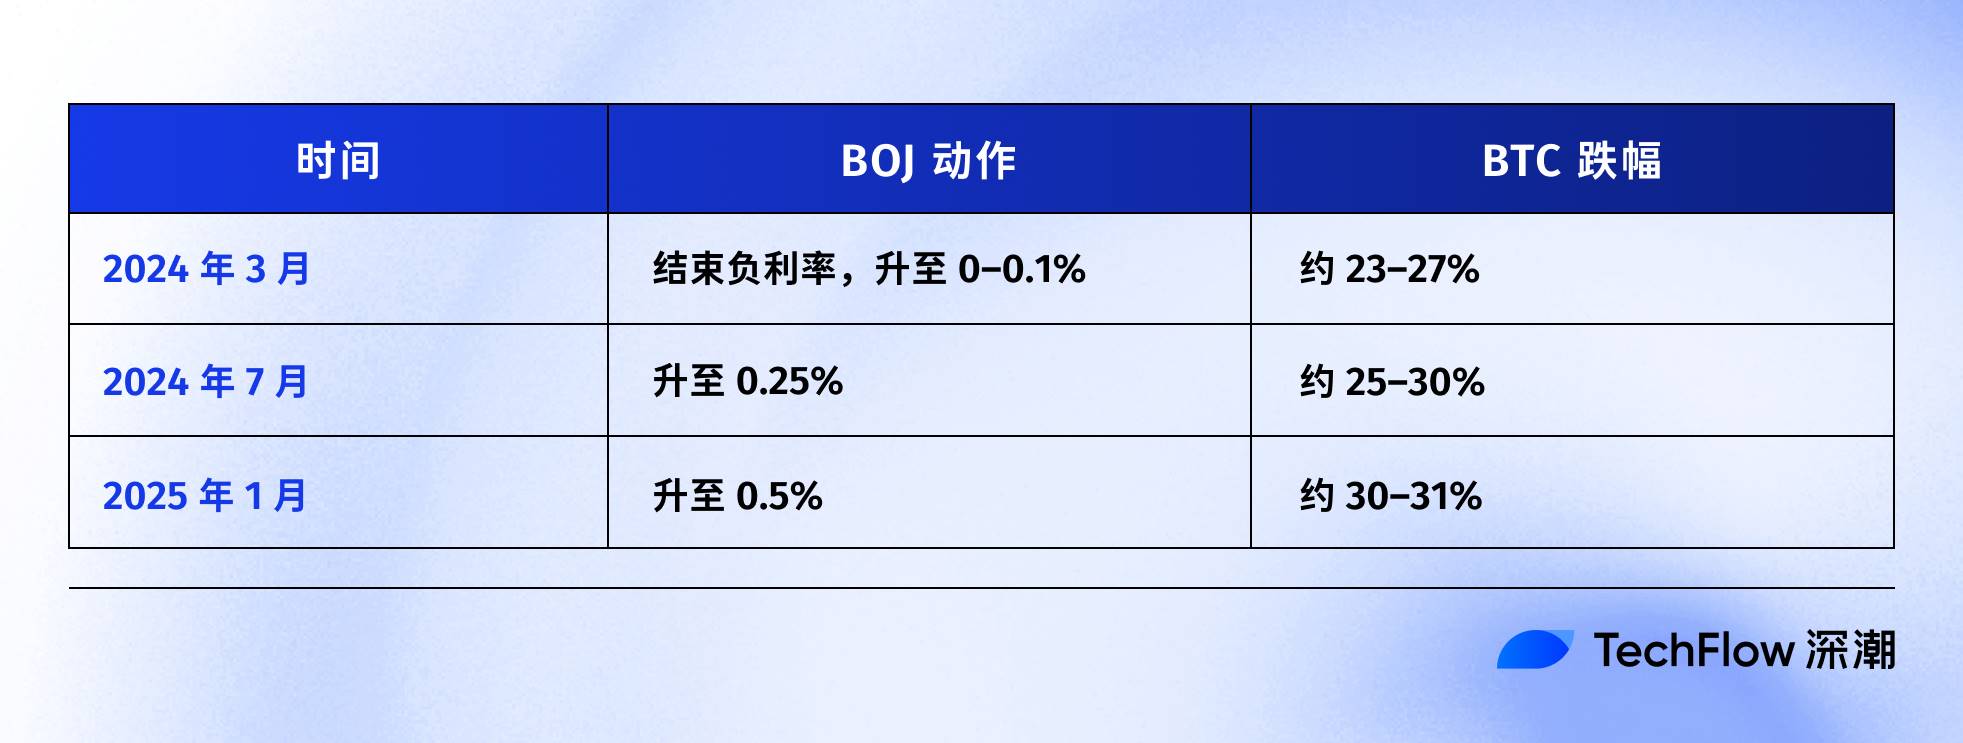
The most recent instance was July 31, 2024. After the BOJ raised rates to 0.25%, the yen surged from 160 to below 140 against the dollar. BTC fell from $65,000 to $50,000 within a week—a roughly 23% drop—and the entire crypto market lost $60 billion in market cap.
According to multiple on-chain analysts, after each of the last three BOJ rate hikes, BTC subsequently saw drawdowns exceeding 20%.
The exact start/end points and time windows vary slightly across these instances, but the direction is highly consistent:
Every time Japan tightens monetary policy, BTC suffers heavily.
Therefore, what happened on December 15 appears to be market participants front-running the event. Before the official announcement on the 19th, capital had already begun exiting.
That day, U.S. Bitcoin ETFs saw a net outflow of $357 million—the largest daily outflow in two weeks. Over $600 million in leveraged long positions were liquidated across the crypto market within 24 hours.
This likely wasn’t retail panic, but rather a cascade of carry trade unwinding.
Is Bitcoin Still Digital Gold?
The above explains the mechanism of yen carry trades, but one question remains unanswered:
Why is BTC always among the first assets sold?
A common explanation is BTC's "high liquidity and 24-hour trading"—which is true, but insufficient.
The real reason is that BTC has been repriced over the past two years: it is no longer an "alternative asset" operating independently from traditional finance, but has been welded into Wall Street’s risk exposure.
In January last year, the U.S. SEC approved spot Bitcoin ETFs. A milestone the crypto industry had waited ten years for. Now, trillion-dollar asset management giants like BlackRock and Fidelity could legally include BTC in client portfolios.
Capital did flow in—but so came an identity shift: the people holding BTC changed.
Previously, BTC buyers were crypto-native players, retail investors, and some aggressive family offices.
Now, BTC buyers include pension funds, hedge funds, and institutional asset allocation models. These entities also hold U.S. equities, Treasuries, and gold—they manage "risk budgets."
When overall portfolio risk needs to be reduced, they don’t just sell BTC or just sell stocks—they reduce positions proportionally.
Data reveals this linkage.
In early 2025, the 30-day rolling correlation between BTC and the Nasdaq-100 index reached 0.80—the highest since 2022. By contrast, before 2020, this correlation fluctuated between -0.2 and 0.2, essentially indicating no meaningful relationship.
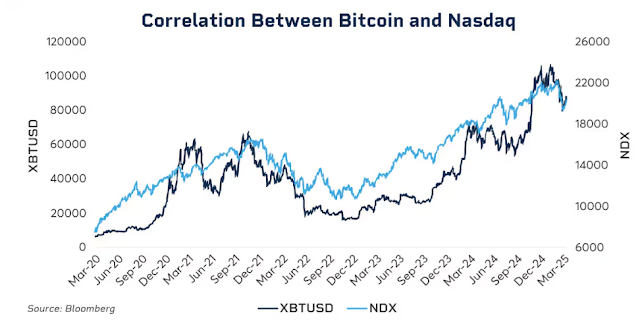
More notably, this correlation intensifies significantly during periods of market stress.
During the March 2020 pandemic crash, the Fed’s aggressive rate hikes in 2022, and early 2025 tariff concerns—each time risk-off sentiment rose, the link between BTC and U.S. equities tightened further.
When institutions panic, they don’t distinguish whether “this is a crypto asset” or “this is a tech stock.” They see only one label: risk exposure.
This raises an awkward question: does the narrative of digital gold still hold?
Over a longer timeframe, gold rose over 60% in 2025—its best year since 1979—while BTC pulled back more than 30% from its peak during the same period.
Two assets both touted as hedges against inflation and fiat devaluation followed completely divergent paths under identical macroeconomic conditions.
This isn’t to say BTC lacks long-term value—its five-year compound annual return still far exceeds both the S&P 500 and Nasdaq.
But at this stage, its short-term pricing logic has shifted: a highly volatile, high-Beta risk asset, not a safe haven.
Understanding this explains why a 25-basis-point rate hike by the BOJ can wipe out thousands of dollars from BTC within 48 hours.
It’s not because Japanese investors are selling BTC, but because when global liquidity tightens, institutions reduce all risk exposures using the same playbook—and BTC happens to be the most volatile and easily monetized link in that chain.
What Will Happen on December 19?
At the time of writing, the BOJ policy meeting is two days away.
The market has already priced in the rate hike as a certainty. Japan’s 10-year government bond yield has risen to 1.95%—the highest in 18 years. In other words, the bond market has already priced in tightening expectations.
If the hike is fully anticipated, will there still be an impact on the 19th?
Historical experience says yes—but the severity depends on the language used.
A central bank decision matters not just for the number, but for the signal it sends. A 25-basis-point hike accompanied by BOJ Governor Kazuo Ueda stating “we will cautiously assess future moves based on data” would calm markets.
But if he says “inflationary pressures persist, and further tightening cannot be ruled out,” that could trigger another wave of selling.
Currently, Japan’s inflation stands around 3%, above the BOJ’s 2% target. The concern isn’t just this single hike, but whether Japan is entering a sustained tightening cycle.
If so, the unraveling of yen carry trades won’t be a one-off event, but a process lasting months.
Still, some analysts believe this time may be different.
First, speculative positioning on the yen has shifted from net short to net long. The sharp drop in July 2024 was partly due to market surprise—back then, many were still betting against the yen. Now, positioning has reversed, limiting the potential for unexpected appreciation.
Second, Japanese government bond yields have been rising for over half a year, climbing from 1.1% at the start of the year to nearly 2%. In a sense, the market has already “preemptively hiked,” and the BOJ is merely confirming reality.
Third, the Federal Reserve has just cut rates by 25 basis points—the global liquidity trend remains accommodative. While Japan is tightening, ample U.S. dollar liquidity might partially offset pressure from the yen side.
These factors don’t guarantee BTC won’t fall, but they suggest the decline may not be as extreme as previous episodes.
Looking at past patterns following BOJ rate hikes, BTC typically bottoms out within one to two weeks after the decision, then enters consolidation or recovery. If this pattern holds, late December through early January could be the most volatile window—yet also a potential opportunity for strategic entry amid oversold conditions.
Accepted, and Affected
Tying everything together, the causal chain is actually clear:
BOJ rate hike → Yen carry trade unwinding → Global liquidity tightening → Institutions reduce risk exposure according to portfolio rules → BTC, as a high-Beta asset, is sold first.
Within this chain, BTC did nothing wrong.
It’s simply placed in a position beyond its control: at the end of the global macro liquidity transmission chain.
You may struggle to accept it, but this is the new normal in the ETF era.
Prior to 2024, BTC price movements were primarily driven by crypto-native factors: halving cycles, on-chain metrics, exchange dynamics, and regulatory news. Back then, its correlation with U.S. equities and Treasuries was low—it functioned somewhat like an “independent asset class.”
After 2024, Wall Street arrived.
BTC was integrated into the same risk management framework as stocks and bonds. Its ownership structure changed, and so did its pricing logic.
BTC’s market cap soared—from hundreds of billions to $1.7 trillion. But it came with a side effect: BTC lost its immunity to macro events.
A single statement from the Fed or a policy decision from the BOJ can now swing BTC by over 5% within hours.
If you believe in the “digital gold” narrative—that it offers shelter in turbulent times—the 2025 price action has been somewhat disappointing. At least for now, the market is not pricing it as a safe-haven asset.
Perhaps this is just a temporary misalignment. Perhaps institutional adoption is still in early stages, and once allocation ratios stabilize, BTC will rediscover its own rhythm. Perhaps the next halving cycle will reaffirm the dominance of crypto-native drivers...
But until then, if you hold BTC, you must accept one reality:
You are also holding exposure to global liquidity. What happens in a conference room in Tokyo may matter more for your account balance next week than any on-chain metric.
This is the price of institutionalization. Whether it’s worth it—everyone must decide for themselves.
Join TechFlow official community to stay tuned
Telegram:https://t.me/TechFlowDaily
X (Twitter):https://x.com/TechFlowPost
X (Twitter) EN:https://x.com/BlockFlow_News
 深潮TechFlow