Data Insight: Bitcoin's Year-to-Date Gains Turn Negative—Has a Full Bear Market Truly Arrived?
TechFlow Selected TechFlow Selected
Data Insight: Bitcoin's Year-to-Date Gains Turn Negative—Has a Full Bear Market Truly Arrived?
Persistent weak spot demand, exacerbated outflows from U.S. spot ETFs, and absence of new buying interest from traditional financial investors.
 Navigating Web3 tides with focused insights
Author: Chris Beamish, CryptoVizArt, Antoine Colpaert, Glassnode
Translation: Luffy, Foresight News
TL;DR
-
Bitcoin has fallen below the short-term holder (STH) cost basis range, putting clear pressure on recent buyers; the $95K–$97K range has now become a key resistance zone, and reclaiming it would signal initial market structure recovery.
-
Spot demand remains weak, with U.S. spot ETFs seeing accelerated outflows and no new buying interest from traditional financial allocators.
-
Speculative leverage continues to unwind, futures open interest declines, and funding rates fall to cycle lows.
-
The options market has significantly repriced risk, with implied volatility rising across all tenors as traders pay high premiums to hedge downside risk.
-
Bearish options dominate capital flows, with strong demand at key strike prices (e.g., $90K), reinforcing a defensive positioning structure—traders are favoring active risk hedging over increasing upside exposure.
-
The Digital Asset Volatility Index (DVOL) has rebounded to monthly highs, reflecting comprehensive risk repricing across volatility, skew, and capital flow metrics, indicating short-term volatility may remain elevated.
Bitcoin has broken below its prior consolidation range, briefly touching $89K, creating a new local low and turning its year-to-date gains negative. This deep correction extends the mild bearish trend we highlighted last week, raising questions about when structural support might re-emerge. This article evaluates market reactions to this breakdown using on-chain pricing models and realized loss data from short-term holders, then analyzes options markets, ETF flows, and futures positions to explore sentiment shifts among speculators amid renewed weakness.
On-Chain Insights
Breaking Below the Lower Range
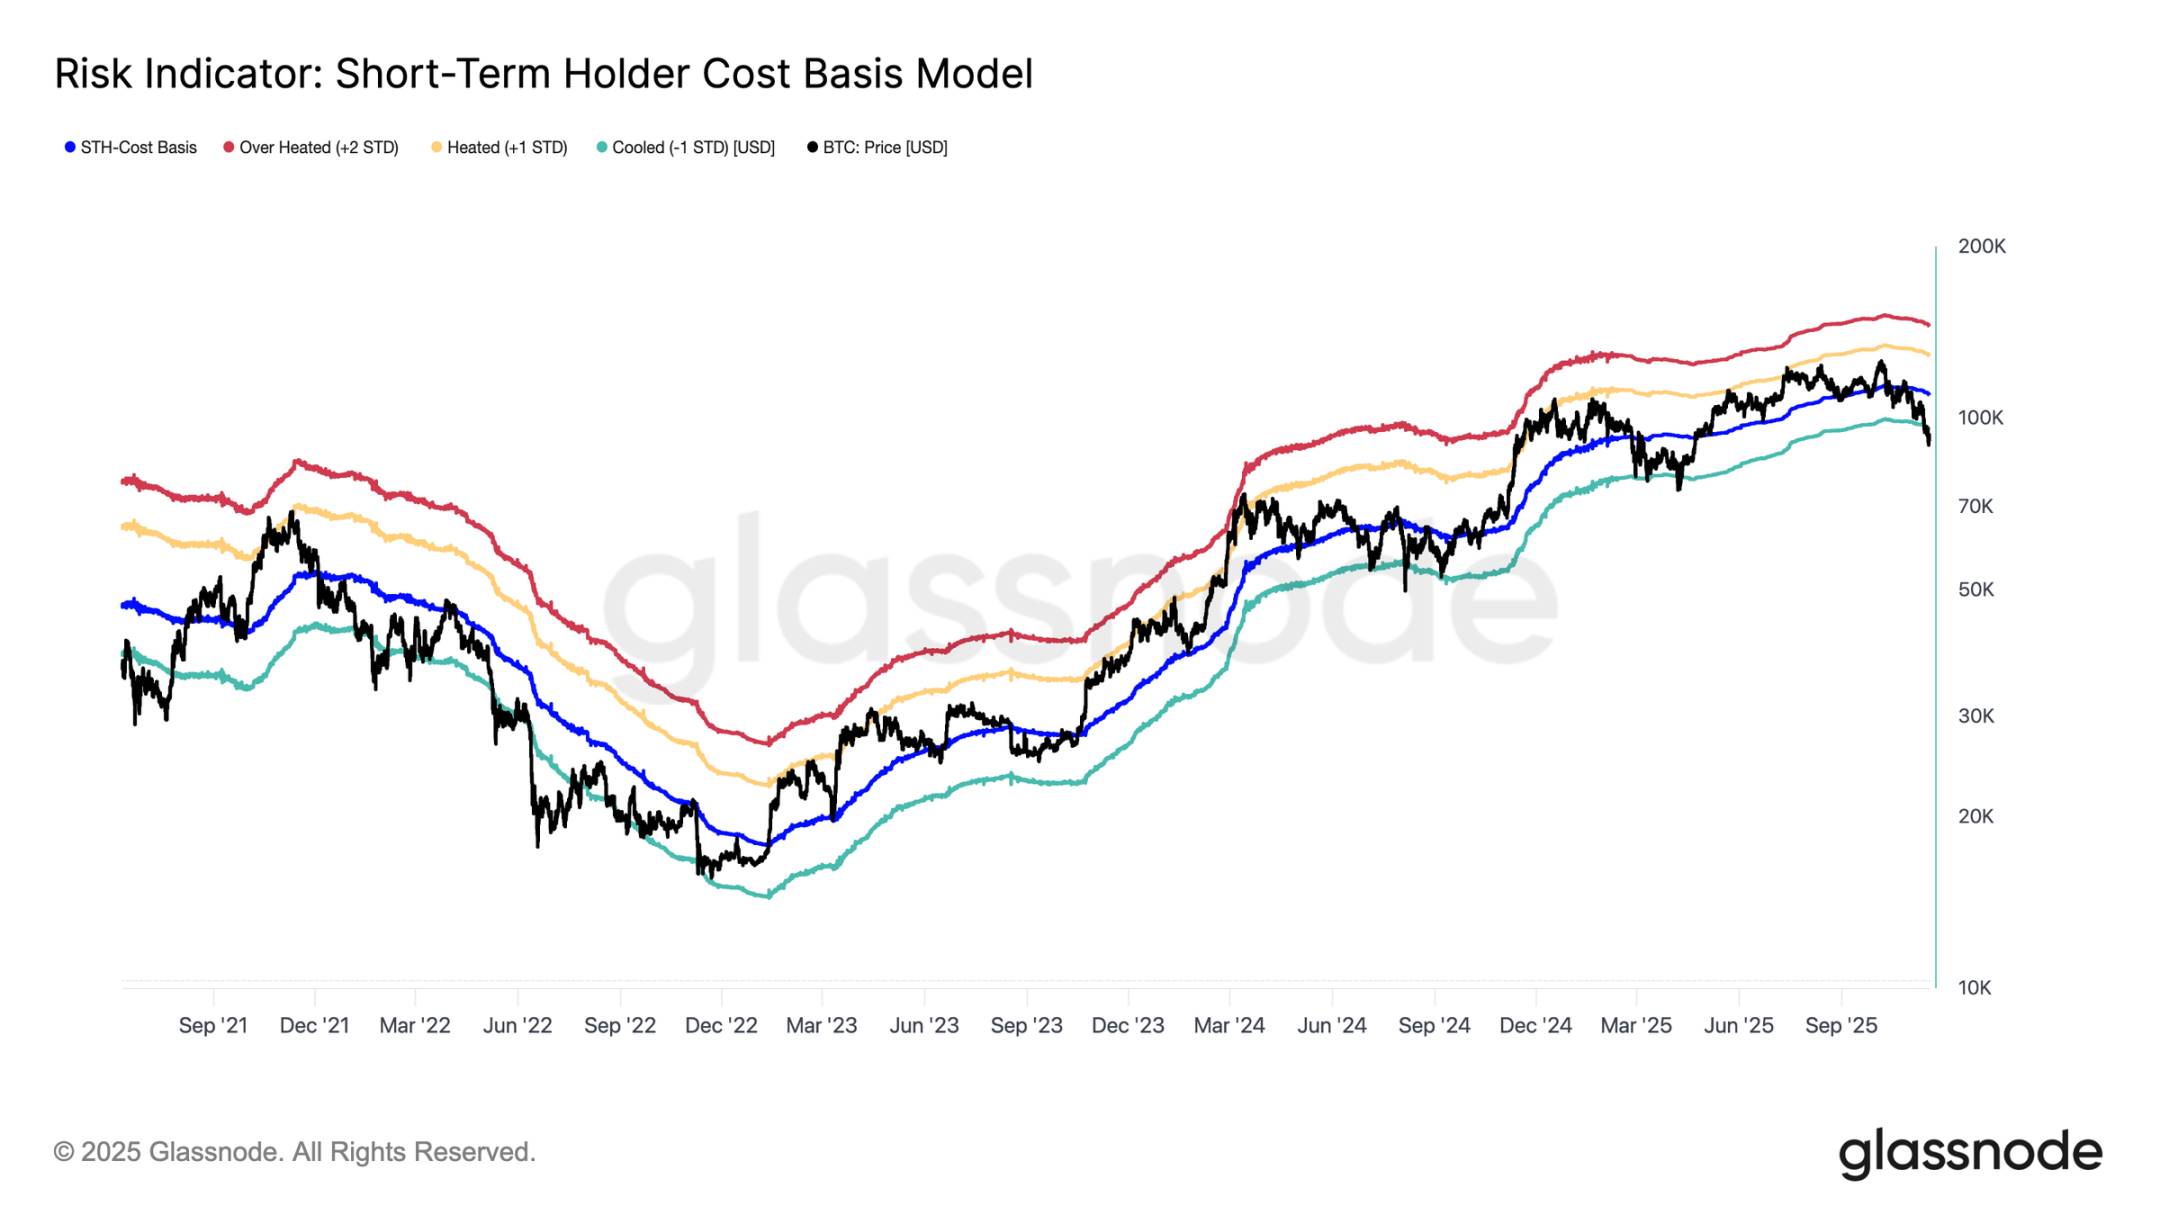
Bitcoin’s break below the lower boundary of last week’s “floating range” at $97K signals increased risk of deeper correction. Price subsequently plunged to $89K, establishing a new local low below one standard deviation under the short-term holder cost basis (currently ~$109.5K), which is approximately $95.4K.
This breakdown indicates that virtually all recently entered investor cohorts are now in loss-making positions. Historically, such conditions have triggered panic selling and weakened market momentum, requiring time to heal. In the near term, the $95K–$97K range will act as local resistance, and reclaiming it would be an initial sign of structural repair.
Panic Selling Peaks
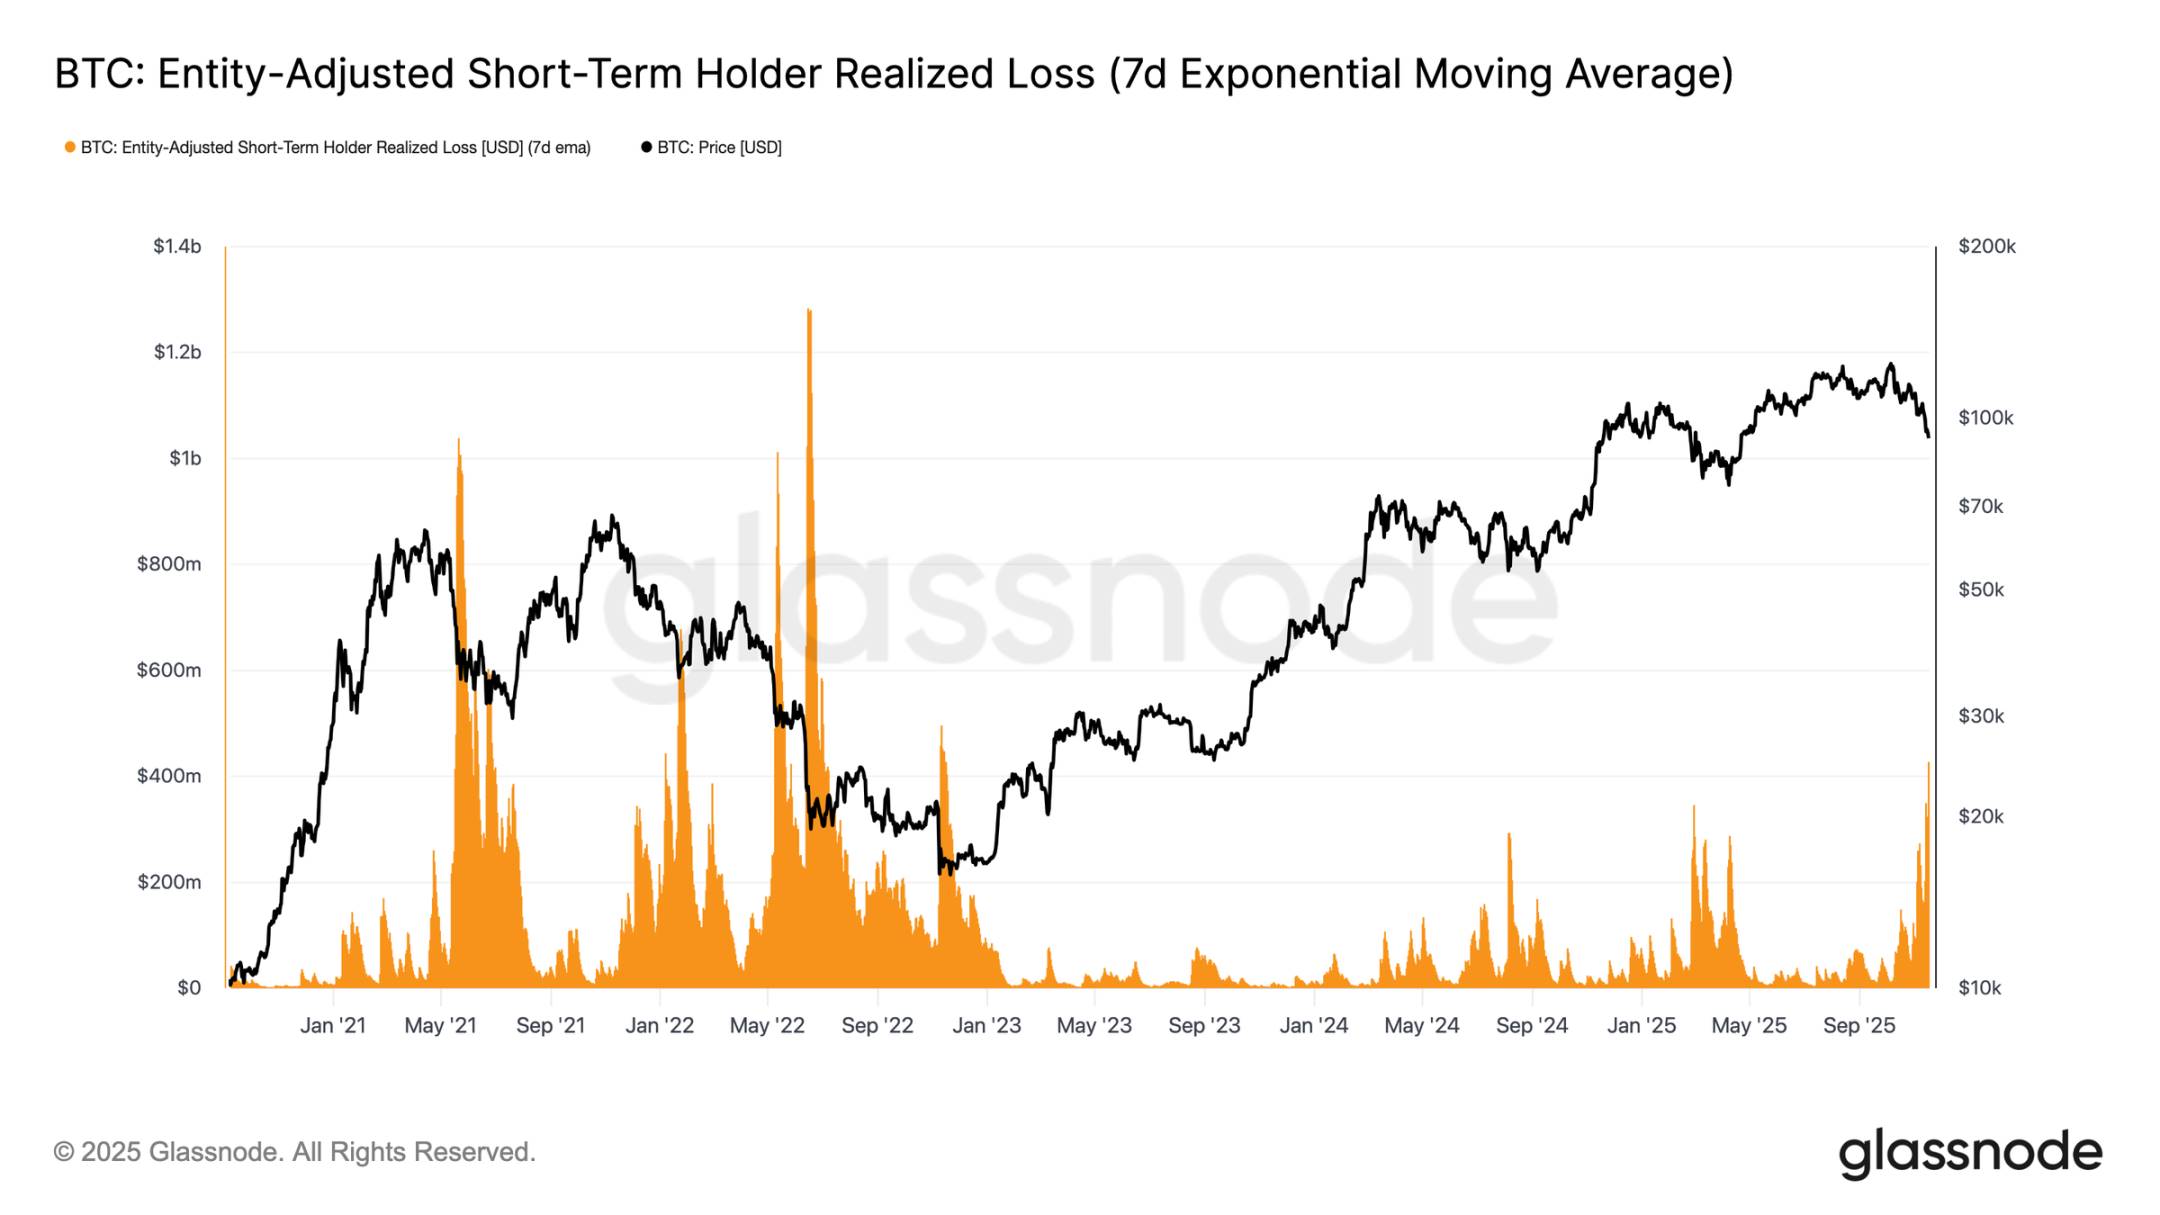
From a behavioral perspective, this drop marks the third time since early 2024 that price has breached below the lower edge of the STH cost basis. However, signs of panic among core buyers are notably stronger this time: the 7-day moving average of realized losses by short-term holders has surged to $523 million per day—the highest level since the FTX collapse.
Such high levels of loss realization highlight the heavy overhead supply structure formed between $106K–$118K, where on-chain concentration far exceeds previous cycle peaks. This implies that either significantly stronger buying pressure is needed to absorb seller supply, or the market must undergo a longer and deeper accumulation phase before equilibrium can be restored.
Testing Active Demand
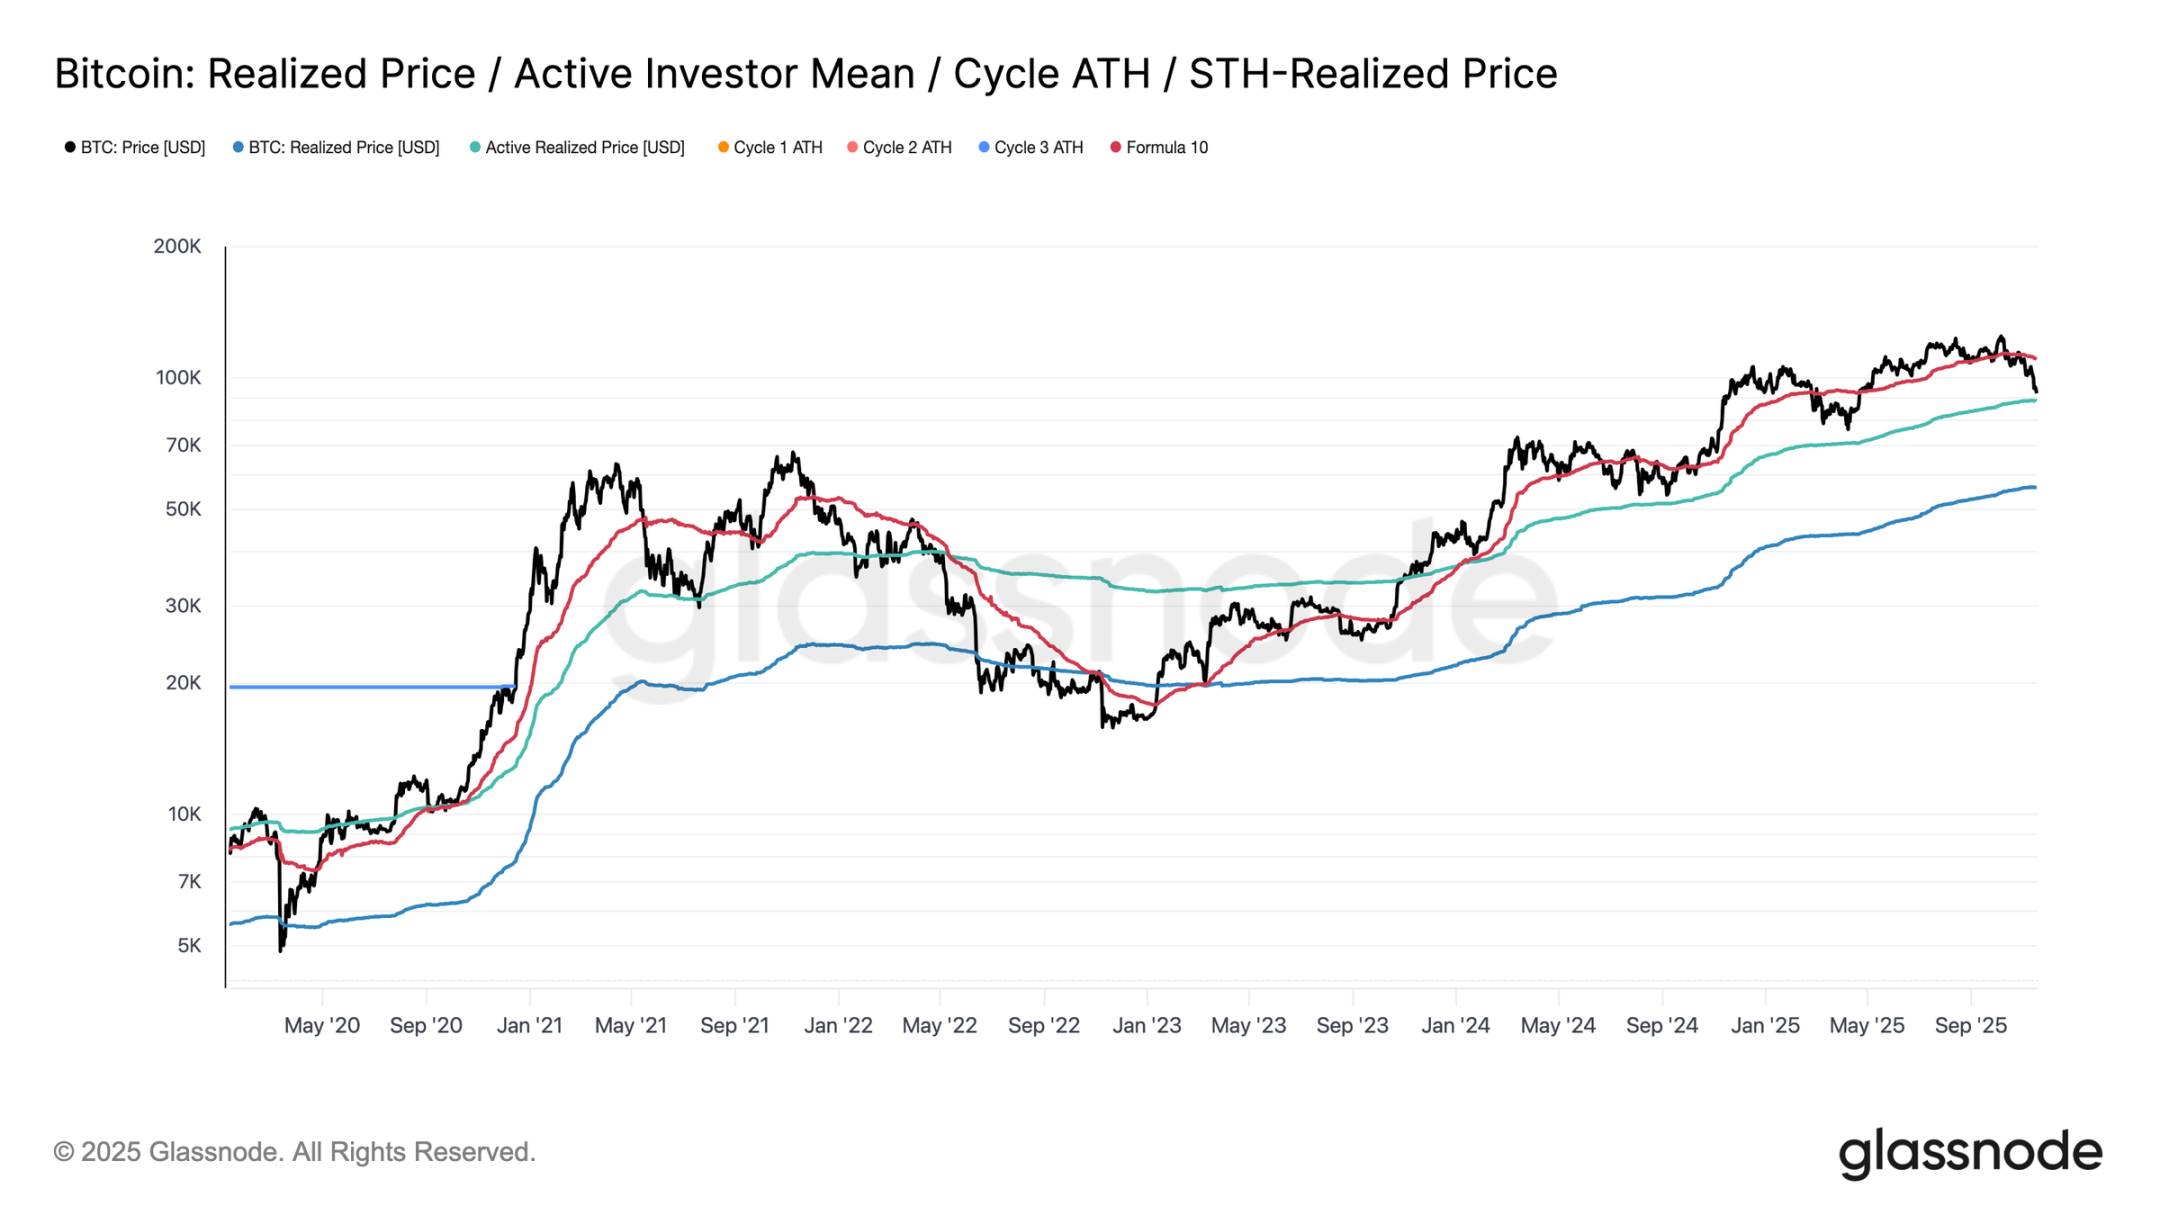
From a valuation standpoint, the market has entered uncharted territory, with speculative interest rising during this mild bear phase. The first major defense zone lies near the realized price of active investors (~$88.6K). Trading around this level reflects the cost basis of non-dormant holders who have actively traded over recent months, making it a potential mid-term trading range.
However, a decisive break below this level would mark the first time in this cycle that price trades below the cost basis of active investors—an unambiguous signal of bearish momentum dominance.
Different Types of Corrections
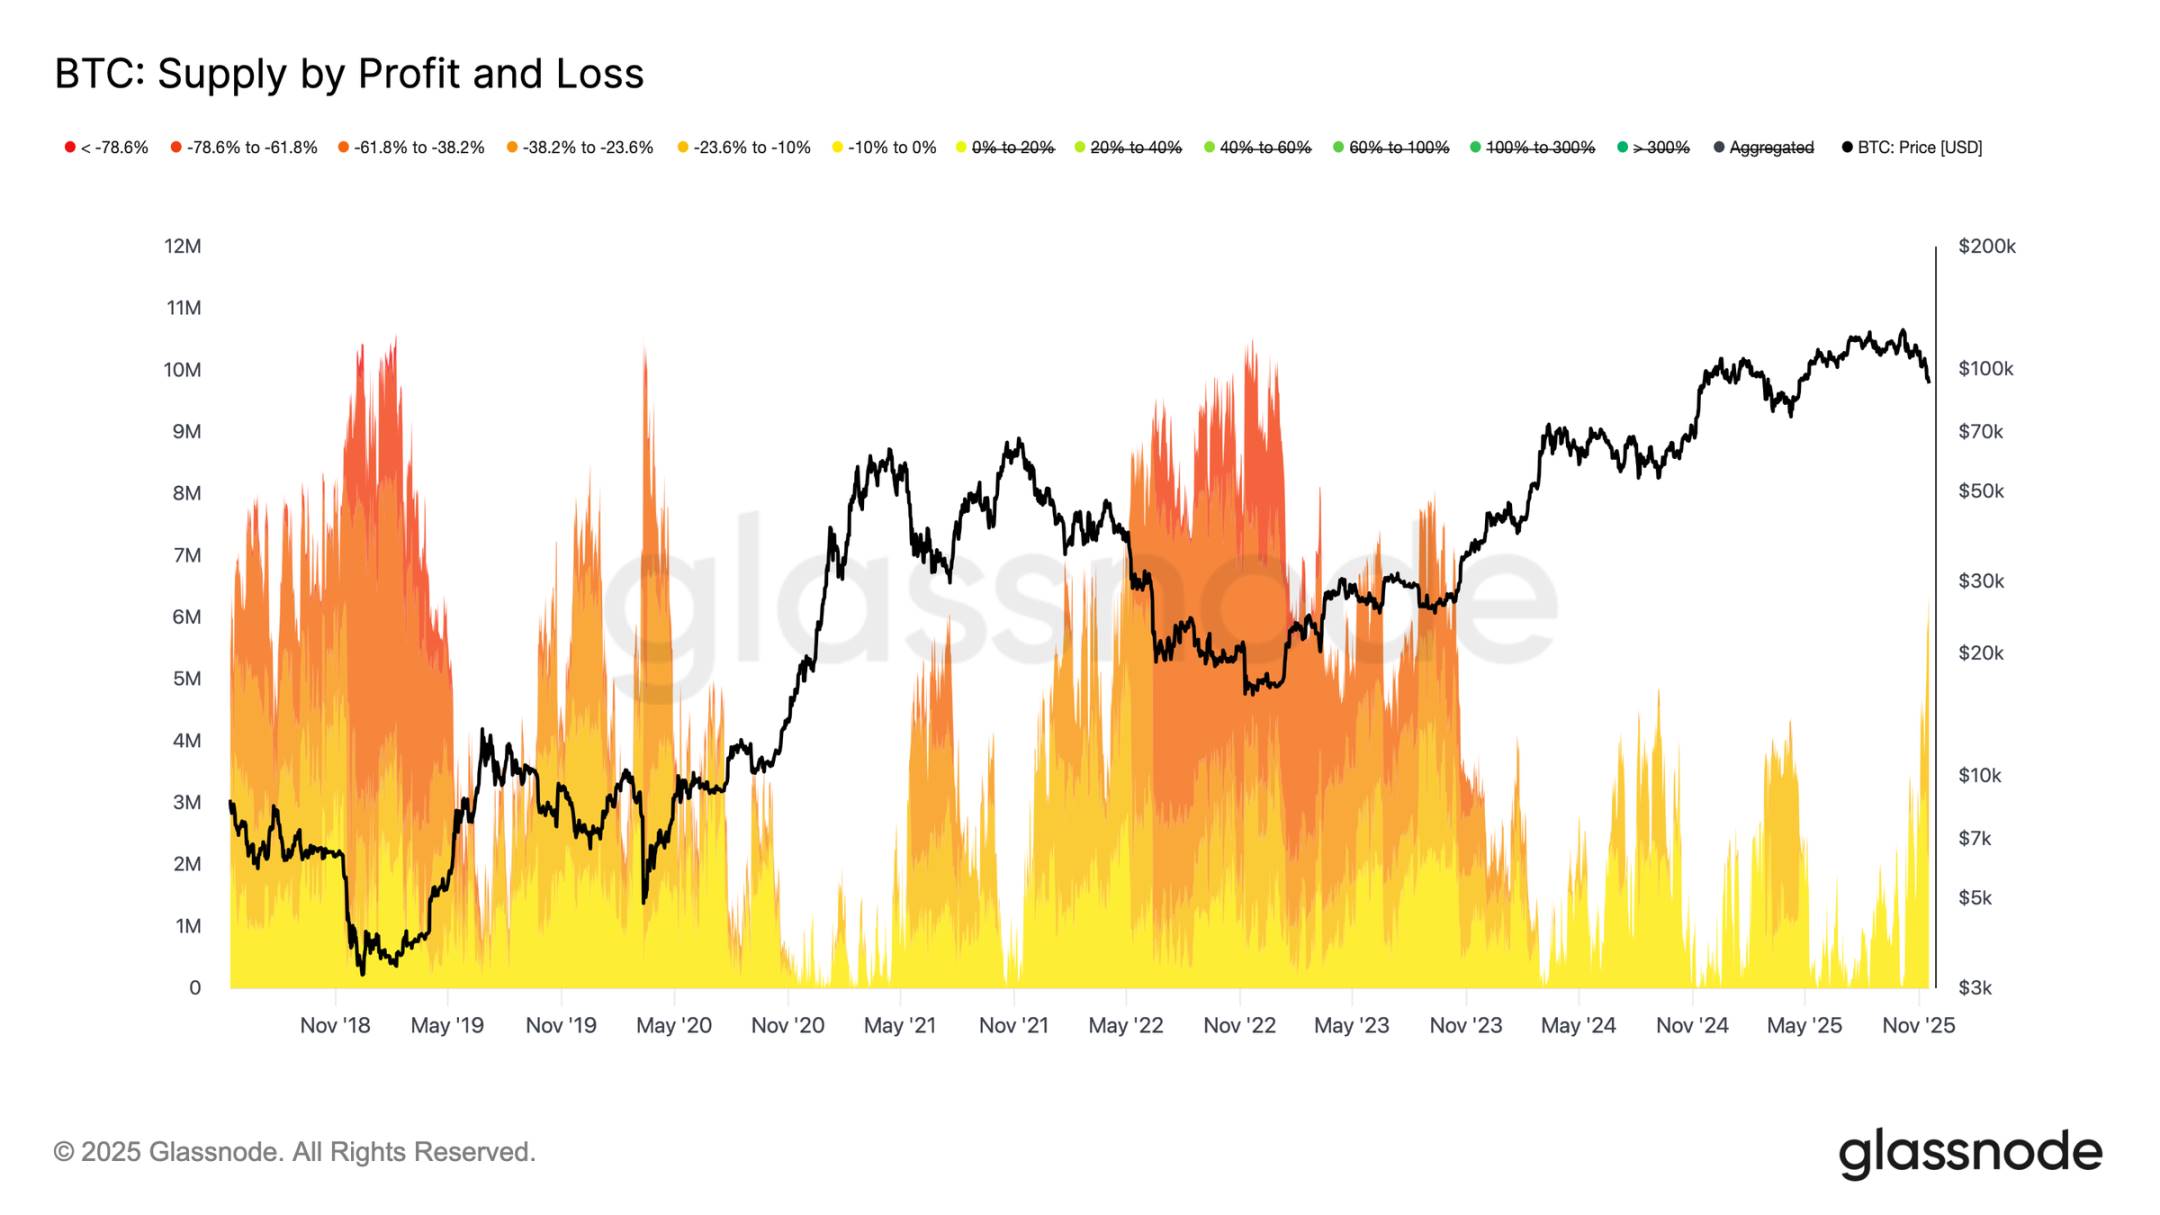
Despite breaking below the primary lower bound of the STH cost basis, the scale and severity of investor losses remain far from the extremes seen during the 2022–2023 bear market. The chart below tracks all currently underwater Bitcoin, grouped by unrealized drawdown magnitude: approximately 6.3 million BTC are now in loss, with most experiencing drawdowns between 10% and 23.6%.
This distribution closely resembles the short-range oscillations seen in Q1 2022 rather than a deep capitulation phase. This is why the range between the active investor realized price ($88.6K) and the true market mean ($82K) may serve as a critical dividing line distinguishing a mild bear phase from the full-blown bear structures of 2022–2023.
Off-Chain Insights
Insufficient ETF Demand
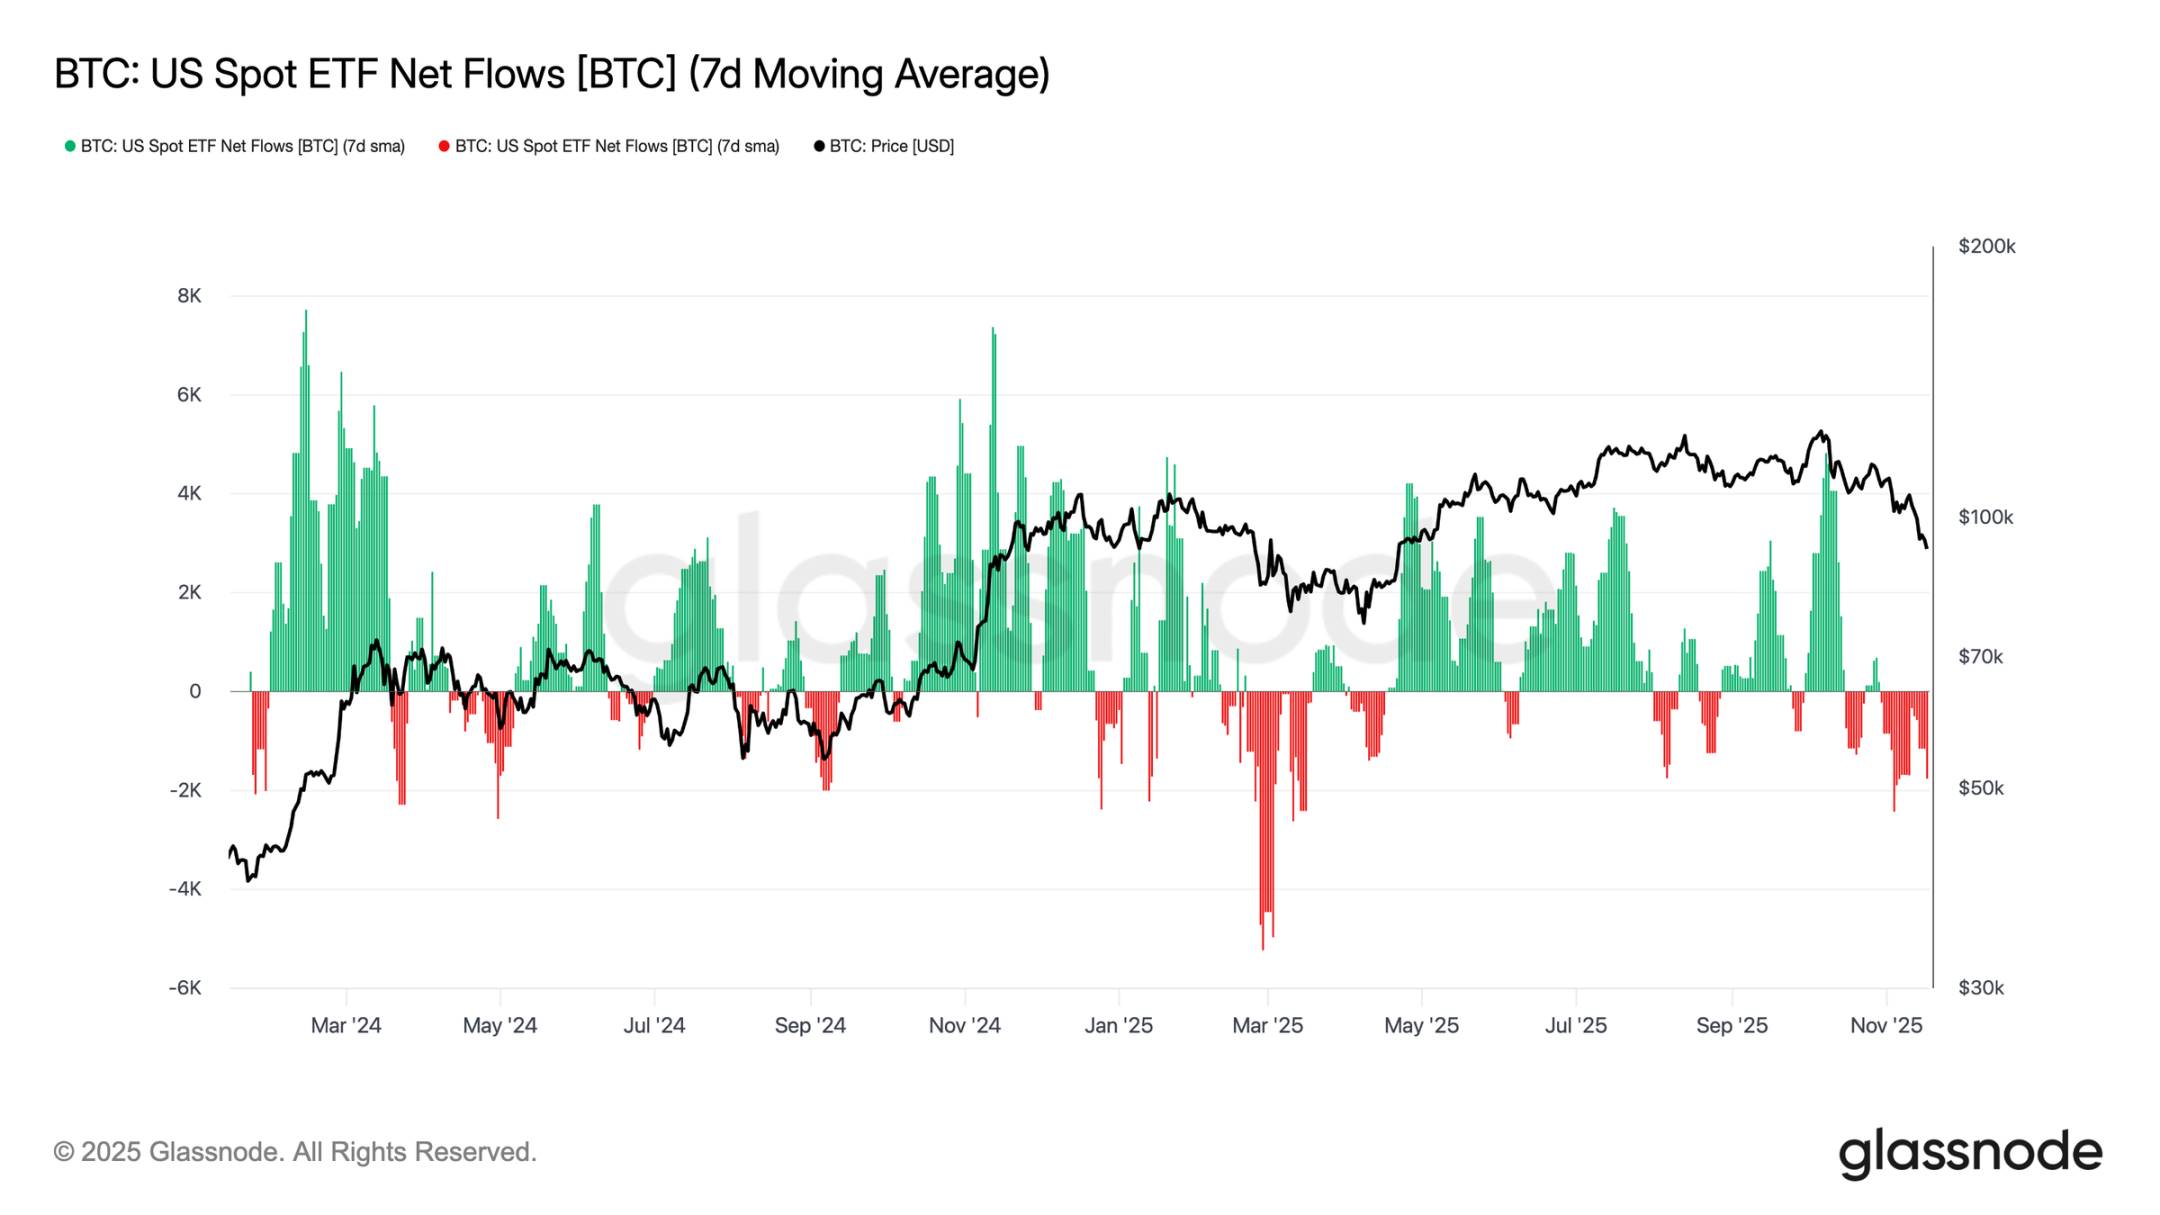
U.S. spot ETF inflows continue to reflect clear demand weakness, with the 7-day average remaining negative in recent weeks. Persistent outflows indicate that traditional financial allocators are unwilling to increase exposure during this pullback—a stark contrast to the strong inflow patterns that previously supported upward momentum. This sustained weakness suggests discretionary allocation appetite has cooled significantly, and one of the market’s largest marginal buyer groups is absent, further reinforcing a constrained demand environment.
The ongoing lack of inflows shows that a key pillar of demand has yet to activate, leaving the market without a core source of fundamental support.
No Signs of Risk Appetite Recovery
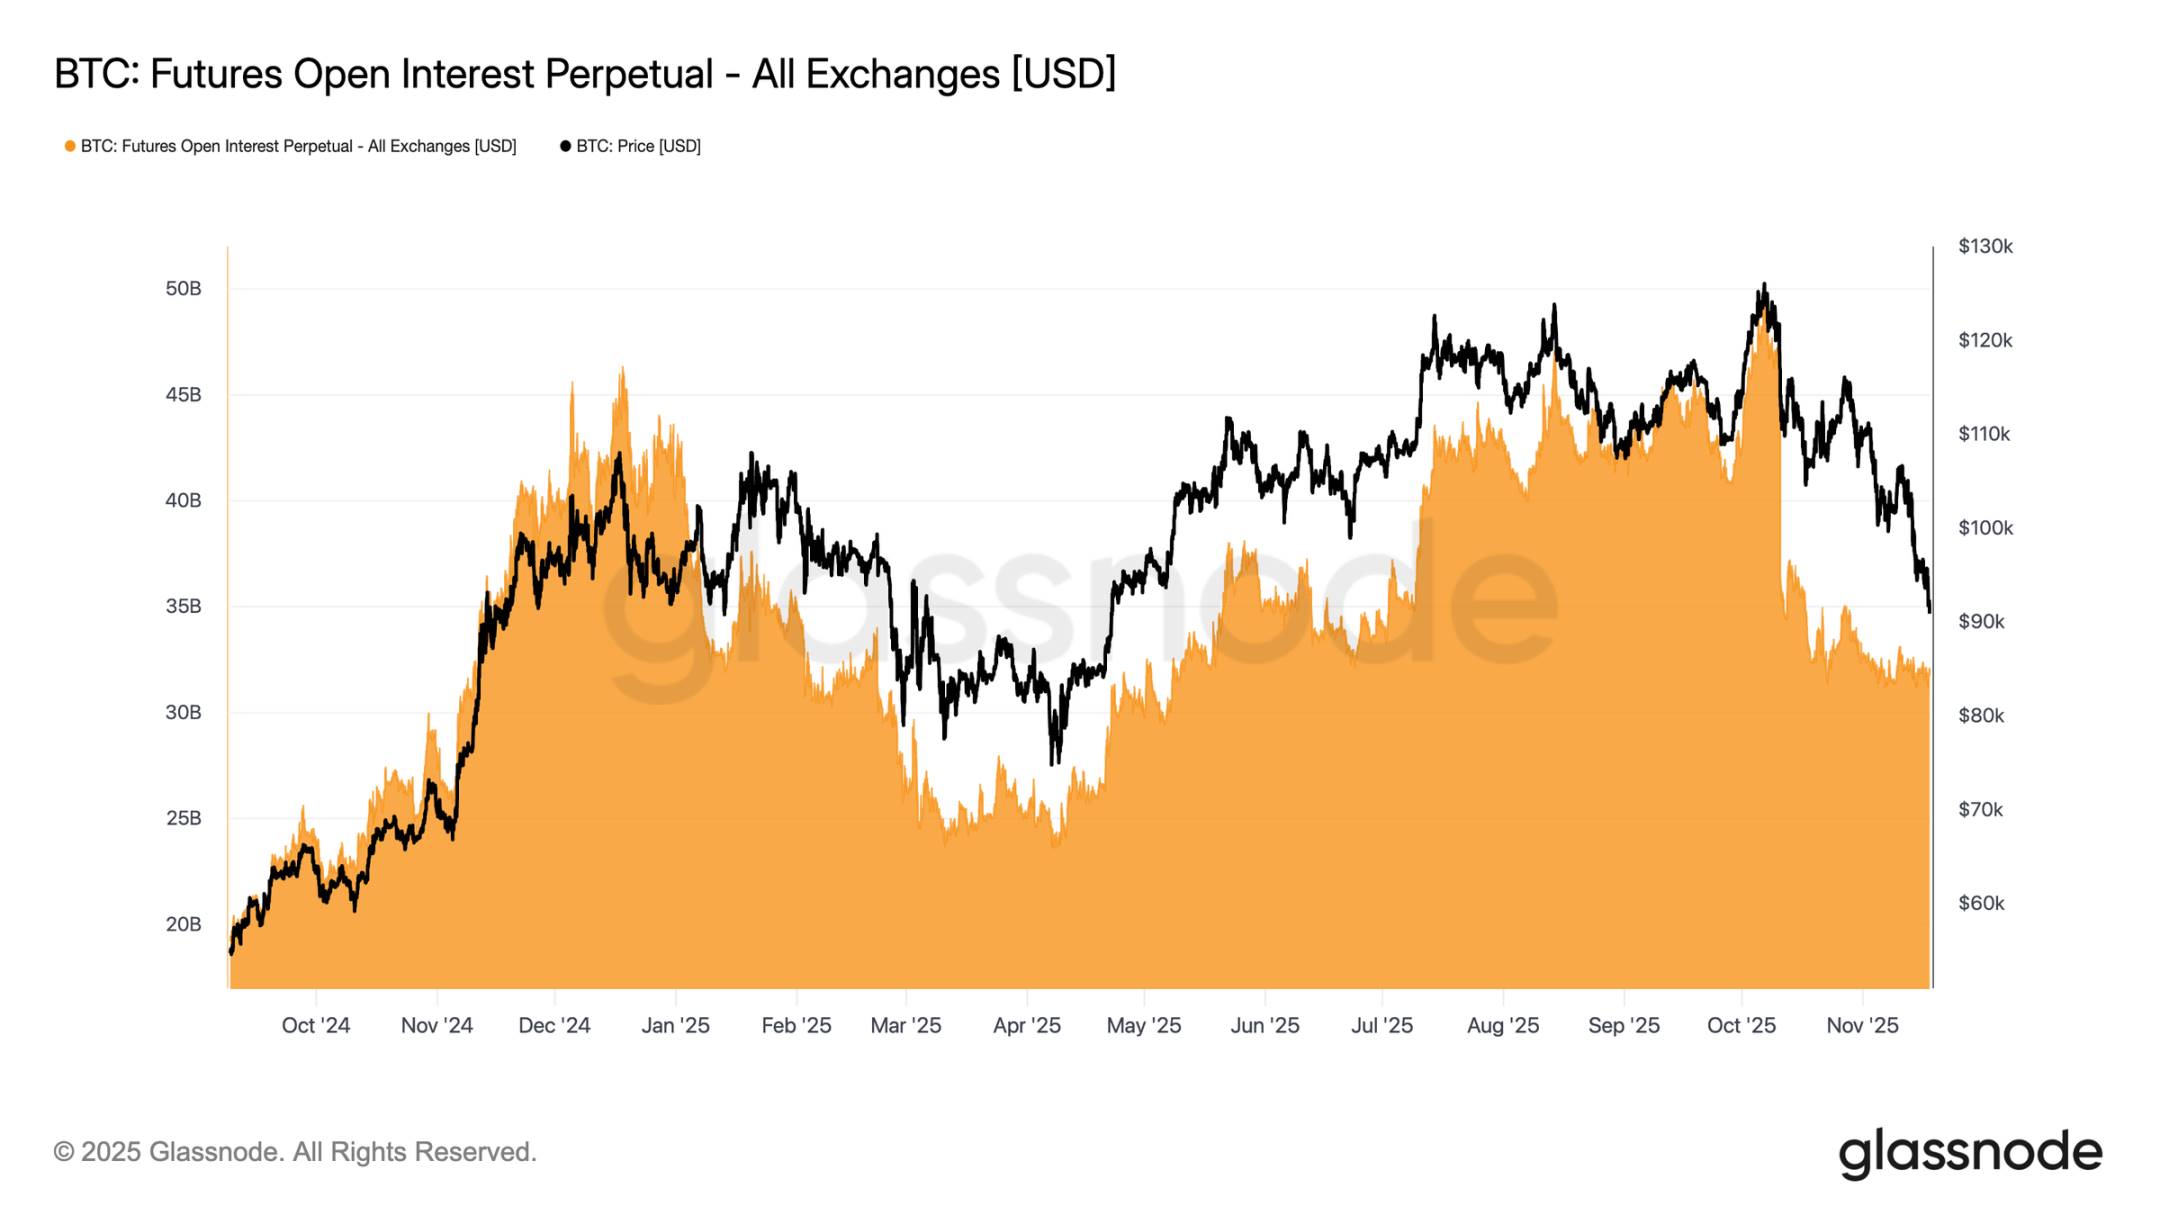
Futures open interest this cycle continues to decline alongside price, reflecting a sustained contraction in speculative activity. Traders are not adding exposure during weakness but are systematically de-risking, resulting in derivative market positions that are notably leaner compared to prior correction phases. The absence of new leverage underscores a cautious stance among market participants, consistent with weakening demand across all risk-taking cohorts.
Continued open interest contraction confirms reluctance to deploy capital, validating the lack of confidence behind current price action.
Funding Rates Hit Cycle Lows
As futures open interest continues to decline, derivatives markets send a clear signal of shrinking speculative positions. Traders are choosing to reduce risk rather than add exposure during weakness, leading to leverage levels on open contracts that are significantly lower than in past correction periods.
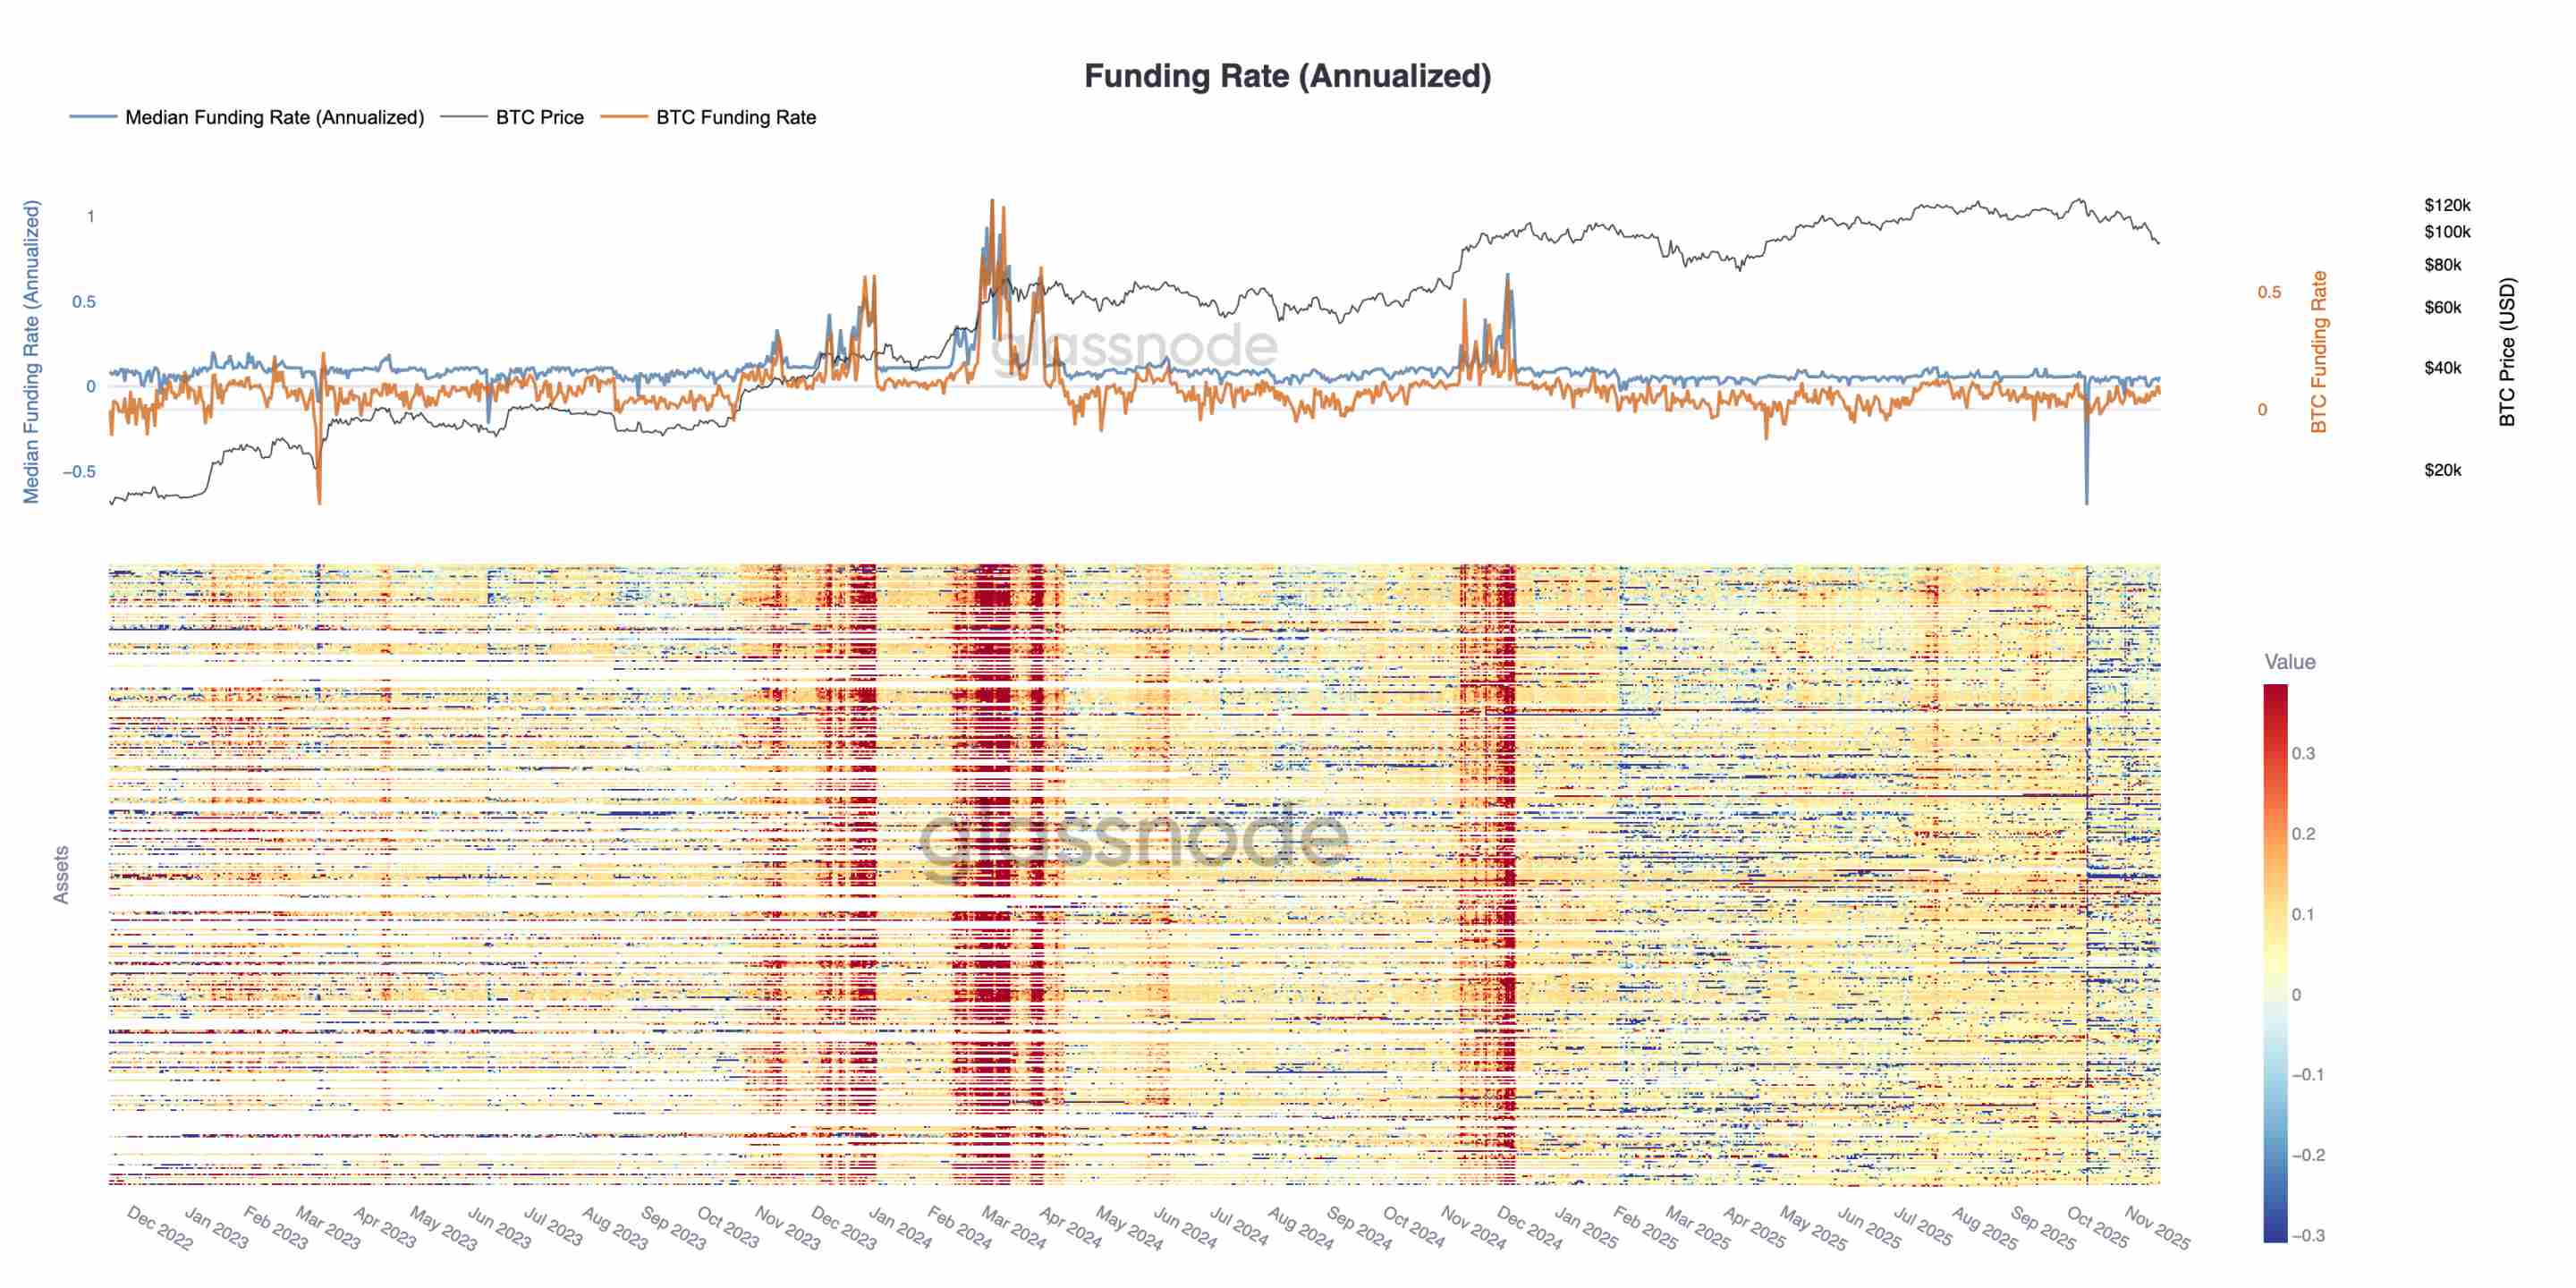
This dynamic is also evident in funding rates: the top 500 assets have clearly shifted into neutral-to-negative territory. Compared to the positive premium seen earlier this year, this shift highlights a broad cooling in leveraged long demand and a structural move toward more defensive positioning.
Declining open interest and negative funding rates together show that speculative leverage is being systematically withdrawn from the market, reinforcing risk-off sentiment.
Implied Volatility Surges
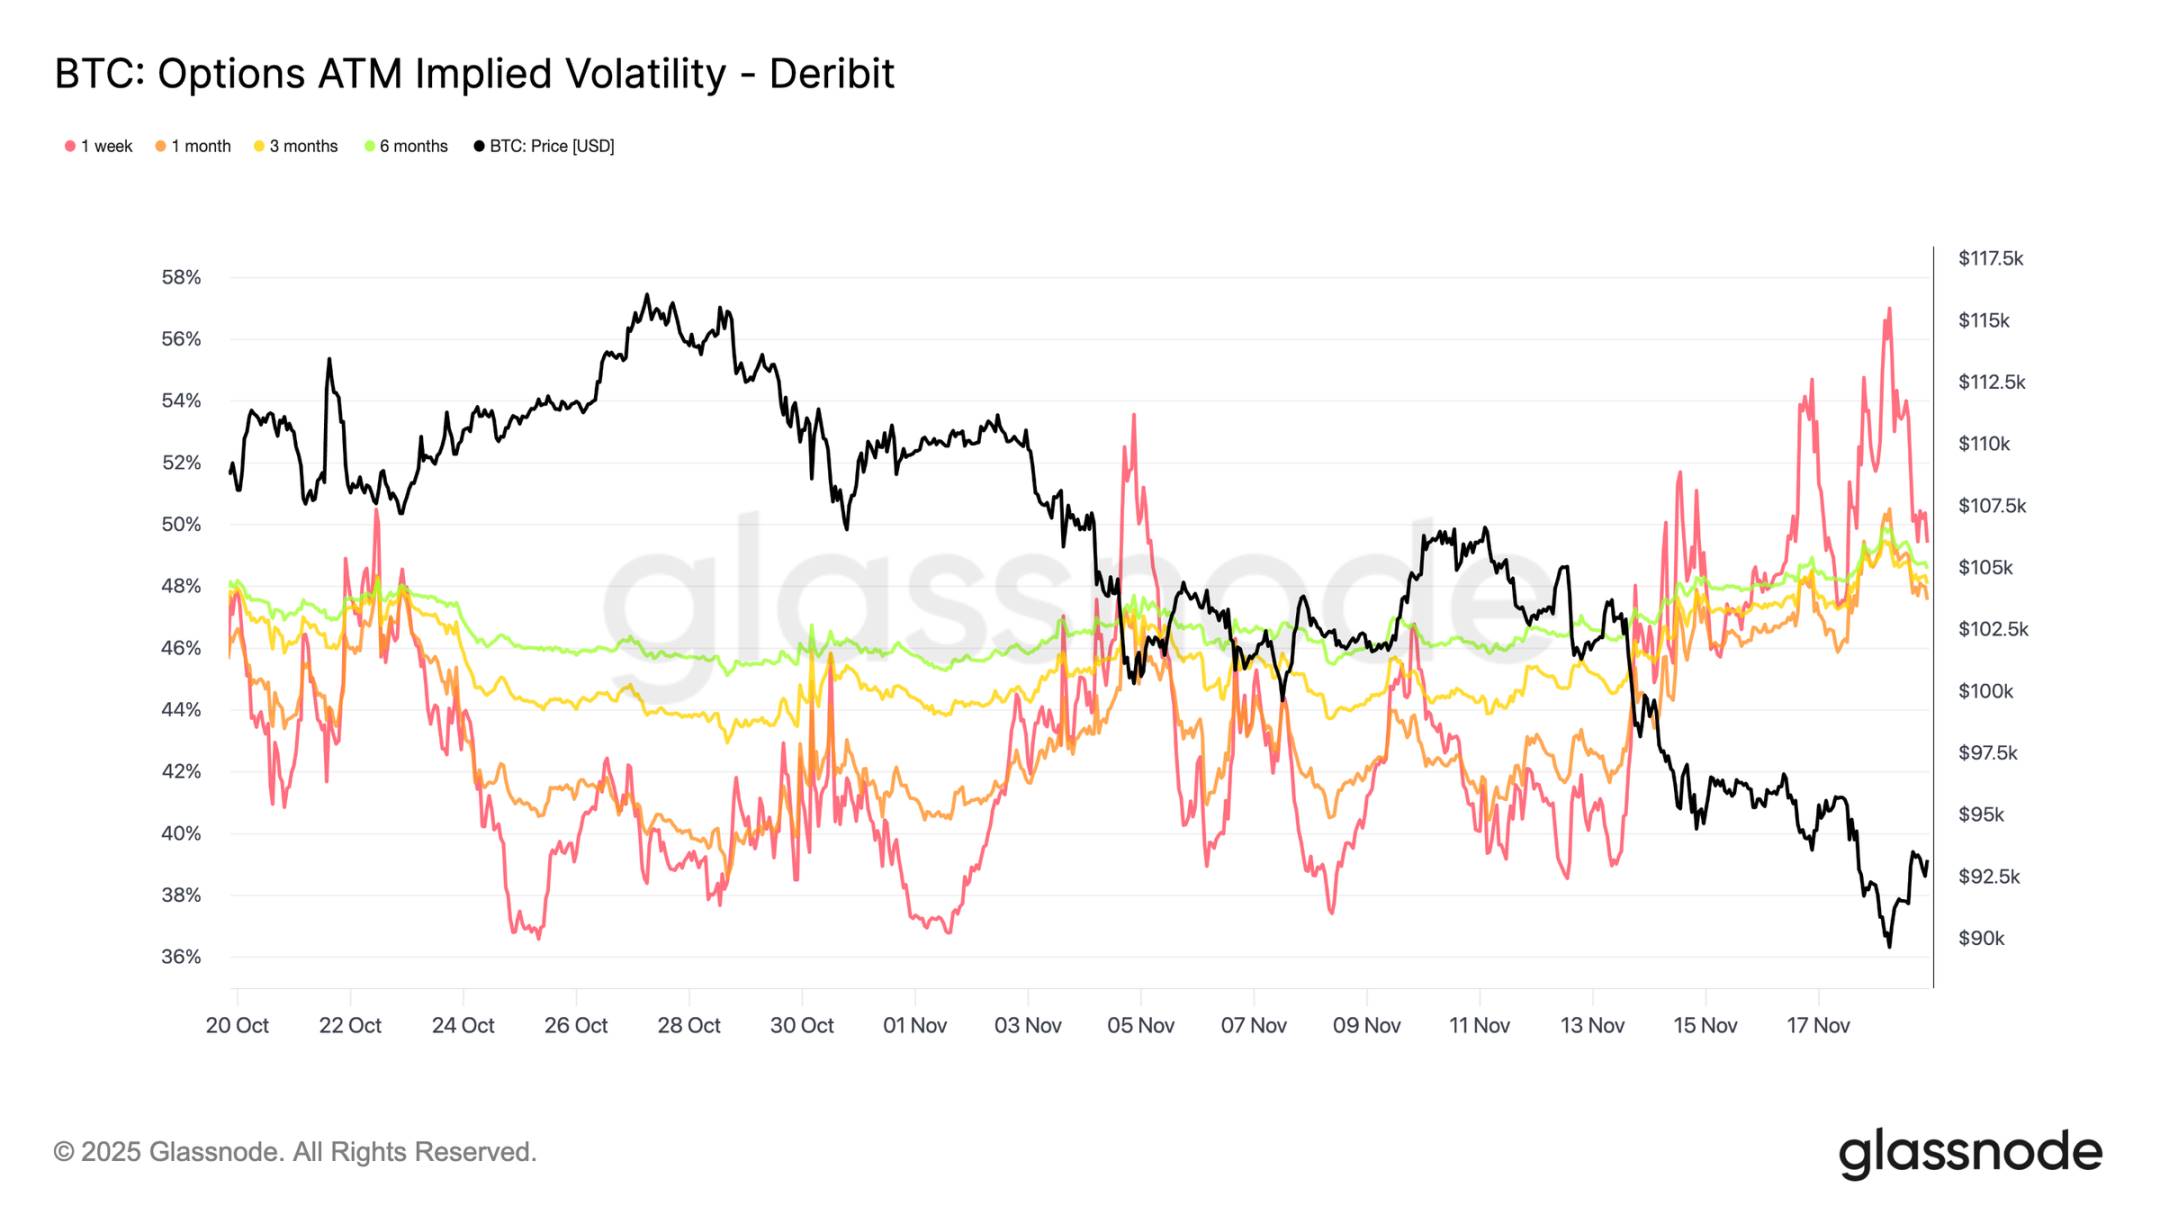
The options market is often the first to reprice risk. After Bitcoin briefly dropped below $90K, the options market reacted swiftly: implied volatility rose sharply across all maturities, with the strongest reaction in short-dated contracts. The chart shows a clear rebound in short-term volatility and a broad repricing across the entire volatility curve.
This surge is driven by two factors: first, increased demand for downside protection as traders prepare for larger drawdowns; second, responses from gamma-short traders. Many traders were forced to buy back shorted options and roll their positions upward, mechanically pushing up short-term implied volatility.
Current implied volatility has approached levels seen during the October 10 liquidation event, demonstrating how quickly traders are reassessing short-term risk.
Skew Confirms Panic Sentiment
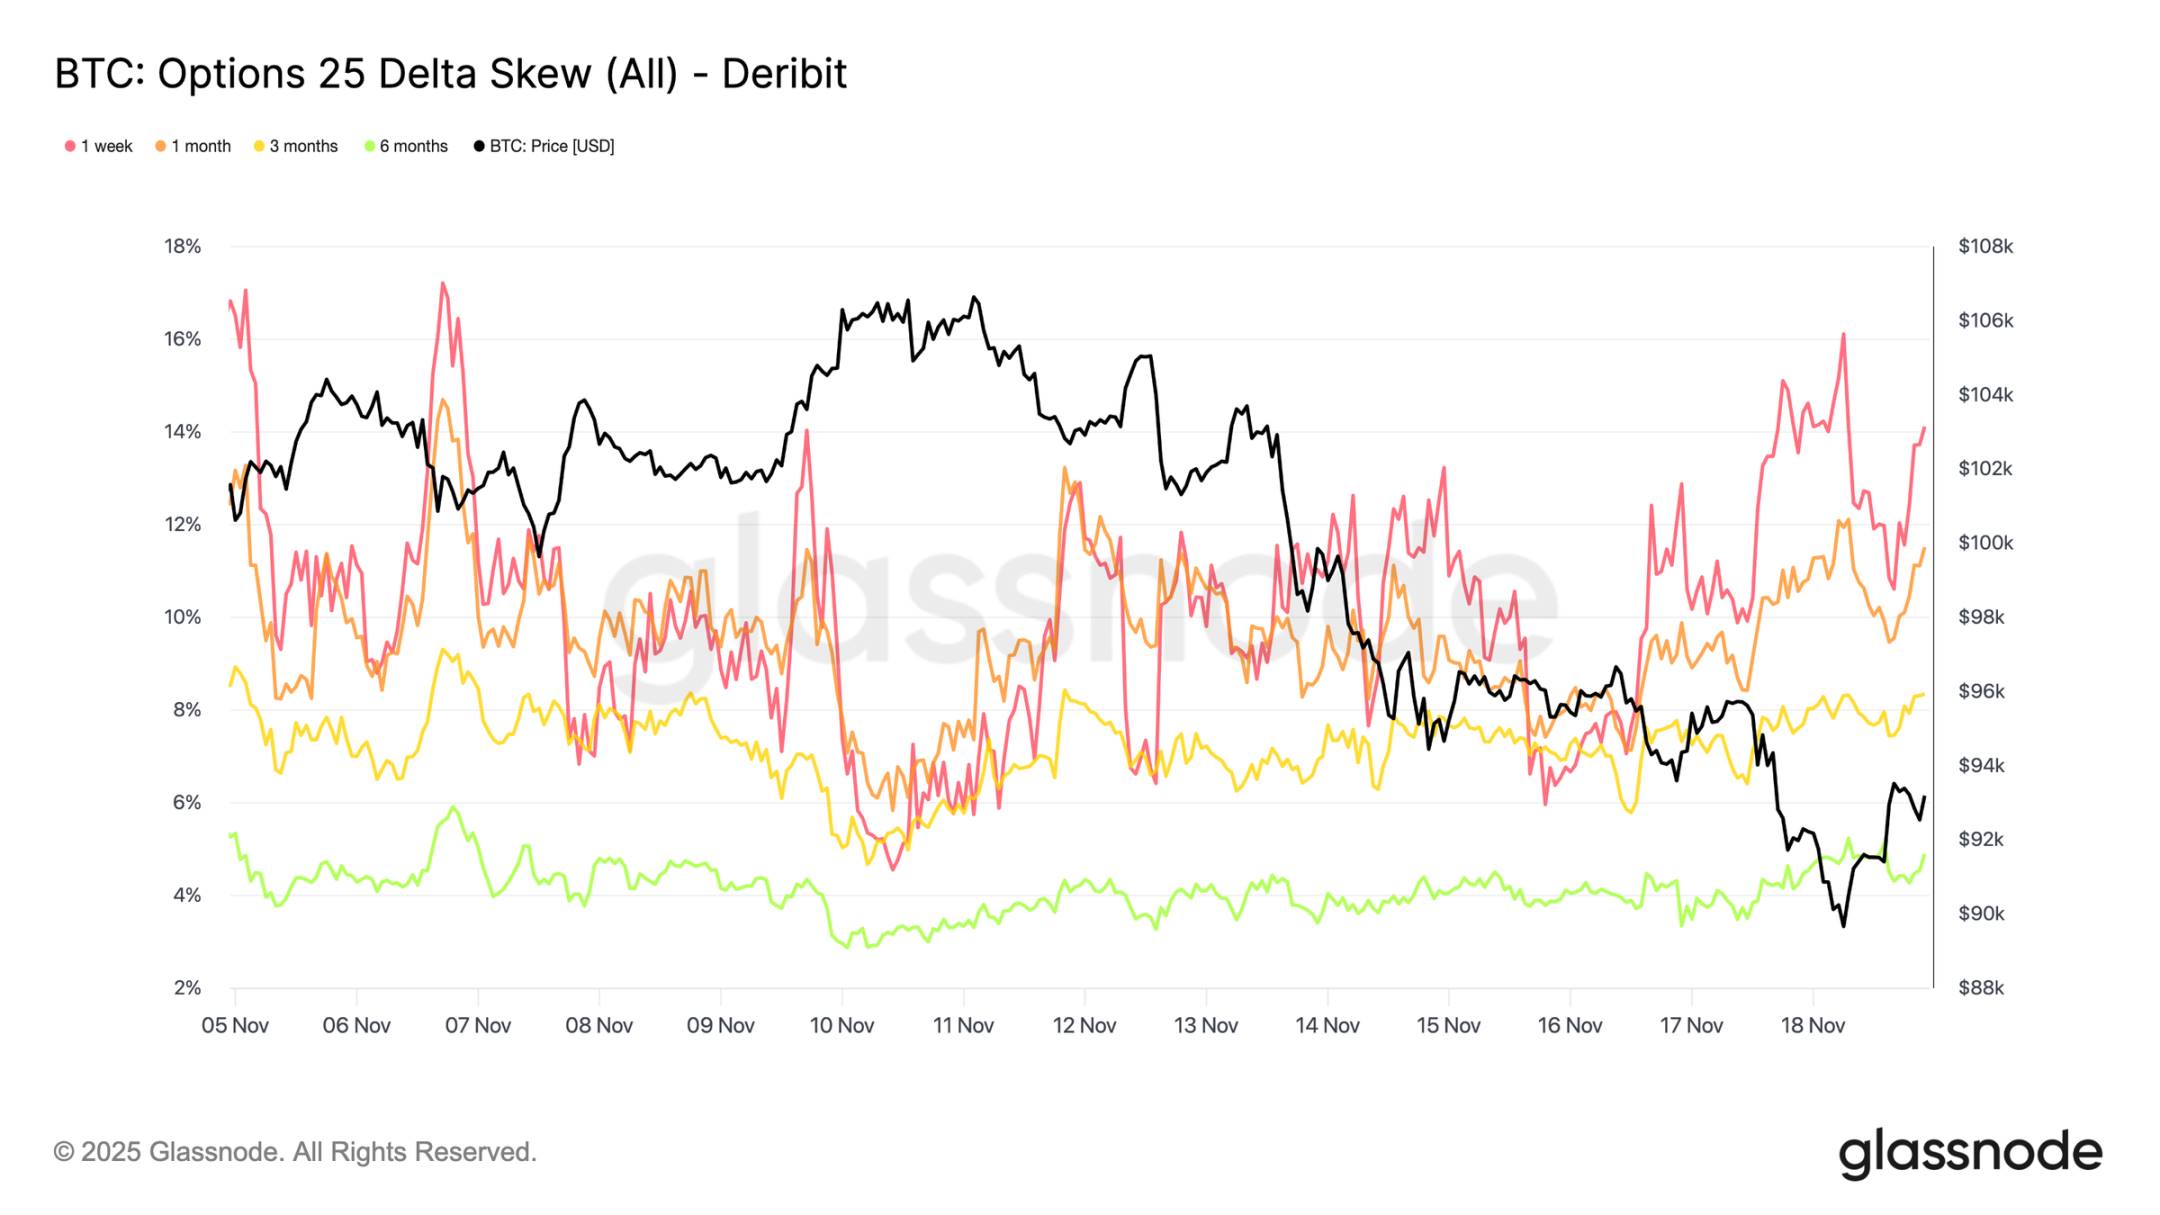
Moving from implied volatility to skew metrics, the options market sends the same message: 25-delta skew across all tenors remains negative, with the one-week skew approaching extreme bearish levels. (Note: Skew measures market sentiment and risk appetite by comparing implied volatility differences between different strike prices. The 25 Delta Skew quantifies the volatility skew by comparing the implied volatility of 25 Delta puts versus 25 Delta calls.) The one-week put premium stands at ~14%, indicating traders are willing to pay a higher price for downside protection regardless of spot price movements.
This behavior can become self-fulfilling: when traders buy these puts, market makers often become delta short. To hedge this exposure, they sell futures or perpetual contracts, creating downward pressure that may amplify the very downside moves traders aim to protect against.
Longer-term skew is also bearish but more moderate: the six-month skew is slightly below 5%, suggesting concerns are concentrated in the short term rather than across the entire curve.
Strong Demand for Downside Protection
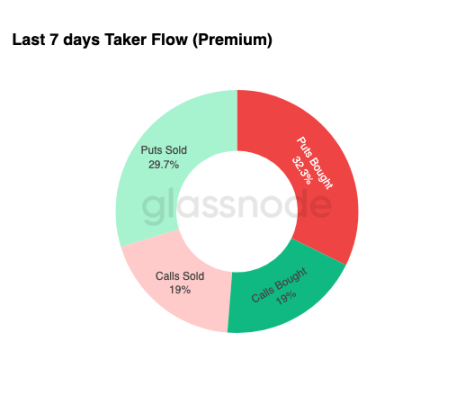
Moving from skew to actual trading activity, capital flows over the past seven days confirm the same pattern. Traders have bought large amounts of put option premium, far exceeding call demand. This aligns with hedging behavior, showing a preference for guarding against further declines rather than betting on upside.
Limited activity on the call side indicates traders are reluctant to take meaningful risk exposure before year-end. Both buying and selling of call options remain low relative to put-side flows, supporting the view that caution—not speculation—dominates positioning.
Overall, this combination of capital flows suggests the market is preparing for higher volatility and favors defense over exposure expansion.
$90K Strike Put Premium
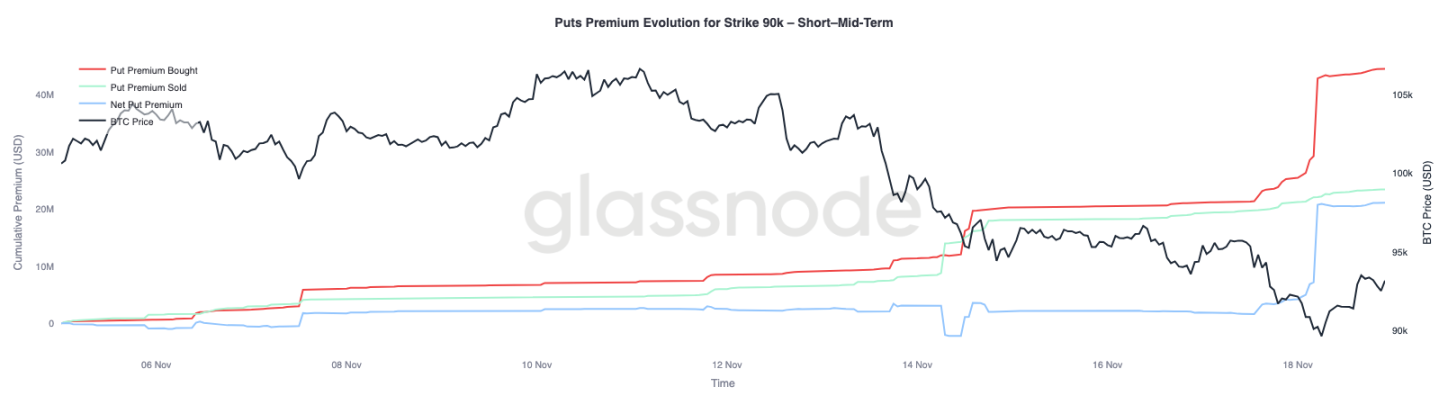
Narrowing from broad capital flow data to specific strikes, the $90K put option premium reveals accelerating demand for protection as prices weaken. Over the past two weeks, net put premium at this strike was balanced until Bitcoin broke below $93K. Once that support level failed, traders began actively bidding up these puts, driving a sharp rise in the $90K strike’s buy-side premium.
This behavior shows that as spot selling pressure intensifies, traders are willing to pay increasingly higher prices for downside protection. This trend also aligns with the previously observed rise in short-term implied volatility.
The significant repricing of $90K puts highlights how downside hedging activity accelerates when key price levels break.
Pricing Market Fragility
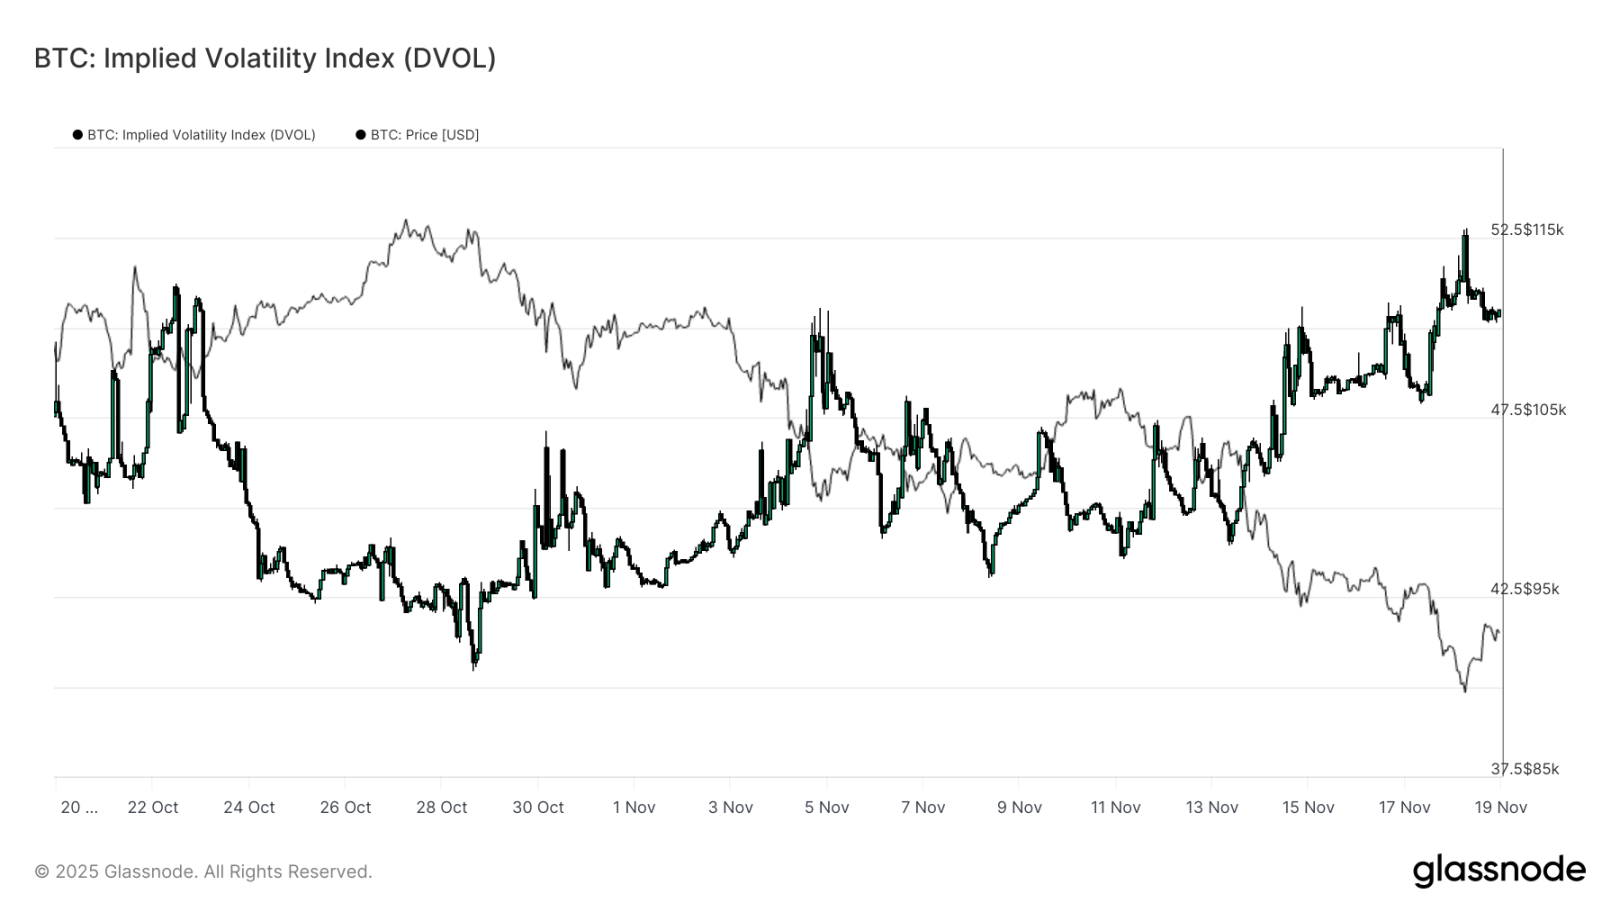
Shifting from individual strikes to broader volatility indicators, the DVOL index reveals the extent of risk repricing: it has rebounded from ~40 three weeks ago to nearly 50—a monthly high. DVOL reflects implied volatility across a fixed-term basket of options, so its rise means traders expect greater future price volatility.
This uptrend consolidates all observed options market dynamics: rising implied volatility across tenors, persistently negative skew, delta-negative capital flows in recent weeks, and minimal willingness to increase risk exposure before year-end. Together, these factors paint a picture of a market preparing for unstable price action, driven by perpetual contract liquidation risks, macro uncertainty, and the absence of strong spot demand from ETF inflows.
The next potential catalyst to shift this volatility regime is the Federal Open Market Committee meeting in three weeks. Until then, the options market will likely maintain cautious signals and a clear preference for defensive positioning.
The rise in DVOL further indicates the market is preparing for larger future swings, with traders adjusting positions around volatility.
Conclusion
Bitcoin remains in a challenging market phase characterized by weakening market structure, fading speculative demand, and a broad shift in derivatives toward risk-averse positioning. Spot demand remains absent, ETF inflows are negative, and the futures market shows reluctance to add leverage during weakness. At the same time, rising implied volatility, negative skew, and hedging flows all point to increasing short-term downside risk, with investors paying ever-higher premiums for protection. These dynamics collectively define a "search-for-stability" market environment. Future direction will depend on whether demand re-emerges near key cost basis levels or if current market fragility evolves into a deeper correction or full bear market.
Join TechFlow official community to stay tuned
Telegram:https://t.me/TechFlowDaily
X (Twitter):https://x.com/TechFlowPost
X (Twitter) EN:https://x.com/BlockFlow_News
 @glassnode