Mayer Multiple and MVRV Z-Score as Bitcoin Top Indicators: History and Outlook
TechFlow Selected TechFlow Selected
Mayer Multiple and MVRV Z-Score as Bitcoin Top Indicators: History and Outlook
Review the historical performance of these two indicators and provide market insights based on current readings.
 Navigating Web3 tides with focused insights
Author: 0xYYcn (Bitfox Research)
Introduction
Bitcoin resumed its upward trend on August 13, breaking its all-time high. Ethereum (ETH) soon followed, approaching $5,000, while Solana recently surpassed the key resistance level of $215. However, since then, the market has shown a continuous pullback. This raises an important question: Will BTC, ETH, and SOL see another wave of gains? When will the peak of this cycle arrive?
Two widely watched indicators used to assess whether Bitcoin is overvalued or entering a bubble phase are the Mayer Multiple (MM) and the MVRV Z-Score.
Both indicators have strong historical track records in technical and on-chain analysis, often used to identify overheated markets prior to major corrections. This article reviews their historical performance and provides market insights based on current readings.
Core Indicators
Mayer Multiple (MM): The Mayer Multiple is the ratio of Bitcoin’s current price to its 200-day moving average price.
● MM > 1 → Bullish (price above long-term trend)
MM < 1 → Bearish (price below long-term trend)
● MM >> 2 → Entering speculative bubble territory
In this analysis, 2.2 is set as the overheating warning threshold.
MVRV Z-Score (Z): The MVRV Z-Score compares Bitcoin’s market value to its realized value (the aggregate cost basis of all circulating coins), normalized by the market’s historical volatility.
● High Z → Market cap far exceeds realized value, indicating investors hold large unrealized profits (common at cycle tops).
● Low or negative Z → Market trading below overall cost basis (common during undervaluation or capitulation phases).
In this analysis, 5 is set as the overheating warning threshold.
Backtesting Methodology
We applied these two indicators to 11 recognized major Bitcoin correction periods. For each period, we defined a "correction window" covering one month before the event and the event month itself. Using daily data, the rules are:
● A day is considered a signal when MM > 2.2 or MVRV Z-Score > 5.
● If at least one signal occurs within a correction window, the correction is considered captured.
We then calculated the hit rate (number of captured corrections ÷ total corrections) and analyzed sensitivity (frequency of signals occurring outside correction windows).
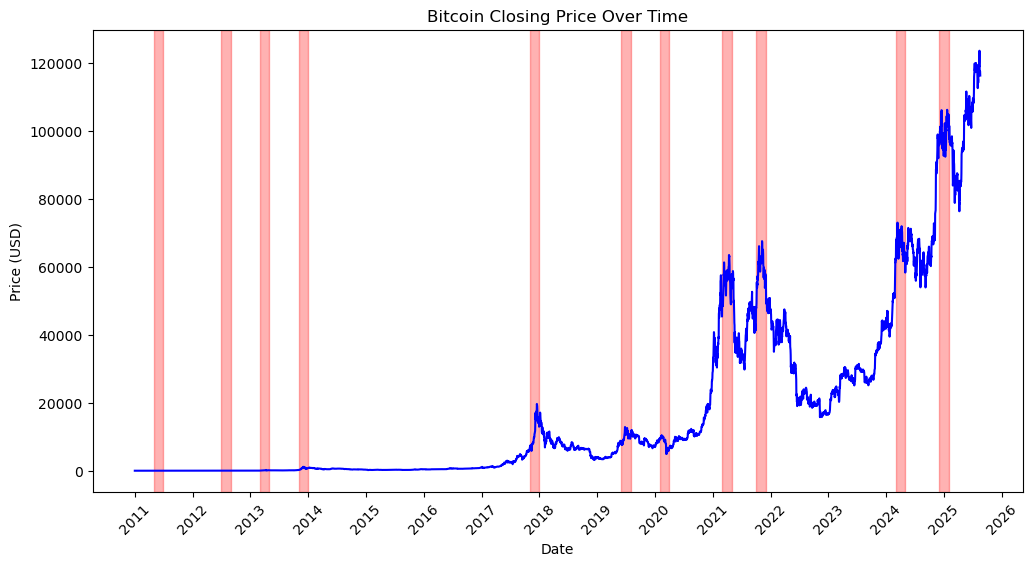
Bitcoin price and major correction windows as of August 18, 2025 (Data source: Bitfox Research)
Mayer Multiple: Identifying Overheated Markets
The Mayer Multiple reflects price levels relative to the long-term mean. Historically, values significantly above 2 often indicate Bitcoin trading at a substantial premium, typically driven by speculation.
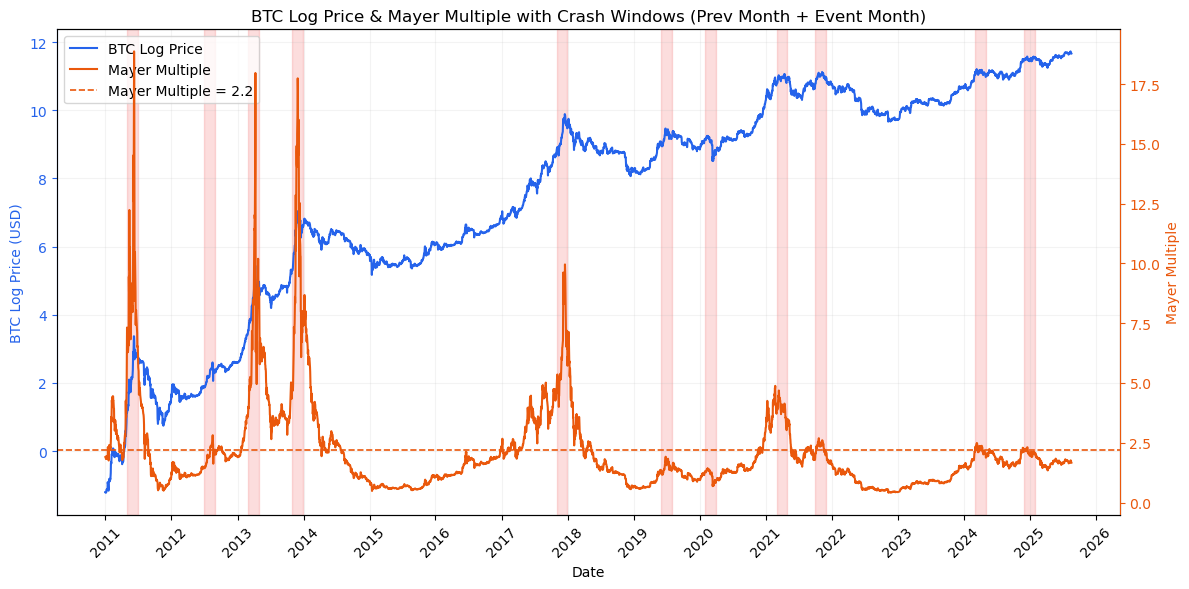
Bitcoin log price vs. Mayer Multiple and its 2.2 threshold (as of August 18, 2025, Data source: Bitfox Research)
● Performance: At the 2.2 threshold, MM captured 9 out of 11 major corrections (82% hit rate).
● Accuracy: Successfully identified classic cycle tops (2011, twice in 2013, 2017, twice in 2021, and early 2024 and 2025 tops).
● Misses: July 2019 (mid-cycle correction) and March 2020 (liquidity shock due to pandemic).
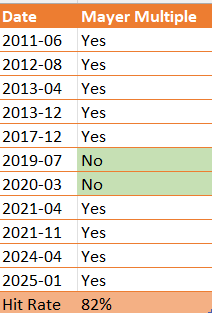
Mayer Multiple: Historical performance identifying market tops (2011–2025)
Strengths: Highly robust in identifying overheated markets.
Weaknesses: Often triggers early—if investors exited at the first >2.2 reading, they would have missed most of the bull runs in 2013 and 2017. MM works better as a bubble warning system than a precise exit signal.
MVRV Z-Score: Measuring Market Bubbles with On-Chain Data
The MVRV Z-Score measures investors’ unrealized profit, and extremely high values often indicate speculative overheating.
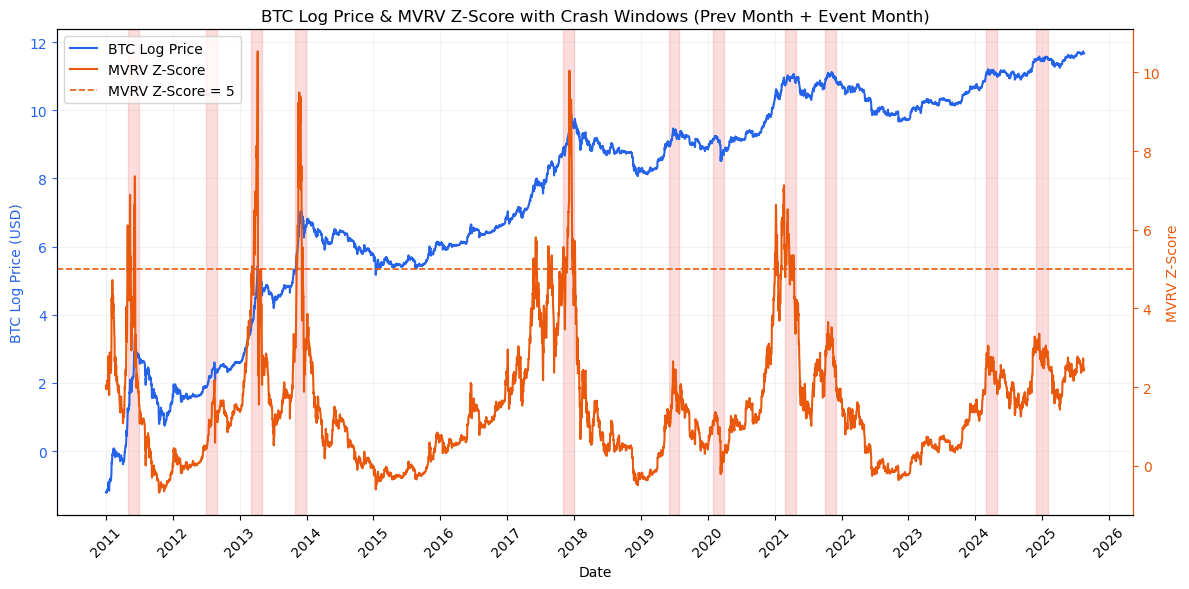
Bitcoin log price vs. MVRV Z-Score and its 5 threshold (as of August 18, 2025, Data source: Bitfox Research)
● Performance: At the 5 threshold, Z-Score captured approximately 45% of major correction windows.
● Strengths: Much more precise than MM. When triggered, it usually appears only about one month before the top, providing timely signals.
● Weaknesses: Missed many corrections, especially those driven by external shocks (e.g., March 2020 pandemic) or mid-cycle adjustments (e.g., July 2019).
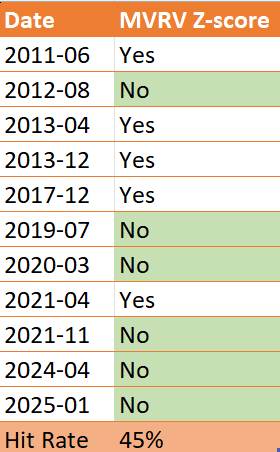
MVRV Z-Score: Historical performance identifying market tops (2011–2025)
Conclusion: Although less comprehensive than MM, when the Z-Score does trigger, its signal is sharper. It produces fewer false alarms but must be used alongside other indicators.
Backtest Conclusion: An Evolving Market
The backtest results show that both the Mayer Multiple and MVRV Z-Score exhibit declining peak levels when signaling market tops. Historically, the Mayer Multiple has dropped from readings exceeding 17.5 in early cycles to around 2.2 in recent years; the MVRV Z-Score has declined from peaks above 8 to near 3. This suggests Bitcoin’s market dynamics are evolving, with indicator levels at cycle tops becoming progressively lower.

Bitcoin price vs. Google Bitcoin Trends Index
A complementary perspective comes from comparing Bitcoin’s price to the Google Trends Index (provided by @0xPianoHands). Bitcoin’s price trajectory has gradually decoupled from search trends, which often serve as a proxy for retail participation. With increasing institutional capital inflow, Bitcoin is transitioning toward a more stable, efficient, and mature market. Therefore, traditional thresholds for the Mayer Multiple and MVRV Z-Score may need downward adjustment to reflect this structural shift.
Investor Implications
For investors, these indicators should be treated as warning signals, not absolute sell triggers. The Mayer Multiple offers broader coverage and often identifies overheating earlier, while the MVRV Z-Score is more selective, typically signaling only when a top is near. A prudent approach is to view threshold breaches as warnings, but wait for confirmation of trend reversal before acting. Signals carry higher credibility when both indicators heat up simultaneously; if relying on a single indicator, wait for clearer signs of market reversal to avoid exiting too early.
Current Market Conditions
As of September 1, Bitcoin’s Mayer Multiple stands at 1.07, and the MVRV Z-Score is at 2.1. Both values are well below historical “red zone” levels. This indicates that while the market shows some warmth, it is far from the frenzy typically associated with cycle peaks. If the Mayer Multiple breaks above 2.2, or the MVRV Z-Score rises toward 5 and subsequently declines, historical patterns suggest a significantly increased likelihood of a cycle top. Until then, evidence continues to support the potential for further upside in the current bull cycle.
Join TechFlow official community to stay tuned
Telegram:https://t.me/TechFlowDaily
X (Twitter):https://x.com/TechFlowPost
X (Twitter) EN:https://x.com/BlockFlow_News
 @bitfoxdotai