Huobi Growth Academy | Cryptocurrency Market Macro Research Report: A Stress Test Under the Confluence of Multiple Factors
TechFlow Selected TechFlow Selected
Huobi Growth Academy | Cryptocurrency Market Macro Research Report: A Stress Test Under the Confluence of Multiple Factors
Identifying the constancy of long-term narratives amid panic.
Executive Summary
From late May to early June 2026, the crypto market experienced its most severe selloff of the year. Bitcoin dropped over 18% from its $78,000 peak to around $64,000; Ethereum broke below the $2,000 threshold and slid toward $1,700. This downturn was not triggered by a single event but rather by a confluence of factors: escalating geopolitical tensions (the Iran-Hormuz Strait crisis pushed crude oil prices up 6%), cracks in institutional conviction (Strategy sold Bitcoin for the first time in four years), record ETF outflows (11 consecutive days of net outflows totaling $3.5 billion), tightening macro liquidity (under new Fed Chair Warsh’s hawkish stance, the probability of rate cuts this year plummeted to 35%), and unusual activity in Mt. Gox’s cold wallets. The Fear & Greed Index plunged to 11. This report analyzes the episode across five dimensions—geopolitics and macro liquidity, ETF fund flows, structural market contradictions, narrative fractures, and regulatory inflection points—to provide a long-term perspective that pierces through short-term panic.
I. Geopolitics and Macro Liquidity: The First Major Market Test Under the Warsh Era
On May 22, Kevin Warsh officially assumed office as the 11th Chair of the Federal Reserve, succeeding Jerome Powell upon the conclusion of his term. A former Fed Governor during the 2008 financial crisis, Warsh signaled a decisively hawkish posture from day one, publicly criticizing monetary policy between 2020–2022 as “one of the most serious policy misjudgments since the Volcker era” and explicitly prioritizing accelerated balance sheet reduction. According to CME FedWatch, the probability of a rate cut at the June 17 FOMC meeting has fallen sharply—from 55% in April to just 23%; the likelihood of no cuts all year has surged to 65%. The federal funds rate remains anchored in the 3.50%–3.75% range, while the 10-year Treasury yield held steadily between 4.35% and 4.55% throughout May—exerting persistent pressure on risk asset valuations.
Even more critically, U.S. inflation has proven far stickier than expected. Headline CPI has rebounded to 3.8% YoY, and core inflation remains significantly above the Fed’s 2% target. In his confirmation hearing, Warsh made clear that policy will focus squarely on inflation resilience—not marginal softening in the labor market—even though last Friday’s May nonfarm payroll report unexpectedly disappointed. The Fed is highly unlikely to pivot toward easing under such conditions. Against this backdrop, the external liquidity environment for crypto markets is shifting from “mild headwinds” to “significant headwinds.” Compounding matters, Iran’s threat to close the Strait of Hormuz sent crude oil soaring nearly 6% intraday—WTI hit $92.54 and Brent rose to $94.98—further constraining room for rate cuts. In Warsh’s inaugural market test, crypto assets now confront a quadruple negative: elevated interest rates, accelerated quantitative tightening, stubborn inflation, and rising geopolitical risk premiums.
Yet viewed over a longer horizon, the current macro dilemma is not insoluble. On June 16–17, the FOMC will release its latest dot plot—including projected rate paths through 2028. If the median projection shifts from “one cut” to “no cuts this year,” markets may react sharply in the short term—but once expectation divergence is fully priced in, macro uncertainty could actually ease temporarily. For crypto, transitioning from “high uncertainty” to “definitive tightening” may weigh on prices near-term, yet it also helps investors reallocate capital within a clearer interest-rate framework over the medium to long term. Historically, the final hike of the 2018 tightening cycle triggered a temporary rebound in risk assets—an experience worth noting.
II. ETF Fund Flows: Is the $3.5 Billion Outflow a Retreat—or Tactical Rebalancing?
The most immediate funding pressure behind this selloff came from spot ETFs. As of June 2, U.S. spot BTC ETFs had registered net outflows for 11 consecutive trading days—cumulatively about $3.5 billion—the longest streak since their January 2024 launch. Over three weeks, BTC ETFs saw over $4.21 billion in net outflows, with AUM falling from $104 billion to $94 billion. ETH ETFs posted at least $241 million in net outflows during the same period, exceeding $712 million cumulatively over three weeks. More notably, 2026 marked the first full year in which annual net inflows turned negative—signaling that the ETF channel—the strongest buying engine for crypto since 2024—has officially reversed course.
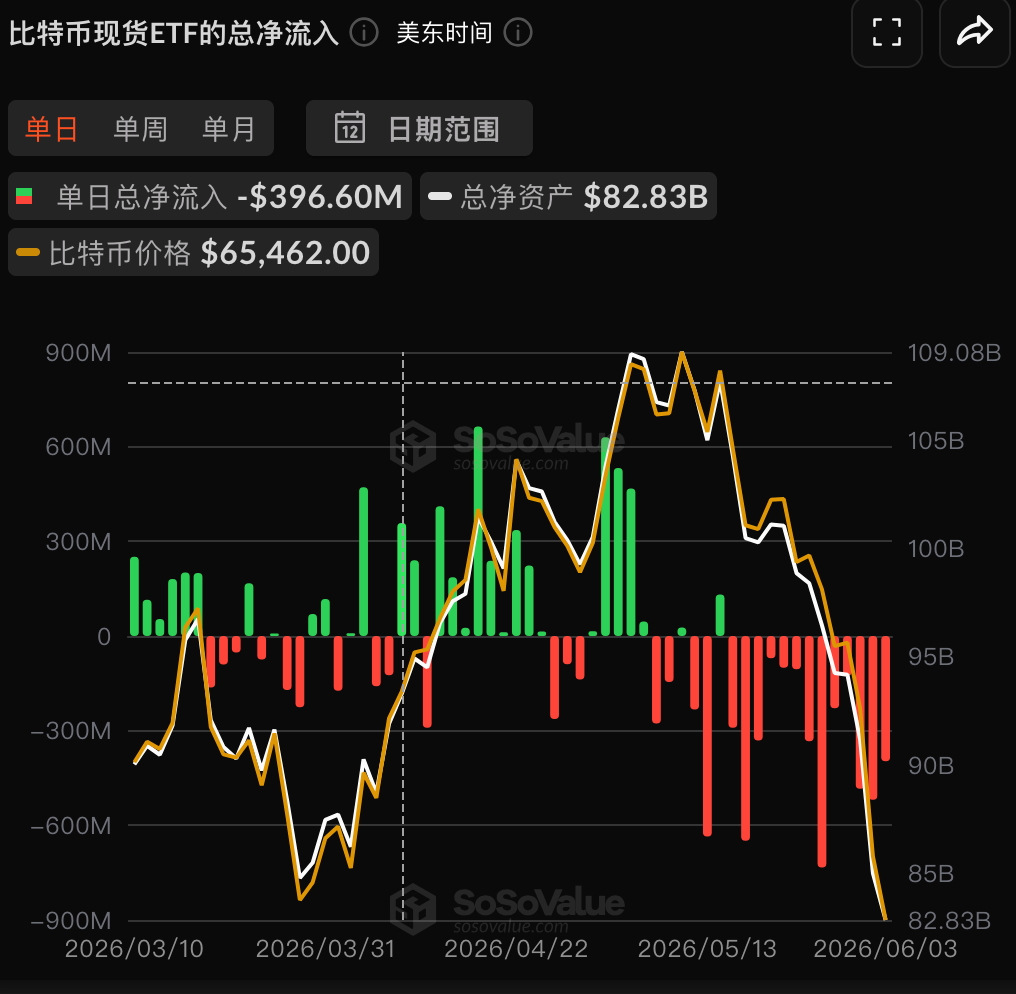
Yet a deeper look into the structural characteristics of these ETF outflows reveals a picture more nuanced than the headline numbers suggest. CoinShares and Galaxy attribute this outflow wave to three drivers: heightened geopolitical tensions (U.S.-Iran conflict), capital rotation from crypto into AI and semiconductors (NVDA surged over 6% intraday after its Computex RTX Spark announcement; Marvell jumped over 12% premarket following Jensen Huang’s strong endorsement), and weakening momentum behind Strategy’s new BTC purchases. Notably, ETF share counts did not decline in tandem—indicating institutions are not “liquidating positions” but rather executing “tactical de-risking.” Though BlackRock’s IBIT recorded a single-day outflow of $528 million, it remains the largest BTC ETF by AUM—and BlackRock’s CEO recently stated publicly that “Bitcoin could reach $700,000 per coin,” underscoring unwavering long-term strategic conviction.
Historically, sharp short-term ETF fund flow volatility is not unique to crypto. In April 2024, BTC ETFs saw ~$1.2 billion in consecutive outflows—but Bitcoin rebounded to new highs within three months. While the absolute $3.5 billion outflow is eye-catching, it represents only ~3.7% of the $94+ billion total BTC ETF AUM. Standard Chartered’s latest research maintains a long-term bullish outlook on digital assets, forecasting Ethereum to reach $40,000 by 2030. Overall, the current ETF outflow appears more like “tactical portfolio rebalancing” than “strategic withdrawal”—and when AI valuations become fully priced-in and crypto completes its correction, the potential for capital to rotate back remains intact.
III. Internal Market Structure Contradiction: Fundamentals Rising, Prices Falling
By on-chain metrics alone, crypto fundamentals have never been stronger. Bitcoin’s global hash rate hit an all-time high in 2026, powered by next-generation ASIC miners delivering higher energy efficiency, while institutional mining continues to expand. Simultaneously, stablecoin market cap reached $32.54 billion (USDT: $18.79B, USDC: $7.59B), up 37.9% since April 2025. Hash rate reflects long-term confidence in underlying infrastructure; stablecoin supply reflects on-chain liquidity depth. Both metrics stand at historic peaks—yet Bitcoin’s price has declined 34% from its recent high, creating a stark divergence.
This “fundamental-price decoupling” stems from multiple causes. First, Bitcoin’s short-term pricing power has shifted from on-chain participants to macro traders. Its 90-day rolling correlation with the Nasdaq remains firmly in the 0.6–0.7 range—its “high-beta tech stock” identity now outweighs its “digital gold” narrative. That means when macro-driven capital reduces risk exposure amid rising rates, Bitcoin is among the first assets sold. Second, futures leverage amplified selling pressure: BTC’s break below $70,000 triggered massive long liquidations—$1.624 billion cleared across exchanges in 24 hours, the highest since February—with open interest still above $52 billion, suggesting deleveraging may be incomplete. Finally, Ethereum faces structural challenges: Solana continues eroding its DeFi and DEX market share; L2 fragmentation blurs ETH’s value capture; and ETH ETF inflows lag far behind BTC ETFs.
Yet from a cyclical perspective, this sharp correction coincides precisely with ongoing network-level improvement—a pattern repeatedly observed in crypto history and often marking mid-cycle accumulation windows. During the 2017 bull run, BTC endured five drawdowns exceeding 30%; in 2021, there were three. A 34% pullback fits well within historical norms—and BTC remains over 330% above its 2022 lows. When extreme fear (Fear & Greed Index = 11) coincides with strengthening on-chain fundamentals, subsequent 12-month returns have historically been robust: +80% after September 2023’s extreme fear, +120% after August 2024, and +190% after November 2022. History doesn’t guarantee future outcomes—but it does remind us that maintaining focus on long-term fundamentals amid panic is often key to identifying structural buying opportunities.
IV. Strategy’s First BTC Sale: A Storm in a Teacup—and Repairing Narrative Fractures
On June 1, an SEC filing sent tremors through the crypto market. Strategy sold 32 BTC between May 26–31 at an average price of ~$77,135, generating ~$2.5 million to pay dividends on its STRC preferred shares. This transaction represented only ~0.004% of Strategy’s total holdings—less than a rounding error relative to its daily equity trading volume—yet ignited market-wide alarm due to one critical fact: it marked Strategy’s first net sale of Bitcoin in 41 months, since August 2022. Within the crypto narrative ecosystem, Michael Saylor and Strategy have long embodied the “ultimate HODLer”; the phrase “We will never sell Bitcoin” served as a foundational pillar of market faith. When that pillar developed its first crack, MSTR’s stock plunged 11% over two days and BTC tumbled to $64,000.
A sober assessment requires distinguishing “narrative shock” from “fundamental change.” Thirty-two BTC amounts to little more than a cup of water scooped from an ocean, given Strategy’s >500,000 BTC holdings—and its purpose was unambiguous: dividend payments are routine corporate finance operations, unrelated to any bearish view on Bitcoin. From a tax-planning standpoint, modestly trimming position at $77,135 to lock in tax credits is also entirely reasonable. However, during this selloff, the Fear & Greed Index collapsed from 30 to 11, placing investor risk perception in an extremely fragile state. In such an environment, even a microscopic fissure in a “faith symbol” gets massively amplified by emotional feedback loops—far exceeding the event’s intrinsic significance.
Looking ahead, repairing the Strategy narrative fracture hinges on two variables. First, whether Saylor issues a public statement clarifying that this sale was a routine tax-planning move—not a strategic pivot. Second, whether Strategy resumes buying in the near term. If it reappears on the buy side over the coming weeks, today’s panic will likely be remembered as “a storm in a teacup.” From an institutional behavior lens, a party that bought continuously for 41 months being repriced solely due to a 0.004% position adjustment reflects market sentiment—not fundamentals. Once risks are fully priced in and rational investors reassess the event, fear-driven mispricing often corrects itself.
V. The CLARITY Act and the Regulatory Inflection Point: The Year’s Largest “Unpriced” Catalyst
Amid this cascade of negatives, a potentially underestimated positive development is advancing in Washington. On May 15, the CLARITY Act passed the Senate Banking Committee by a decisive vote and advanced to full-Senate consideration. Widely viewed as the “constitutional document” for U.S. crypto regulation, the bill would—for the first time at the federal level—establish clear regulatory boundaries for digital assets, delineate jurisdictional authority between the SEC and CFTC, and provide a systemic legal framework for stablecoin issuance, exchange registration, and market structure. It previously passed the House with overwhelming bipartisan support (294–134), exceeding expectations. A full Senate vote is highly likely before the end of June.

The strategic importance of the CLARITY Act for crypto markets cannot be overstated. The industry’s greatest uncertainty isn’t technological or demand-related—it’s regulatory ambiguity. As the world’s largest capital market, the U.S. has long frustrated institutional investors—pension funds, endowments, and insurers—whose cautious allocations stem largely from unclear compliance pathways. Passage of the act would eliminate this uncertainty at its root: the credibility of spot ETFs as compliant investment vehicles would strengthen further, attracting conservative institutions previously standing on the sidelines; the $32.54 billion stablecoin ecosystem would gain legally sanctioned operational clarity; and America’s shift from “ambiguous rejection” to “clear embrace” would generate global spillover effects.
Notably, amid current panic-driven selling, progress on the CLARITY Act appears entirely unpriced by markets. BTC’s drop from $78,000 to $64,000 shows virtually no discounting of the bill’s advancement. Such “policy upside drowned out by emotion” is common during episodes of extreme fear—but it also implies that once sentiment recovers and the bill is formally enacted, this catalyst could unleash its full incremental impact from a price level bearing almost no prior expectation. For long-term investors, identifying “unpriced structural tailwinds” during market panic is a strategy with strong historical validation. Of course, the bill’s path remains uncertain—opposition from banking lobby groups to certain provisions, the precise timing of the full Senate vote, and presidential signing intent all warrant continued monitoring.
VI. Conclusion: Recognizing the Enduring Nature of Long-Term Narratives Amid Panic
A panoramic view of the crypto market in early June 2026 reveals a complex landscape defined by the coexistence of “short-term panic and long-term fundamental improvement.” Price-wise: BTC fell from $78,000 to $64,000; ETH broke below $2,000; Fear & Greed Index = 11—all pointing to extreme fear. Drivers: escalating geopolitics, tightening macro conditions, record ETF outflows ($3.5B over 11 days), narrative fractures (Strategy’s first BTC sale), and on-chain anomalies (Mt. Gox transferred $739M)—five negatives converging with rare intensity. Structural metrics: $1.624B liquidated in 24 hours, open interest remaining above $52B—suggesting deleveraging may still be incomplete.
Yet the underlying crypto narrative remains fundamentally unchanged. Decentralization, digital sovereignty, and value storage—the core tenets supporting crypto’s long-term value proposition—hold true at $100,000 just as they do at $64,000. Price volatility alters short-term sentiment—not protocol security. All-time-high network hash rate, $32.54B stablecoin market cap (+37.9% YoY), and steady progress on the CLARITY Act—all structural improvements—are accumulating at speeds invisible to panicked markets. History consistently shows that extreme fear zones (Fear & Greed < 25) often serve as contrarian accumulation windows for long-term investors—though historical precedent never guarantees future returns.
Looking ahead over the next few months, crypto’s trajectory will hinge on three key variables. Base case (~50% probability): BTC consolidates in a $60,000–$68,000 range for 2–4 weeks, then rebounds to $70,000–$75,000 following the nonfarm payroll report and FOMC dot plot release. Bullish case (~25%): CLARITY passes in June, coupled with ETF fund inflows and easing geopolitics, triggering a V-shaped rally to retest previous highs above $78,000. Bearish case (~25%): Nonfarm payroll surprises to the upside, pushing rate expectations higher; Iran escalates, sending oil above $100; global risk assets fall in unison—BTC drops to $52,000–$56,000. Even under the worst-case scenario, BTC remains over 260% above its 2022 lows—the long-term uptrend remains firmly intact.
In summary, today’s crypto market reflects a classic cyclical correction within an ongoing bull market. Panic is a normal part of market mechanics—it compresses valuations, clears excessive leverage, and distinguishes speculators from long-term holders. For Huobi Academy students and investors broadly, the priority now is not to make irrational decisions driven by emotion—but to return to fundamentals: examine hash rate trends, stablecoin growth, regulatory evolution, and real-world adoption of decentralized technology. A 34% price decline does not equate to a 34% loss in intrinsic value. If crypto’s foundational narratives remain intact, the optimal response is not panic-driven exit—but preserving rationality amid fear and holding firm to a long-term perspective. As Wall Street’s old adage goes: “Bull markets are born in pessimism, grow on skepticism, mature on optimism, and die in euphoria.” Today’s extreme fear may well mark the beginning of the next long-term accumulation phase.
Join TechFlow official community to stay tuned
Telegram:https://t.me/TechFlowDaily
X (Twitter):https://x.com/TechFlowPost
X (Twitter) EN:https://x.com/BlockFlow_News