Annualized loss rate merely 0.03%: A data-driven breakdown of the real risks in DeFi lending
TechFlow Selected TechFlow Selected
Annualized loss rate merely 0.03%: A data-driven breakdown of the real risks in DeFi lending
Setting Aside Public Bias to Reassess the Security of DeFi Lending
 Navigating Web3 tides with focused insights
By Alex McFarlane
Translated by Chopper, Foresight News
Every disruptive fintech innovation inevitably undergoes growing pains—and decentralized finance (DeFi) is no exception. Early lending markets launched rapidly and scaled aggressively; the industry then repeatedly faced security breaches in public markets, gradually refining code security, collateral risk management, oracle mechanisms, liquidation logic, and governance systems.
Past risk incidents remain instructive—but they no longer represent today’s mature DeFi ecosystem. After all, those who dwell solely on history often miss present opportunities.
Excluding cross-chain bridge-related security incidents, the annualized loss rate from theft and malicious attacks on DeFi lending protocols across Ethereum Virtual Machine (EVM)-compatible chains and Solana stands at approximately 0.03% of total value locked (TVL) in lending. All data cited herein are aggregated from hacker attack and exploit-related incidents labeled on DeFi Llama.
The core metric for assessing security risk is: How large is the actual loss from exploited vulnerabilities relative to the volume of funds deployed in the market?
A 0.03% loss rate roughly corresponds to the probability of an American dying from a slip-and-fall accident. Thus, setting aside widespread market panic, the actual security risk of DeFi lending remains relatively low.
Breakdown of DeFi Security Incidents
As of May 16, 2026, DeFi Llama reports cumulative losses across all DeFi protocol categories totaling $7.751 billion. This broad metric encompasses cross-chain bridges, decentralized exchanges (DEXs), derivatives protocols, blockchain gaming projects, digital wallets, underlying infrastructure failures, and non-lending DeFi applications.
Cross-chain bridges constitute the highest-risk category: Excluding bridge-related incidents, total DeFi theft losses decline to $4.518 billion.
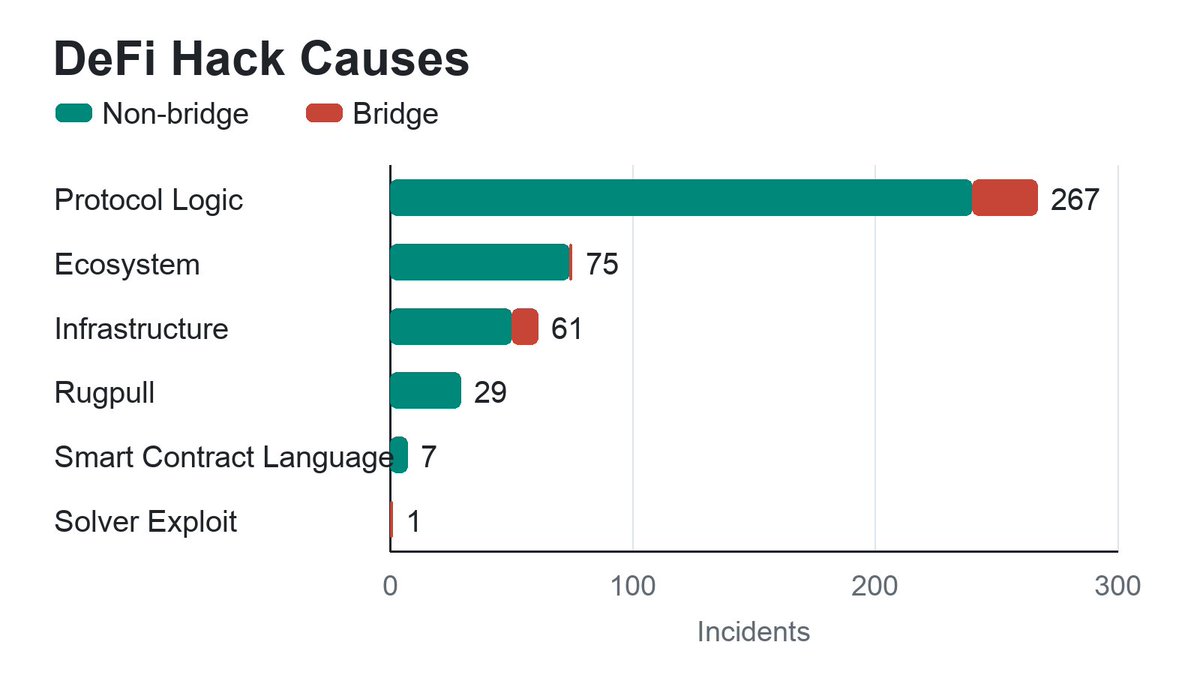
Code executes only the instructions written—not the developer’s intended outcomes—making this the root cause of recurring vulnerabilities. Categorizing risks meaningfully is critical: DeFi is not a monolithic risk landscape. Theft from cross-chain bridges, oracle manipulation on DEXs, wallet phishing scams, and collateral vulnerabilities in lending markets represent entirely distinct risk types.
Among all DeFi protocols, lending markets suffer the highest frequency of attacks—simply because large volumes of assets sit idle in smart contracts for extended periods, making them prime targets for hackers.
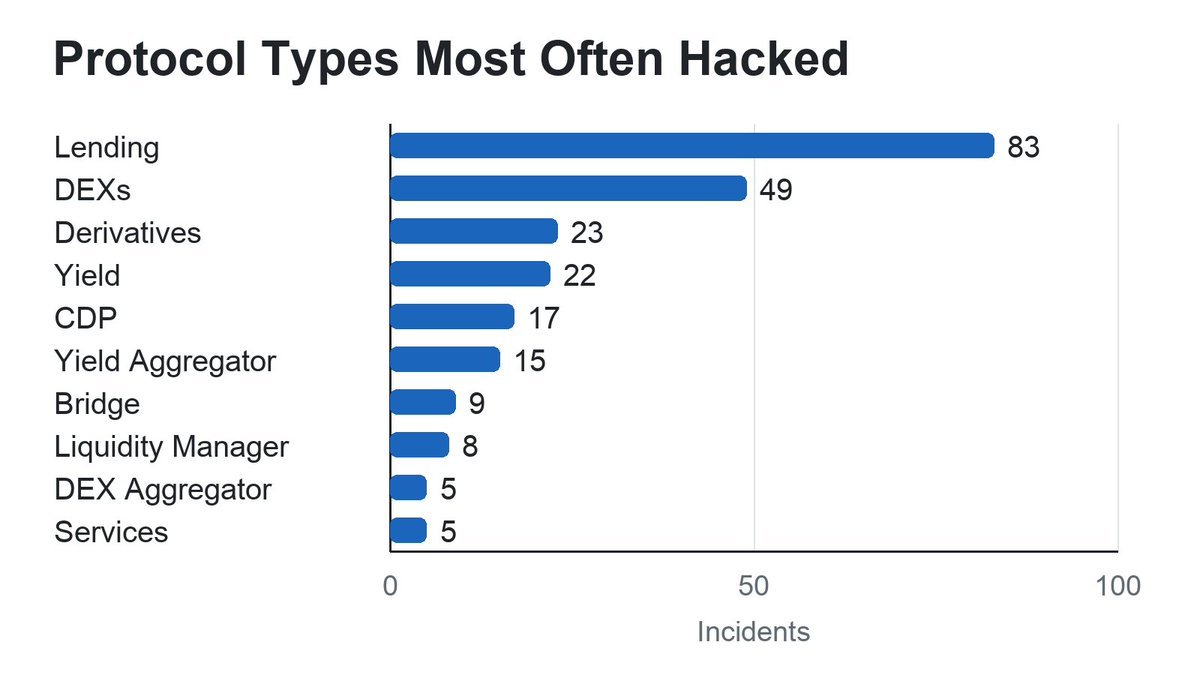
Lending protocols and automated market makers (AMMs) are the two most frequent targets of security incidents—their shared vulnerability being the concentration of substantial assets within smart contracts. Beyond cross-chain bridges, the vast majority of security events cluster in these two protocol categories. This article focuses specifically on lending and money-market protocols.
Significant Improvement in Loss Rates
Today’s overall DeFi TVL dwarfs the scale seen during the sector’s early, high-vulnerability phase—especially in lending, where risk control frameworks are more mature, code audits more comprehensive, and real-time network-wide risk monitoring increasingly robust. Excluding cross-chain bridge incidents, the annualized actual theft loss ratio for lending protocols across EVM-compatible chains and Solana has declined substantially.
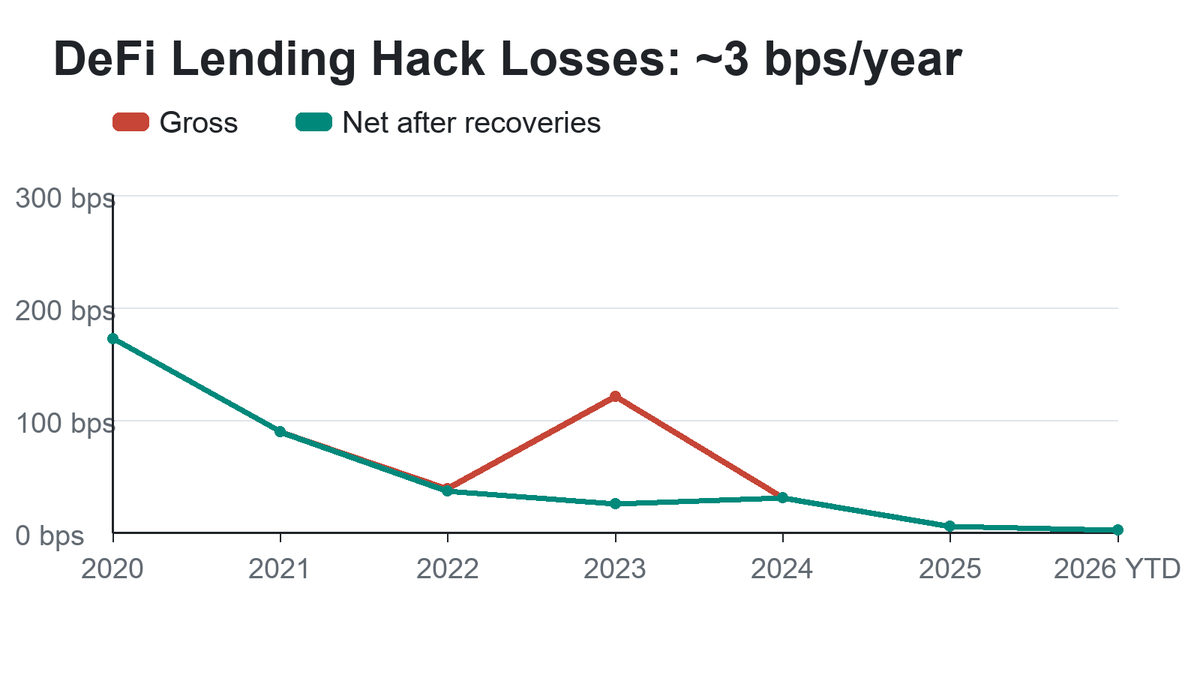
Euler set a landmark precedent in incident response by successfully recovering 100% of stolen assets. In 2023, Euler lost $197 million—but recovered the full amount, and due to favorable asset price movements, ultimately reclaimed $240 million, achieving a net positive outcome. This widened the gap between reported losses and actual recoveries industry-wide.
Using May 16, 2026 as the reference date, data from the preceding ~12 months show:
- Reported total losses from non-cross-chain lending on EVM and Solana: $30.9 million
- Actual net losses after asset recovery: $30.1 million
- Average daily TVL in lending: $99.6 billion
- Reported loss rate: 3.1 basis points
- Actual net loss rate: 3 basis points
Annualized, the capital erosion rate remains stable at approximately 0.03% of total lending TVL.
Advantages of Asset Diversification
DeFi security incidents exhibit pronounced bimodal characteristics: A very small number of massive thefts account for the overwhelming majority of publicly reported losses. When plotted on a logarithmic scale, incident sizes approximate a log-normal distribution. Visually, most incidents cause relatively minor losses, while extreme high-value thefts occur only in rare cases.
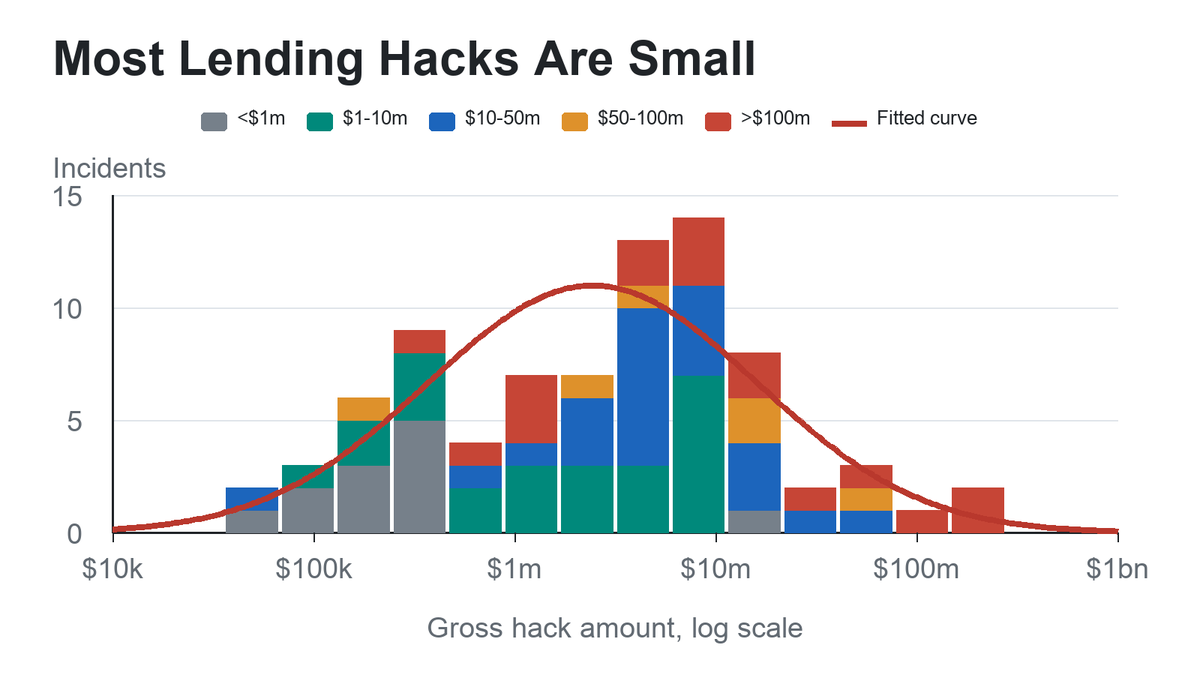
Although ChatGPT offers a different perspective, I contend that these data strongly support portfolio diversification as an excellent crime-mitigation strategy.
From perspectives of risk transfer and commercial insurance, this data model also provides a sound foundation for industry security insurance services—enabling insurers to set per-incident payout caps across protocols and conduct underwriting operations in an orderly manner.
Moreover, the vast majority of theft incidents have limited scope and fall far short of destabilizing the entire lending sector’s capital base. And the larger the sector’s overall scale, the smaller the systemic impact of any single security event.
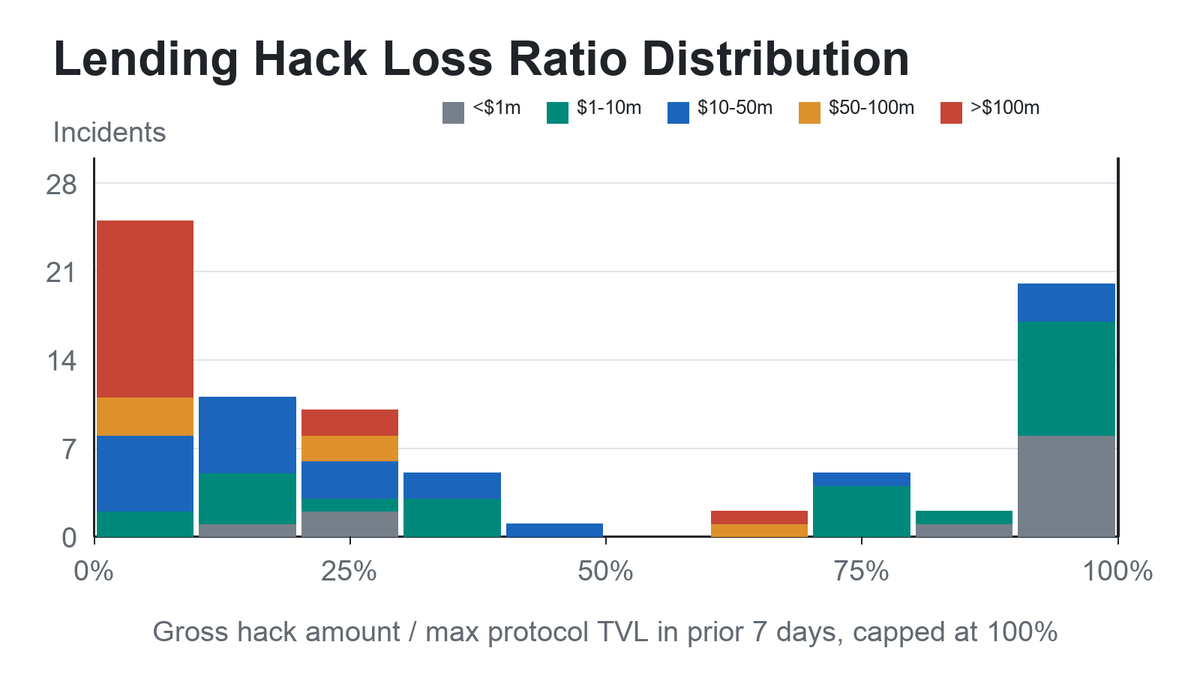
Note: In some incidents, reported losses appear to exceed a protocol’s own TVL. Such cases are uniformly recorded as 100% loss. Two main factors cause this discrepancy: (1) timing lags between TVL reporting and incident occurrence, resulting in asset volume fluctuations; and (2) inconsistencies between DeFi Llama’s TVL methodology and the actual volume of assets exposed to risk.
While this calculation method is not perfect, it clearly reflects current industry realities: Most vulnerability exploits affect only a single module within a lending protocol—full-scale asset compromise is exceedingly rare, especially among large, established projects. These findings provide crucial empirical grounding for DeFi risk hedging and secure asset custody services.
Asset Recovery Capability Is Critical
Asset recovery has likewise significantly improved the real-world risk profile of DeFi lending. Across all DeFi categories tracked by DeFi Llama, recovered assets represent approximately 8% of reported total losses. Excluding cross-chain bridge incidents, the recovery rate for lending protocols on EVM-compatible chains and Solana rises to roughly 20% of reported losses.
In jurisdictions with well-developed legal systems and mature regulatory oversight, asset recovery success rates for theft incidents are consistently higher—a phenomenon offering implicit insights into access-control design principles for the industry.
Positive Industry Outlook
DeFi lending security risks are now quantifiable and classifiable, with actual capital loss ratios continuing to trend downward. Data confirm the sector has entered a mature development stage: Actual exploit-related losses represent an extremely small fraction of the sector’s massive existing capital base; risks are clearly identifiable; and risk boundaries are increasingly transparent.
In summary, there is no need to be swayed by external pessimistic narratives—data and facts robustly substantiate the true risk level of the DeFi lending sector.
Join TechFlow official community to stay tuned
Telegram:https://t.me/TechFlowDaily
X (Twitter):https://x.com/TechFlowPost
X (Twitter) EN:https://x.com/BlockFlow_News
 @flipdazed