
Derive and Strands Introduce Off-Exchange Custody for On-Chain Derivatives
TechFlow Selected TechFlow Selected
Derive and Strands Introduce Off-Exchange Custody for On-Chain Derivatives
Institutions can now manage risk using on-chain options and perpetual contracts while assets remain in cold storage.

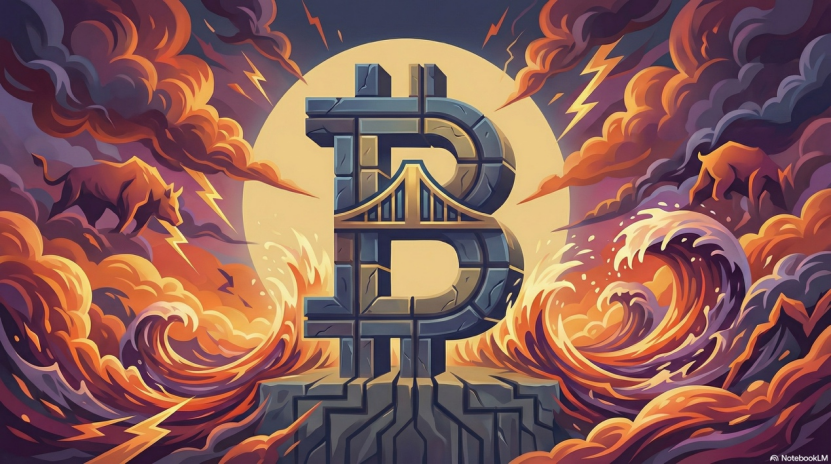
On February 6, U.S. dollar asset investors struggled to sleep.
Opening their trading platforms revealed a sea of red. Bitcoin plunged to $60,000 at one point—a 16% drop within 24 hours—and had already fallen 50% from its previous peak.
Silver plummeted like a kite with its string cut—down 17% in a single day. The Nasdaq dropped 1.5%, and tech stocks were battered across the board.
In the crypto market, 580,000 traders were liquidated, wiping out $2.6 billion.
But the strangest part? No one knows exactly what happened.
There was no Lehman Brothers collapse, no black swan event—not even a credible piece of bad news. U.S. equities, silver, and cryptocurrencies—all three asset classes—plunged simultaneously.
When “safe-haven assets” (silver), “tech faith” (U.S. equities), and “speculative casinos” (cryptocurrencies) all collapse at once, the market may be sending just one message: Liquidity has vanished.
U.S. Equities: A Bubble Bursting During Earnings Season
After market close on February 4, AMD delivered an impressive earnings report: both revenue and profit exceeded expectations. CEO Lisa Su declared on the earnings call: “We enter 2026 with strong momentum.”
Then its stock crashed 17%.
What went wrong? Its Q1 revenue guidance ranged from $9.5 billion to $10.1 billion, with a midpoint of $9.8 billion—above Wall Street’s consensus estimate of $9.37 billion. On paper, that should have triggered celebration.
Yet the market rejected it.
The most bullish analysts—the ones shouting “AI revolution” and assigning sky-high target prices—had expected “$10 billion+.” Falling short by just 2%, in their eyes, signaled “slowing growth.”
The result was a full-blown stampede. AMD plunged 17%, shedding tens of billions in market cap overnight; the Philadelphia Semiconductor Index fell over 6%; Micron dropped more than 9%, SanDisk plunged 16%, and Western Digital fell 7%.
The entire semiconductor sector was dragged down by a single company—AMD.
Before AMD’s wounds had even begun to heal, Alphabet struck again.
After market close on February 6, Google’s parent company released its earnings. Revenue and profit once again beat expectations handily; cloud revenue surged 48%; CEO Sundar Pichai beamed: “AI is driving growth across all our businesses.” Then CFO Anat Ashkenazi dropped a bombshell: “In 2026, we plan to invest $175–185 billion in capital expenditures.”
Wall Street collectively froze.
This figure is double Alphabet’s $91.4 billion spend last year—and 1.5 times the $119.5 billion consensus expectation. It amounts to burning $500 million per day, every day, for an entire year.
Alphabet’s stock tumbled 6% after hours, then lurched erratically—rebounding briefly before falling again—ultimately closing flat. But panic and anxiety had already taken root across markets.
This is the real AI arms race of 2026: Google burns $180 billion, Meta $115–135 billion, while Microsoft and Amazon pour money in at breakneck speed. The four tech giants will collectively spend over $500 billion this year.
Yet no one knows where this arms race ends. It’s like two people shoving each other at the edge of a cliff—whichever stops first gets pushed over.
The “Magnificent Seven” tech stocks’ near-total gains in 2025 came purely from “AI expectations.” Everyone bet: “Yes, valuations are high now—but AI will make these companies wildly profitable, so buying now isn’t a mistake.”
But when the market realizes “AI isn’t a money printer—it’s a money burner,” massive capital expenditures under lofty valuations become a sword of Damocles hanging overhead.
AMD was merely the beginning. Every subsequent earnings report that falls short of perfection could trigger another wave of panic selling.
Silver: From “Poor Man’s Gold” to Liquidity Sacrifice
Up 68% in one month—down 50% in three days.
Since January, silver has traced a curve that left everyone stunned.
It hovered around $70 at the start of the month—then rocketed to $121 by month-end.
Social media erupted in a “silver frenzy.” Reddit’s r/silver forum overflowed with “Diamond Hands” (die-hard holders), while Twitter buzzed with posts like “Silver is going to the moon,” “Industrial demand is exploding,” and “Solar panels can’t function without silver.”
Many truly believed “this time is different.” Real-world industrial demand—solar panels, AI data centers, electric vehicles—plus five consecutive years of supply deficits made silver’s golden age seem inevitable.
Then, on January 30, silver collapsed—30% in a single day.
It plunged from $121 to roughly $78—a single-day crash not seen since the 1980 “Hunt Brothers” episode, when two Texas billionaires attempted to corner the silver market, only to face forced liquidation by exchanges and a market meltdown.
Forty-five years later, history repeated itself.
On February 6, silver fell another 17%. Those who tried to “buy the dip” at $90 watched helplessly as their money evaporated yet again.
Silver is unique: it’s both “poor man’s gold” (a safe-haven asset) and an “industrial necessity” (used in solar panels, smartphones, cars).
In bull markets, this duality is a double blessing: strong economies boost industrial demand; weak economies fuel safe-haven demand—either way, silver rises.
But in bear markets, it becomes a double curse.
The collapse traces back to January 30, when Trump announced his nomination of Kevin Warsh as the next Fed Chair. Silver cratered 31.4% that day—the largest single-day drop since 1980.
Warsh is a well-known hawk who advocates sustaining high interest rates to curb inflation. His nomination instantly cooled market fears about “Fed loss of independence,” “monetary policy chaos,” and “runaway inflation”—all key drivers behind gold and silver’s 2025 rally. That same day, the U.S. Dollar Index rose 0.8%, and all safe-haven assets (gold, silver, yen) were dumped en masse.
Looking back, three events unfolded within 48 hours:
On January 30, the Chicago Mercantile Exchange (CME) abruptly raised silver margin requirements from 11% to 15%, and gold margins from 6% to 8%.
Simultaneously, market makers began retreating.
Ole Hansen, Saxo Bank’s Head of Commodity Strategy, stated bluntly: “When volatility spikes, banks and brokers withdraw from the market to manage their own risk—and this retreat exacerbates price swings, triggering stop-loss orders, margin calls, and forced liquidations.”
Most bizarrely, just as silver volatility peaked, the London Metal Exchange (LME) trading system suddenly suffered a “technical issue,” delaying its opening by one hour.
These events converged almost simultaneously—silver crashed from $120 to $78, a 35% single-day plunge, triggering mass liquidations.
Was it coincidence—or a carefully engineered “liquidity trap”? No one knows. But silver markets now bear another deep scar.
Cryptocurrencies: A Long-Delayed Funeral Finally Held
A one-sentence summary of recent crypto carnage: This is a funeral long postponed.
Early February, Bitwise CIO Matt Hougan published an article titled “The Depths of Crypto Winter.” His analysis concluded: the bull market ended in January 2025.
In October 2025, BTC surged to a record $126,000—prompting cheers of “$100K is just the beginning.” Hougan argued this brief bull run was artificially sustained.
Throughout 2025, Bitcoin ETFs and Digital Asset Trusts (DATs) purchased 744,000 BTC—worth roughly $75 billion.
Compare that to Bitcoin’s new supply mined in 2025: ~160,000 BTC (post-halving). Institutions bought 4.6 times the newly minted supply.
In Hougan’s view, without that $75 billion in institutional demand, Bitcoin would have plunged 60% by mid-2025.
The funeral was delayed nine months—but it was inevitable.
So why did crypto fall hardest?
Within institutional “asset hierarchies,” there exists an unspoken ranking:
Core assets: U.S. Treasuries, gold, blue-chip stocks—sold last during crises.
Secondary assets: Corporate bonds, large-cap equities, real estate—sold when liquidity tightens.
Periphery assets: Small-cap stocks, commodity futures, cryptocurrencies—the first to be sacrificed.
During liquidity crises, cryptocurrencies are always the first to go.
This stems from crypto’s inherent traits: highest liquidity (24/7 trading), instant convertibility to cash, lowest moral burden, and minimal regulatory pressure.
So whenever institutions need cash—whether to meet margin calls, execute stop-losses, or comply with sudden “reduce risk exposure” mandates—the first asset sold is always cryptocurrency.
As U.S. equities and silver turned bearish, crypto was indiscriminately dumped—not for fundamental reasons, but simply to raise cash for margin top-ups.
Still, Hougan believes the crypto winter has lasted long enough—and spring is surely near.
The Real Epicenter: Japan’s Overlooked Ticking Time Bomb?
Everyone searches for the culprit: AMD’s earnings? Alphabet’s spending spree? Trump’s Fed nomination?
The true epicenter may have been planted as early as January 20.
That day, yields on Japan’s 40-year JGBs breached 4%—the first time since the instrument’s 2007 launch, and the first time any Japanese government bond yield has crossed 4% in over 30 years.
For decades, Japanese government bonds served as global finance’s “safety net”—with near-zero or even negative yields, rock-solid and stable.
Global hedge funds, pension funds, and insurers have long played a game called the “yen carry trade”: borrow ultra-cheap yen, convert into dollars, and buy U.S. Treasuries, tech stocks, or cryptocurrencies—profiting from the interest rate differential.
As long as JGB yields stayed flat, the game continued. How big is the market? No one knows precisely—but conservative estimates place it in the trillions of dollars.
As the yen entered a hiking cycle, the carry trade gradually contracted—but after January 20, it plunged straight into hell mode—even liquidation mode.
Japanese Prime Minister Shigeru Ishiba announced snap elections, pledging tax cuts and increased fiscal spending. Yet Japan’s debt-to-GDP ratio already stands at 240%—the world’s highest. With more tax cuts, how will Japan repay its debts?
Markets exploded. Japanese government bonds were dumped en masse, sending yields soaring. The 40-year JGB yield spiked 25 basis points in a single day—an unprecedented move in Japan’s 30-year history.
Once JGBs collapsed, dominoes began falling:
The yen strengthened sharply—forcing funds that borrowed yen to buy U.S. Treasuries, equities, or Bitcoin to confront surging repayment costs. They faced a stark choice: liquidate immediately—or face margin calls.
U.S. and European bonds—and all “long-duration assets”—were sold off in tandem, as investors scrambled for cash.
Equities, precious metals, and cryptocurrencies all suffered. When even “risk-free assets” are being dumped, no other asset class stands a chance.
That’s why “safe-haven assets” (silver), “tech faith” (U.S. equities), and “speculative casinos” (cryptocurrencies) collapsed simultaneously.
A pure “liquidity black hole.”
Join TechFlow official community to stay tuned
Telegram:https://t.me/TechFlowDaily
X (Twitter):https://x.com/TechFlowPost
X (Twitter) EN:https://x.com/BlockFlow_News