

Is the memecoin trend shifting? Observing changes in market sentiment for memecoins on-chain and on exchanges
TechFlow Selected TechFlow Selected
Is the memecoin trend shifting? Observing changes in market sentiment for memecoins on-chain and on exchanges
This article will use data analysis to explore the early development of memecoins that require community building and long-term investment, taking $MOODENG as an example.
Author: Kevin, BlockBooster Researcher
Murad outlined the Memecoin supercycle, making his case in a manner familiar to VCs—discussing altcoin prospects, shifts in the crypto industry, and evolving future trends:
-
Defined the Memecoin Supercycle by rejecting altcoins with only $500 daily revenue but valuations reaching $7 billion;
-
Painted a golden age for Memecoins, at the cost of declaring obsolete those once-bullish altcoins now fallen into oblivion. "All altcoins are essentially Memecoins—just more complex versions."
Murad's views may seem radical—we don’t aim to judge them here—but his observation that "Memecoin trading trends are changing" deserves deeper exploration. This article uses data analysis, taking $MOODENG as an example, to examine the early development path of Memecoins that require community building and long-term investment. It also analyzes the common traits among Murad’s top five recommended Memecoins, offering an objective look at emerging Memecoin trends.
Recap of $MOODENG
Moo Deng is a baby pygmy hippopotamus born on July 10, 2024, at Khao Kheow Open Zoo in Thailand. After the zoo shared photos of his birth on its official Facebook page, he quickly became an internet sensation. As Moo Deng's online popularity surged, daily visitor numbers at the zoo doubled by early September 2024.
Currently, there are three Memecoins associated with Moo Deng: $MOODENG on Solana and Ethereum, and $HIPPO on Sui, launched on September 10, September 15, and September 27, respectively.
Let’s first review key on-chain metrics for Solana’s $MOODENG:
Rapid organic growth in holder count, with bots interspersed

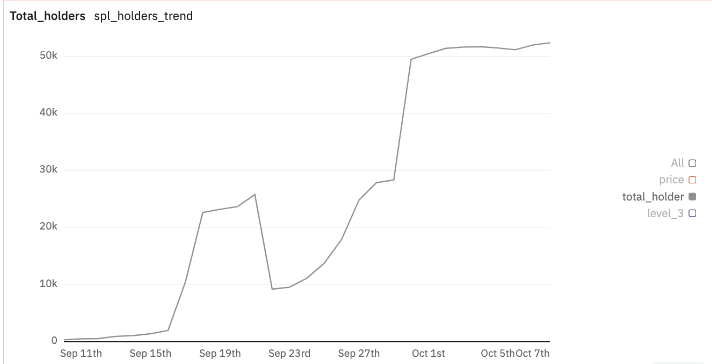
Total address growth of SOL $MOODENG
The total wallet address growth chart shows three distinct periods of abnormal activity:
-
First, between September 16–18, addresses surged from 1,970 to 22,645;
-
After three days of organic growth, a sharp decline occurred from September 21–22, dropping from 25,790 to 9,204 addresses;
-
A second spike happened from September 29–30, rising from 28,344 to 49,502 addresses.
Among the current total of 52,413 addresses, 25,464 have never sold their initial holdings—a diamond-hand ratio of 48%.
Diamond hand addresses of SOL $MOODENG
When filtering on-chain addresses by holding size, we find that all addresses involved in the abnormal spikes held fewer than 100 $MOODENG tokens. Facing weaker-than-expected organic traction, the team rapidly deployed nearly 20,000 linear bot addresses over three days. This triggered alert thresholds for chain-scanning bots while maintaining a stable upward price channel, drawing market attention.
Looking at the following three charts—which show total wallets holding $MOODENG, those holding 0.0005% (4,950 addresses, ~$693), 0.005% (49,500 addresses, ~$6,930), and 0.05% (495,000 addresses, ~$69,300)—we see a clearer trend after filtering out bot addresses and raising the minimum threshold to 4,950 $MOODENG: small and mid-sized holders steadily increased, while large holders stopped growing after September 21.
Focusing on small holders, we observe a spike starting September 16 due to the influx of new addresses. As FOMO intensified, organic growth accelerated, peaking around September 20. Once the team observed sustained organic momentum, they removed the bot addresses created between September 16–18. Address counts began declining alongside price after $MOODENG peaked on September 28.
Growth in mid-tier holders slowed after September 18, and post-September 28 sell-offs were larger than those among small holders.
From September 28 to October 6, small holders dropped by 12.2%, mid-tier holders by 16.5%, and large holders by 25.8%.
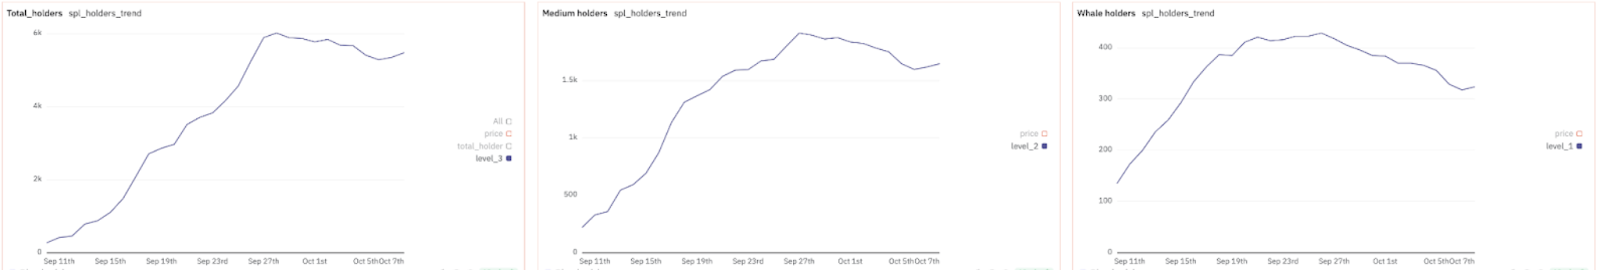
Tiered address growth rate of SOL $MOODENG
The peak times for each tier also differ: large holders peaked on September 21, mid-tier on September 27, and small holders on September 28.
High concentration of holdings
Further on-chain analysis reveals that excluding the top 10 addresses, the remaining top 5% of holders collectively own nearly 90% of the circulating supply. Specifically, these top 5% held 46% on September 10, jumped to 71% on September 11, and remained above 90% between September 21–24. Currently, it stands around 85%. Thus, $MOODENG exhibits highly concentrated token ownership.
Mature team operations
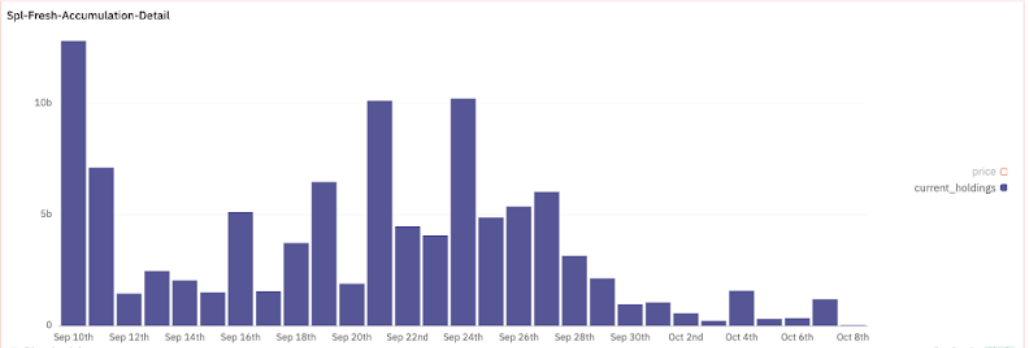
Large single-address purchases in SOL $MOODENG
The team has been continuously buying since launch, up until September 28. As shown, they accumulated significant positions in the first two days—especially on September 10 and 11—and successfully shaped the price chart. Combined with the chart below, we can clearly see two strong price pushes by the team on September 21 and 24, breaking out of consolidation boxes every three days in a rhythmic pattern.
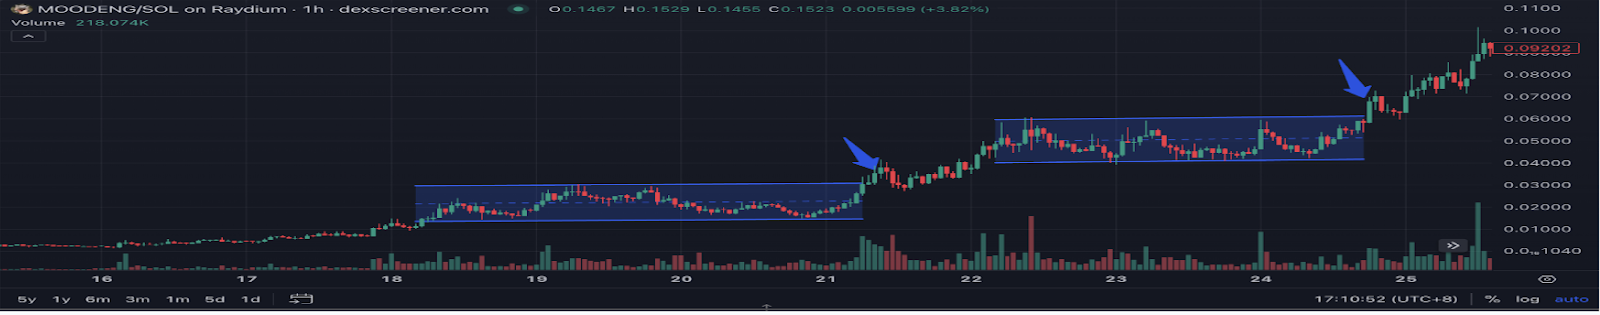
Price chart of SOL $MOODENG
Comparison with Ethereum $MOODENG
Applying the same metrics to Ethereum’s $MOODENG reveals that retail interest had already waned before Vitalik sold his holdings—on-chain addresses showed almost no growth, and the team made no effort to maintain the community or price action, a common scenario among copycat projects. For ten days prior, total addresses remained flat—the team had effectively given up.
Interestingly, during this period of falling prices, mid-tier holders consistently sold to cut losses from September 25 to October 5, contrasting with retail’s typical “buy and hold” behavior.
On October 5, Vitalik’s tweet reignited FOMO on ETH, causing a sudden surge in small-holder addresses. Mid-tier holdings also rose but began selling off after peaking on October 7, as did large holders. The upper chart shows large addresses started selling on October 5, while mid-to-large ones followed on October 7—clear signs the team was rushing to exit.
In terms of holding concentration, ETH’s $MOODENG isn’t as centralized as the Solana version, but it has steadily increased since October 5, peaking at 58.6% on October 8.
Controlling ownership structure and price patterns: A new marketing approach for Memecoins
Solana’s $MOODENG relied little on KOL promotion; instead, the team focused on growing their X account. Their core strategy centered on shaping the token’s price pattern. While building a community, they accumulated a large stake early, achieved high concentration, and executed breakouts after multiple consolidation phases. In contrast, the ETH team lagged significantly in price management and trading strategy. The SOL team successfully controlled 90% of the supply, versus just 48% for the ETH team. However, while chip control is common across Memecoins, what matters is what teams do afterward. The real differentiator lies in execution. Today’s Memecoins no longer depend heavily on KOLs for reach. Instead, teams must learn how to manually trigger bot and platform algorithms. When done right, these systems become free marketing tools.
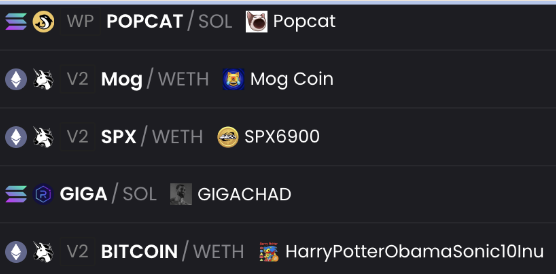
Overview of Murad’s top 5 recommended Memecoins by market cap
Murad’s criteria for selecting Memecoins include: mid-cap tokens between $5M and $200M; based on Solana or Ethereum; with at least six months of history. These can be interpreted through the earlier-discussed metrics—essentially boiling down to two dimensions: the team’s willingness to support price, and the level of user FOMO generated.
The former refers to the ability of teams, whales, or communities to stabilize price during downturns, create prolonged consolidation patterns, and drive strong breakouts when needed. For Memecoins, sustained price increases driven purely by sentiment are rare, as no one controls retail trading behavior. Therefore, attracting big holders or retail traders ultimately depends on visible price actions taken by the team, especially during corrections and breakout attempts. To some extent, the degree of chip concentration reflects the team’s willingness and determination to act at critical price junctures. Of course, community support still plays a role—for instance, $SPX’s price movement isn't tightly linked to team actions, thanks to Murad’s personal influence. The latter—FOMO intensity—can be measured by growth in holder count, while tracking top-tier holdings helps identify optimal exit points.
In terms of top 5% dominance, all five of Murad’s recommended tokens are strongly controlled by insiders, with major chips held by teams and large players. $POPCAT and $GIGA exceed 85% concentration, while the other three remain above 60%. Such high concentration ensures that price movements align more closely with team intentions during transitions or breakouts, reducing the risk of collapse. With low team holdings, you might see rapid price spikes followed by crashes within 1–3 days, requiring precise timing for exits.
Among these five, $POPCAT, $MOG, and $SPX best exemplify these two dynamics.
$POPCAT saw its most recent team intervention on October 10. One week earlier, on October 4, the price broke its all-time high without major team-driven momentum. But after three days of gains, large retail holders began selling. Over the next three days, sell volume remained steady with ~5% daily drawdowns, prompting the team to step in on October 10 with heavy buying to keep price within the uptrend. $MOG followed a similar pattern, with the team adjusting price action three times at the end of September and beginning of October. $MOG’s overall trend is a six-month consolidation box, with a shorter-term uptrend lasting over a month. As price approaches the box’s midpoint, retail selling emerges; near the upper boundary, selling pressure intensifies. The team intervened three times to prevent breakdowns from the uptrend, signaling strong intent to preserve the pattern and hinting at potential breakout readiness. Both $POPCAT and $MOG exhibit clear manipulation by teams, whales, or syndicates, sending strong signals to unify market momentum.
$SPX differs—it was one of the most FOMO-driven tokens in September. Retail buying pressure was so intense, with price accelerating through successive channels, that the team didn’t need to actively manage the trend to achieve remarkable gains. Murad’s extraordinary promotional power brought retail FOMO around $SPX to fever pitch.
Exchange-based Memecoins Overview
Among the top 200 tokens, aside from Murad’s five picks, most other Memecoins derive primary liquidity from centralized exchanges. In this cycle, exchange-based Memecoin performance varies. By analyzing liquidity dominance and duration of price pattern stability, we can assess whether a breakout will lead to strong follow-through—and how such moves compare against on-chain Memecoins in strength.
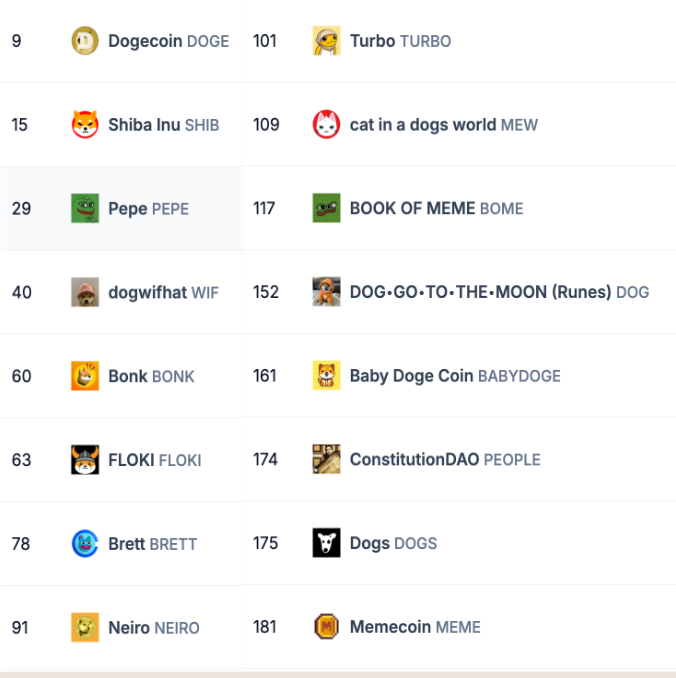
Taking a closer look, $Neiro and $TURBO both show extremely high dominance, with primary liquidity on Binance. When Binance holds the vast majority of supply, it can drive rallies instantly without needing prior accumulation.
BRETT, MEW, and DOG are the other three with high dominance, all having recently undergone pattern shifts or breakouts. BRETT broke out of a five-month downtrend, MEW out of a seven-month one. However, because their liquidity isn’t on major exchanges, their post-breakout performance is weaker compared to the previously mentioned on-chain Memecoins. DOG maintained an uptrend for a month after its breakout.
Some tokens failed to sustain momentum after breaking out due to fragmented liquidity. For example, Pepe broke out of a seven-month consolidation but has since entered a two-week sideways range, underperforming relative to other hot Memecoins.
Other Memecoins achieving price breakouts include Wif, Bome, DOGS, and DOGE. Wif is in a two-week uptrend; Bome is the latest Binance-led Memecoin to break out. DOGE and Bome both broke out of seven-month consolidations—watch their next moves closely. DOGS remains in a three-month downtrend.
Tokens stuck in seven-month ranges without breakout include SHIB, BONK, and MEME. The more false breakouts occur, the less likely these tokens are to develop independent momentum, meaning they’ll likely follow broader market trends. Traders considering right-side entries should pay close attention to stop-loss levels. People has held a four-month sideways range and warrants monitoring for breakout entry points.
Conclusion
The Memecoin craze is far from over, and altcoins are certainly not worthless. Whether focusing on fundamentals can yield returns in this cycle remains an open question. This article explored common on-chain patterns among trending Memecoins, shedding light on one possible direction for future Memecoin evolution.
Join TechFlow official community to stay tuned
Telegram:https://t.me/TechFlowDaily
X (Twitter):https://x.com/TechFlowPost
X (Twitter) EN:https://x.com/BlockFlow_News