

HashKey Capital Monthly Insights Report: Market Gradually Strengthens from Oversold Conditions, Total Crypto Market Cap Rises Nearly 30%
TechFlow Selected TechFlow Selected
HashKey Capital Monthly Insights Report: Market Gradually Strengthens from Oversold Conditions, Total Crypto Market Cap Rises Nearly 30%
This report provides an in-depth analysis of the cryptocurrency market for the first four months of 2024, with a particular focus on April 2024.
Author: HashKey Capital
Compilation: TechFlow
Introduction
This report provides an in-depth analysis of the cryptocurrency market during the first four months of 2024, with a particular focus on April 2024. Despite a 20% market correction in April, the total market capitalization has grown by 27% since the beginning of the year. Bitcoin accounts for 53% of the entire crypto market cap and delivered a 30% return in the first four months of 2024, significantly outperforming traditional assets such as the S&P 500 Index. The report also covers major events and developments in April, including the Bitcoin halving, Ethereum upgrades, and the performance of decentralized finance (DeFi).
Key Takeaways
-
Total crypto market cap increased by 27% since the beginning of the year. Bitcoin holds 53% market share.
-
There are 78 crypto assets with market caps exceeding $1 billion.
-
From January to April 2024, Bitcoin’s return was five times that of the S&P 500.
-
Bitcoin’s Sharpe ratio is 3.
-
By the end of April, most indicators showed the market was in an “oversold” state.
-
Main topics in April included Layer 1 protocols, artificial intelligence, gaming, memes, DePIN, and DeFi.
-
Since the Dencun upgrade on March 13, Ethereum’s price dropped by 27%, while its supply increased by 38,000 ETH.
-
The Dencun upgrade significantly boosted revenue and user fees on L2s.
-
Trading volume and open interest remain high compared to last year.
-
As of the end of April, spot Bitcoin ETFs managed $5.2 billion in assets under management (AUM). Hong Kong launched six crypto asset ETFs.
-
In March and April, venture capital firms invested over $1 billion into crypto startups.
-
After the Bitcoin halving on April 19, Bitcoin’s hashrate dropped by 7.5%. On the other hand, April marked the highest monthly transaction fee revenue for Bitcoin miners.
April Highlights
-
April 5 — Ethena added Bitcoin as a backing asset for USDe
-
April 6–9 — Web3 Festival in Hong Kong, organized by HashKey, attracted over 30,000 attendees
-
April 7 — Publication of the book "Valuation Framework for Digital Assets"
-
April 8 — Total Value Locked (TVL) in DeFi surpassed $100 billion for the first time in two years
-
April 8 — Bitcoin reached $72,300
-
April 9 — Monada Labs raised $225 million led by Paradigm
-
April 10 — HashKey announced its L2 HashKey Chain
-
April 11 — Uniswap received an enforcement notice from the SEC
-
April 15 — Bitcoin’s fourth halving occurred, reducing mining rewards to 3.125 BTC
-
April 24 — BlackRock’s spot Bitcoin ETF recorded 70 consecutive days of net inflows
-
April 30 — Six crypto asset ETFs, including HashKey’s spot Bitcoin and Ethereum ETFs, listed in Hong Kong
Introduction
This report provides an in-depth analysis of the cryptocurrency market during the first four months of 2024, with a special focus on April 2024. Despite a 20% market correction in April, the total crypto market cap grew by 27% since the beginning of the year. Bitcoin accounts for 53% of the entire crypto market cap and delivered a 30% return in the first four months of 2024, outperforming traditional assets like the S&P 500.
In April 2024, the crypto market experienced several significant events and developments. The Bitcoin halving was a key event, reducing the block reward for mining Bitcoin transactions, generating excitement and anticipation within the crypto community. Historically, this event is often associated with price volatility and is expected to impact Bitcoin’s supply dynamics.
The total crypto market cap continued to rise, reaching a new high of $2.9 trillion in March, reflecting strong growth in Q1 2024. This surge was largely driven by the approval of spot Bitcoin ETFs in the U.S. in January, which significantly boosted Bitcoin’s price, pushing it to all-time highs in March.
Significant progress was also made in Ethereum restaking via EigenLayer, reaching 4.3 million ETH with a quarterly growth rate of 36%, indicating growing interest in staking and the broader Ethereum ecosystem. The approval of spot Bitcoin ETFs and expectations around spot Ethereum ETFs further fueled positive market sentiment.
Solana also drew attention, with its meme coins seeing a market cap increase of $8.32 billion in Q1 2024. Overall, April 2024 was filled with anticipation, excitement, and volatility, driven by major events like the Bitcoin halving and notable developments across the altcoin landscape.
Crypto Market Capitalization
From the beginning of the year to the end of April, the total crypto market cap increased by 27%. The current market cap stands at $2.11 trillion, only 25% below the all-time high of $2.8 trillion reached in November 2021. Bitcoin accounts for 53% of the total crypto market cap.
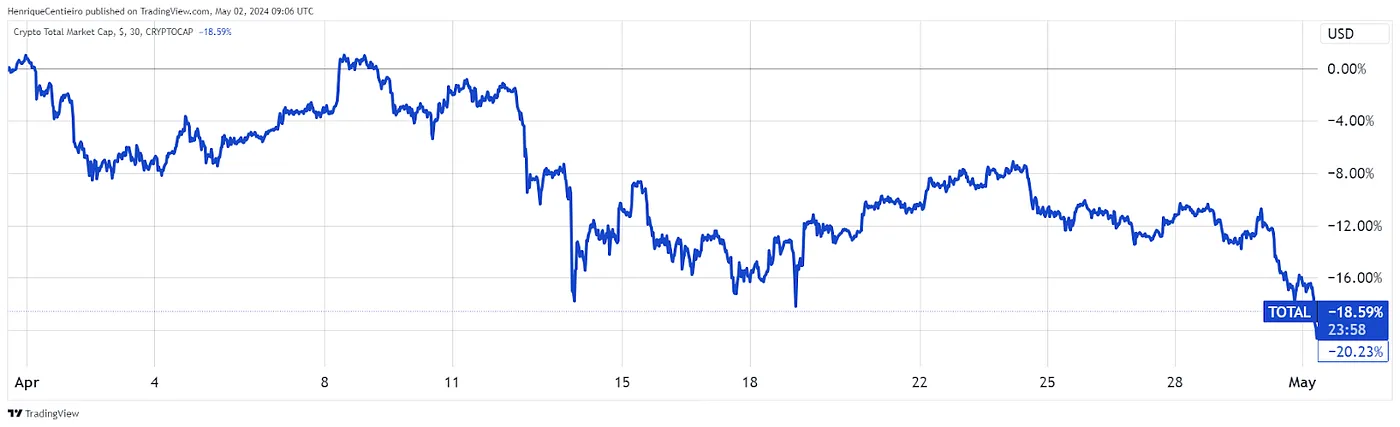
April was a month of correction for the crypto market, with market cap declining by 20%. However, it's important to note that the market started the year strongly, surging 70% between the start of the year and March 14. Thus, this correction was a natural response to an overbought market.
Currently, there are 14 different crypto assets with market caps exceeding $10 billion and 78 assets above $1 billion.
Bitcoin vs. Benchmark Assets
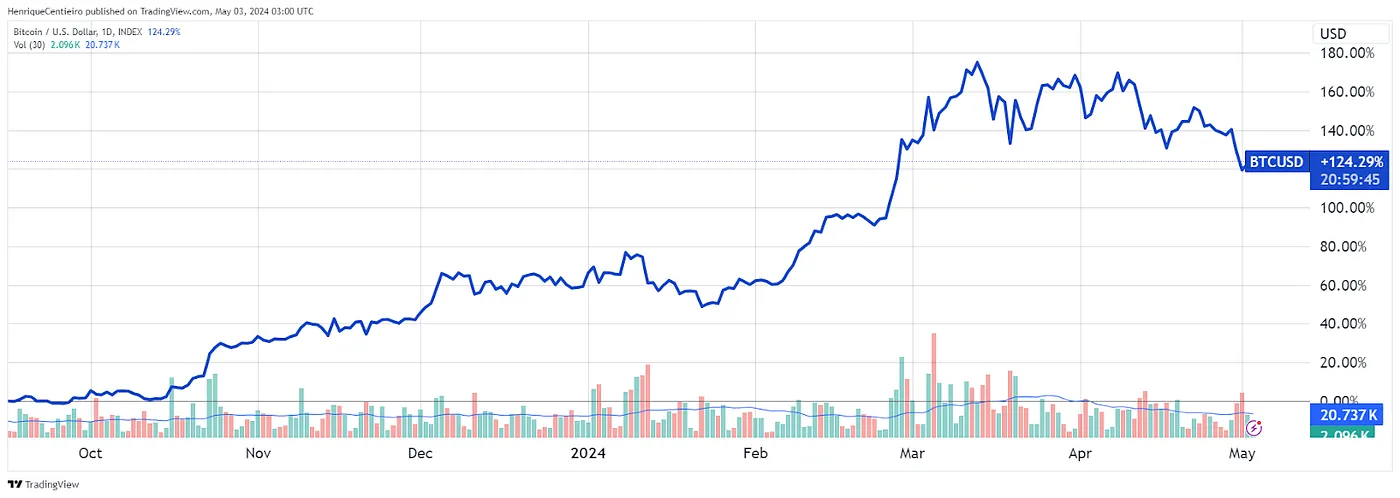
Bitcoin delivered a 30% return in the first four months of 2024. Compared to other traditional assets, Bitcoin and other cryptocurrencies have shown compelling excess returns and risk-adjusted performance.
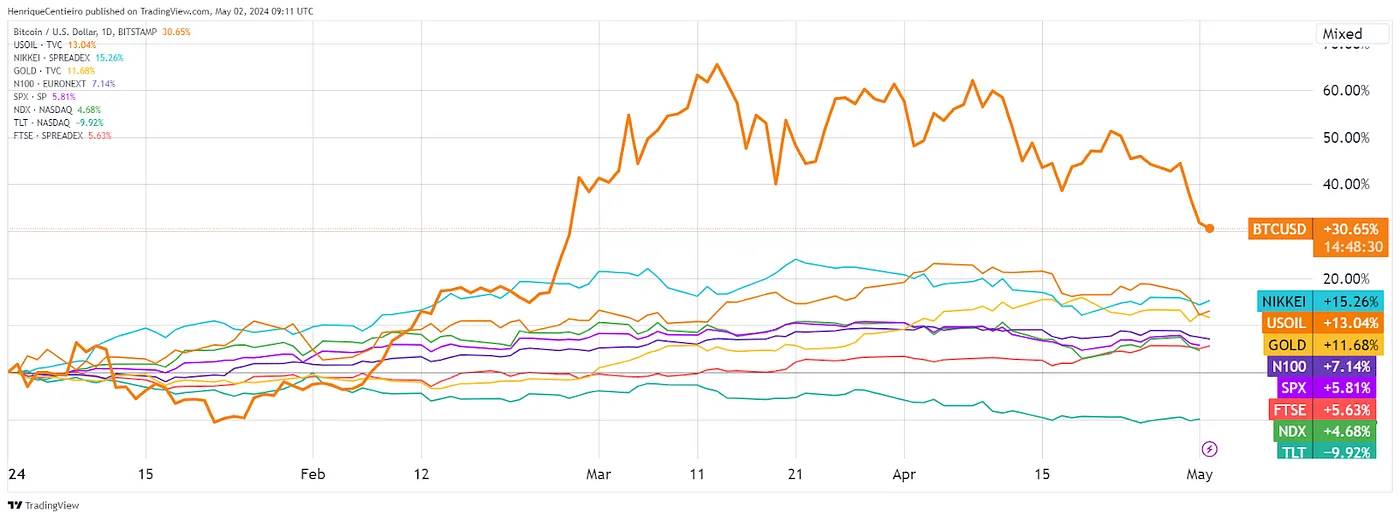
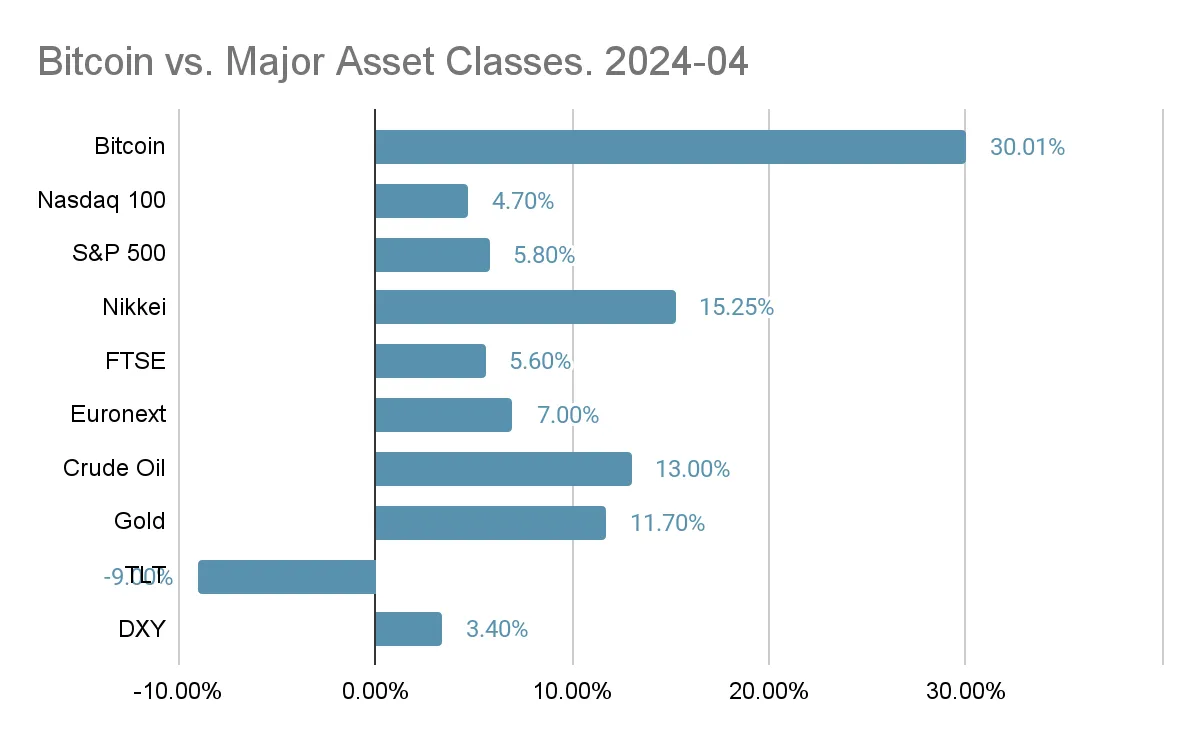
Despite excellent performance in the stock market this year, Bitcoin’s return is five times that of equities (S&P 500). It should be noted that Bitcoin is typically the least volatile crypto asset, while many other crypto assets have returned multiples of Bitcoin’s gains. For example:
-
Toncoin: 107%
-
Dogwifhat: 1,637%
-
Arweave: 201%
-
Fetch.ai: 193%
-
Jupiter: 4,629%
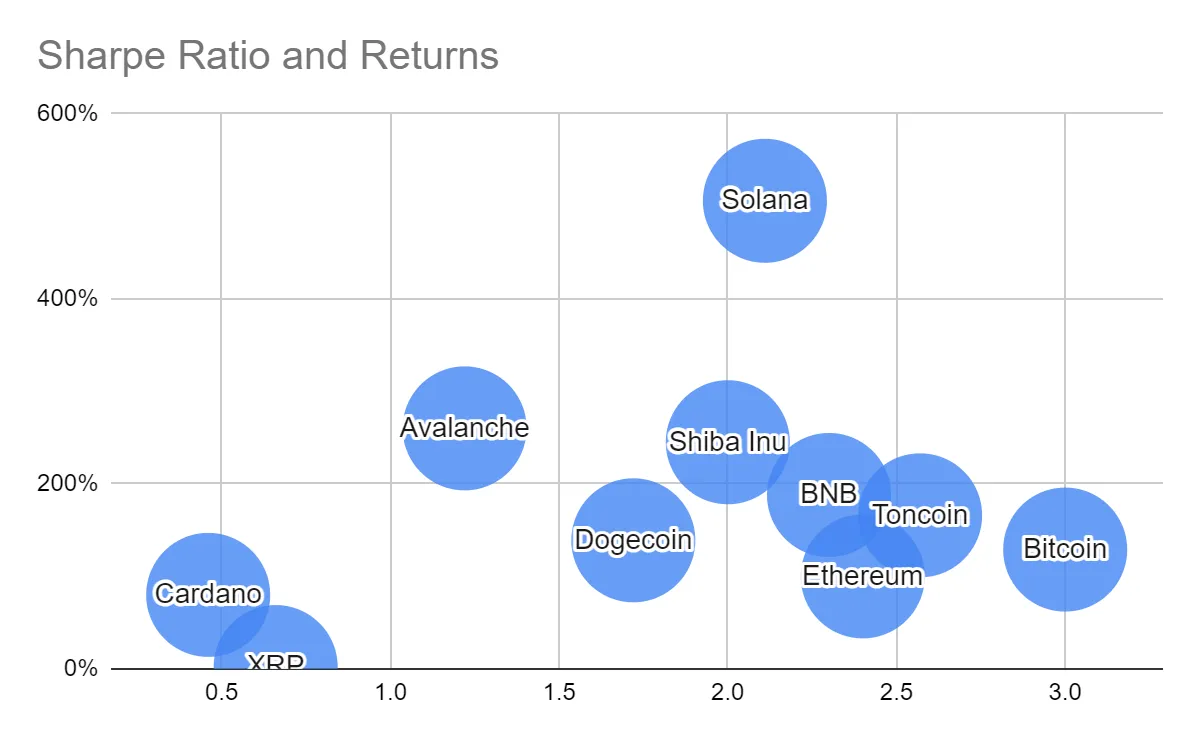
Volatility and Sharpe Ratio
Although crypto assets are generally considered highly volatile, their risk-adjusted returns are often more attractive than other asset classes. While traditionally viewed as risky, crypto assets have consistently delivered superior risk-adjusted returns compared to traditional assets. In other words, given the level of volatility investors endure, the returns are compelling.
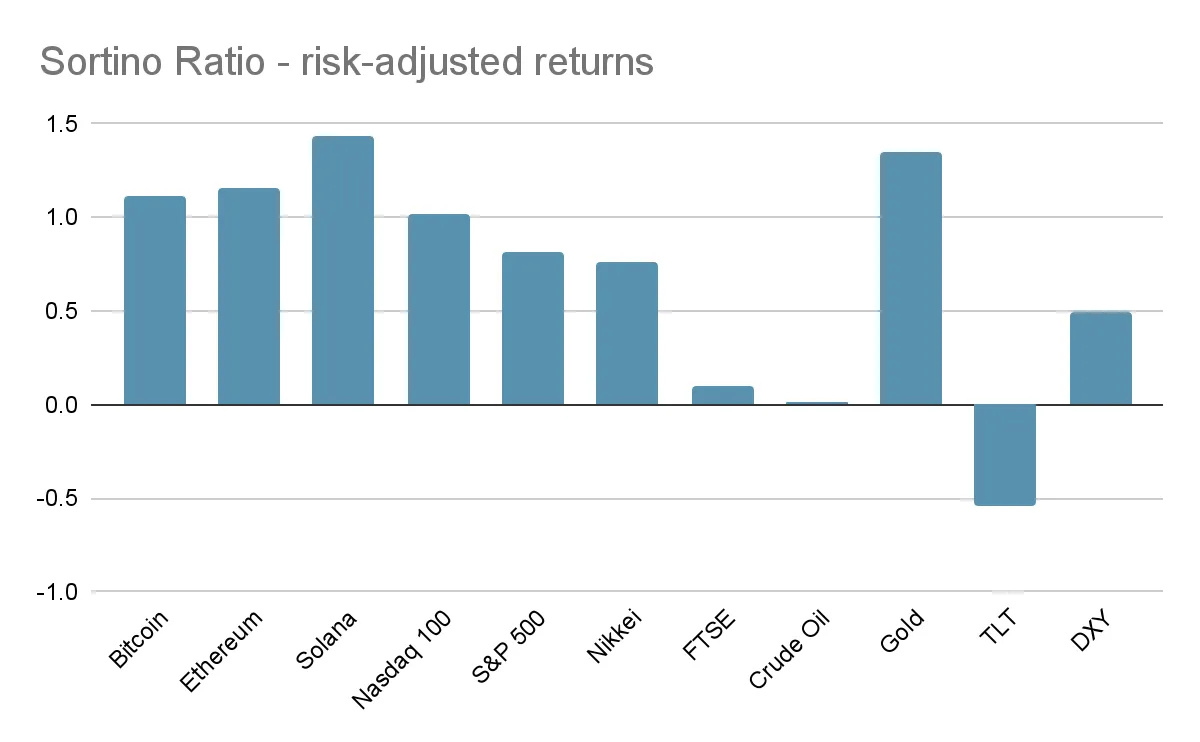
During the first four months of the year, Solana performed best among large-cap cryptocurrencies. Meanwhile, Bitcoin achieved a Sharpe ratio of 3, indicating strong returns relative to the risk taken. Typically, we prefer assets positioned toward the right side of the chart below.
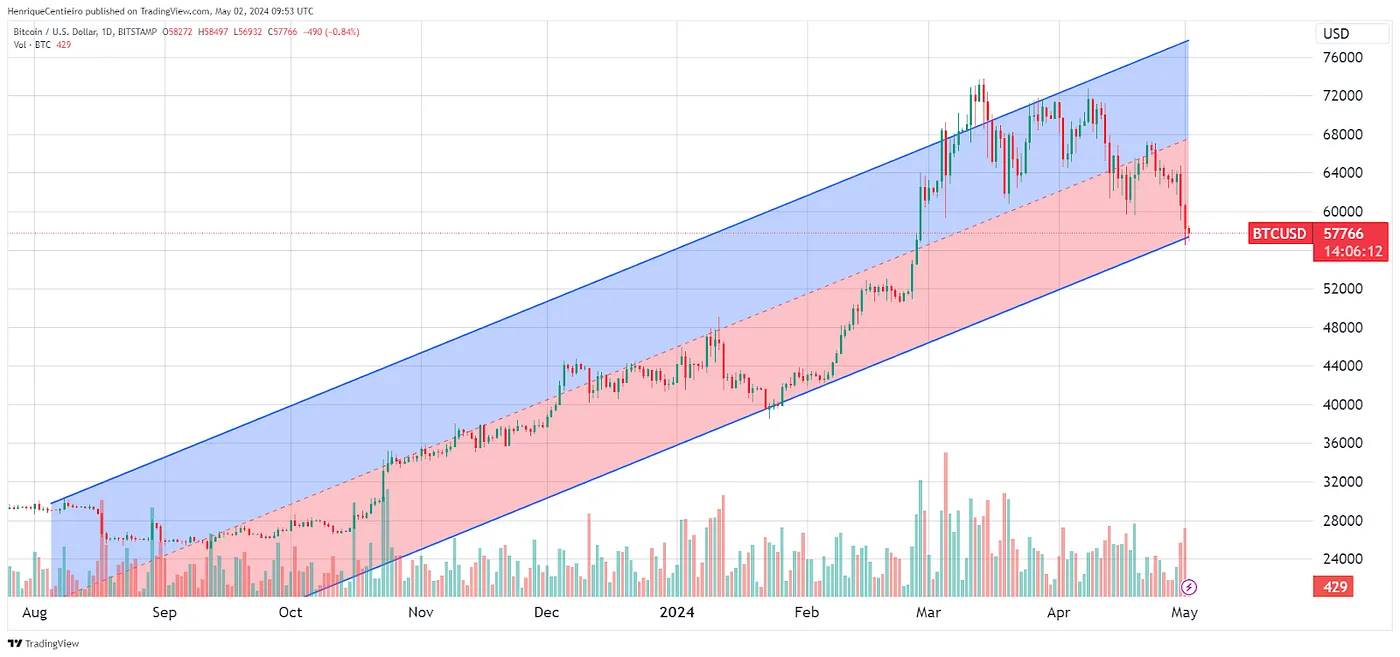
Price Trends and Technical Analysis
Bitcoin’s 6-month regression trend line sits at $67,500 (while BTC trades at $57,766), suggesting that while continuing its upward trajectory, BTC may eventually retrace to the $67,000 level.
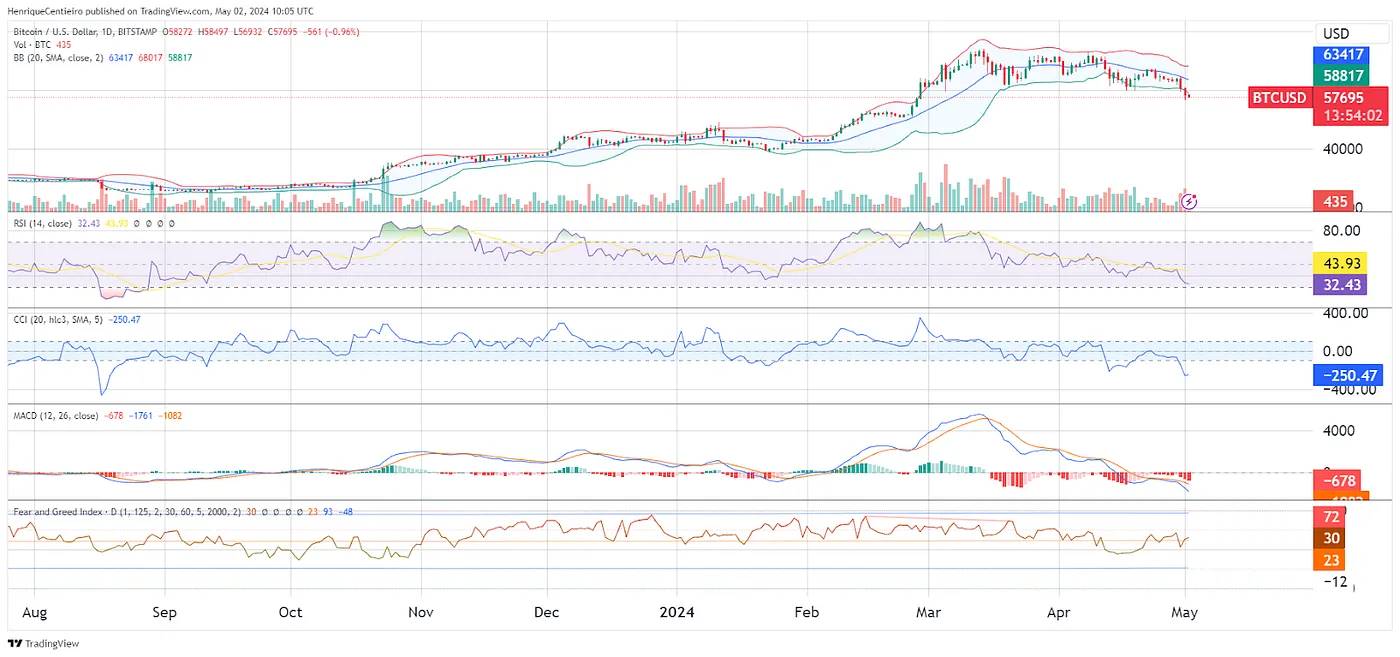
Currently, momentum oscillators are mostly neutral to oversold.
-
Bollinger Bands: Oversold
-
RSI: Neutral/Oversold
-
CCI: Oversold
-
MACD: Oversold
-
Fear & Greed Index: Neutral
Based on the levels shown in the chart above, a retracement toward $67,000 can be expected.
BTC vs ETH
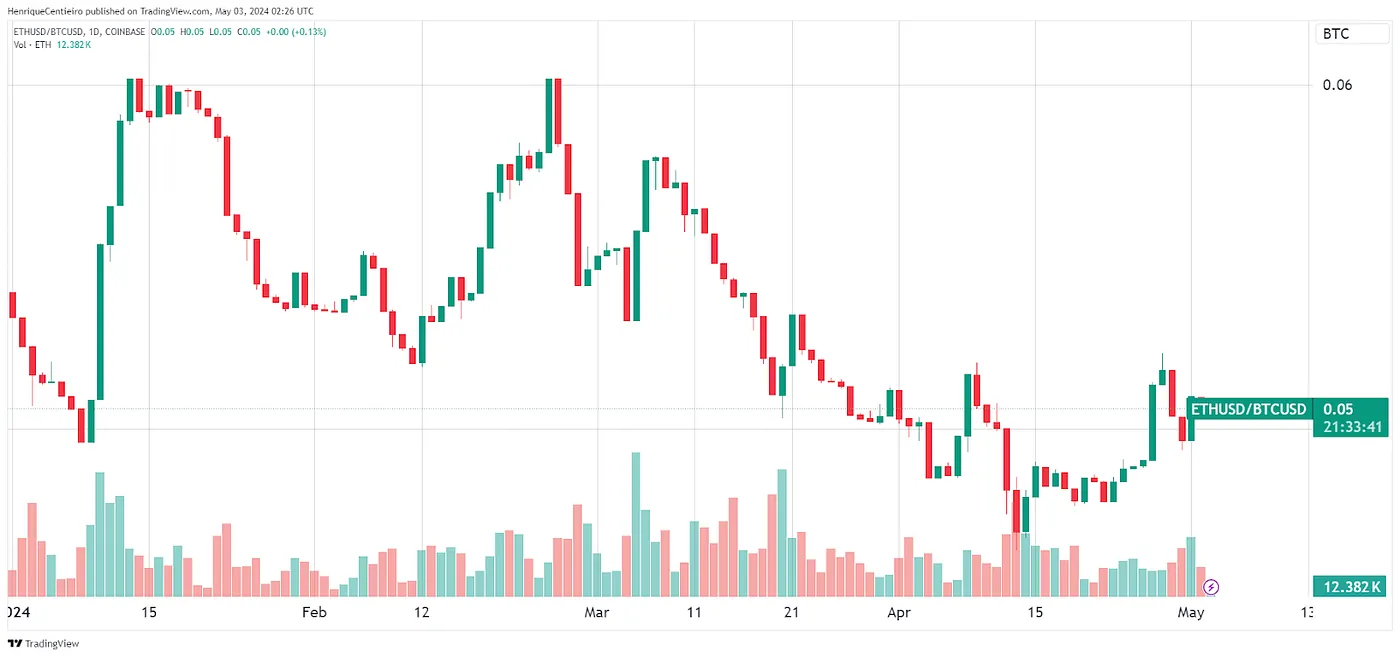
ETH lost ground in its performance relative to BTC. The ETH/BTC ratio has declined by 6% since the beginning of the year. On one hand, this indicates that ETH has lagged behind BTC in price action. On the other hand, this could be seen as a bullish signal, as ETH (and its associated L2 ecosystem) still has room for growth.
In April, the biggest topic among retail investors was memes. Among the top 100 market cap coins, two of the best performers were memes: Bonk and Pepe.
Other top-performing coins (vs BTC) were:
-
Neo (+22%) — Layer 1 protocol
-
Toncoin (+17%) — Layer 1 protocol
-
Tron (+16%) — Layer 1 protocol
-
BNB (+12%) — Layer 1 protocol
-
Ondo (+11%) — RWA
The main trends remain memes, artificial intelligence, gaming, DePIN, and DeFi, with the latter gaining strong traction due to LSTfi, restaking, and DeFi on emerging chains such as Linea.
Ethereum Price, Upgrades, and Burn
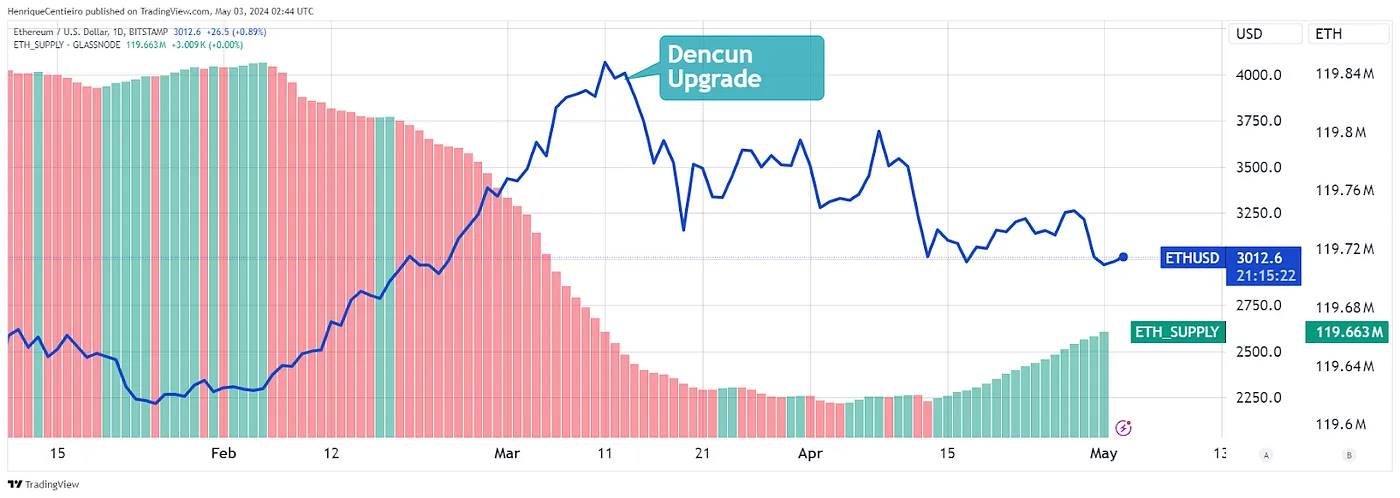
Ethereum closed Q1 2024 at $3,507, up 59.9% for the quarter. The peak during this period occurred just before the Dencun upgrade (March 13). The Dencun upgrade includes EIP-4844, also known as Proto-Danksharding, which significantly reduced fees on L2 chains, greatly improving the user experience across the Ethereum ecosystem. Now, user transaction fees on L2 rollups can be less than $0.01.
ETH price rose 15% since the beginning of the year but declined 9% month-on-month, and has dropped 27% since the Dencun upgrade on March 13.
Since The Merge upgrade (September 2022), Ethereum has become a deflationary asset, with net supply reduced by nearly 1 million ETH (over $3 billion). In Q1 alone, Ethereum’s circulating supply decreased by 0.2%.
Since the beginning of the year, ETH supply has decreased by 0.16%, approximately 187,000 ETH (~$650 million). However, in April, ETH supply increased by about 38,000 ETH.
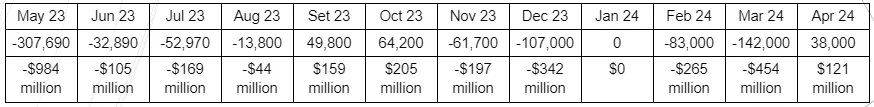
Monthly Ethereum Supply Change
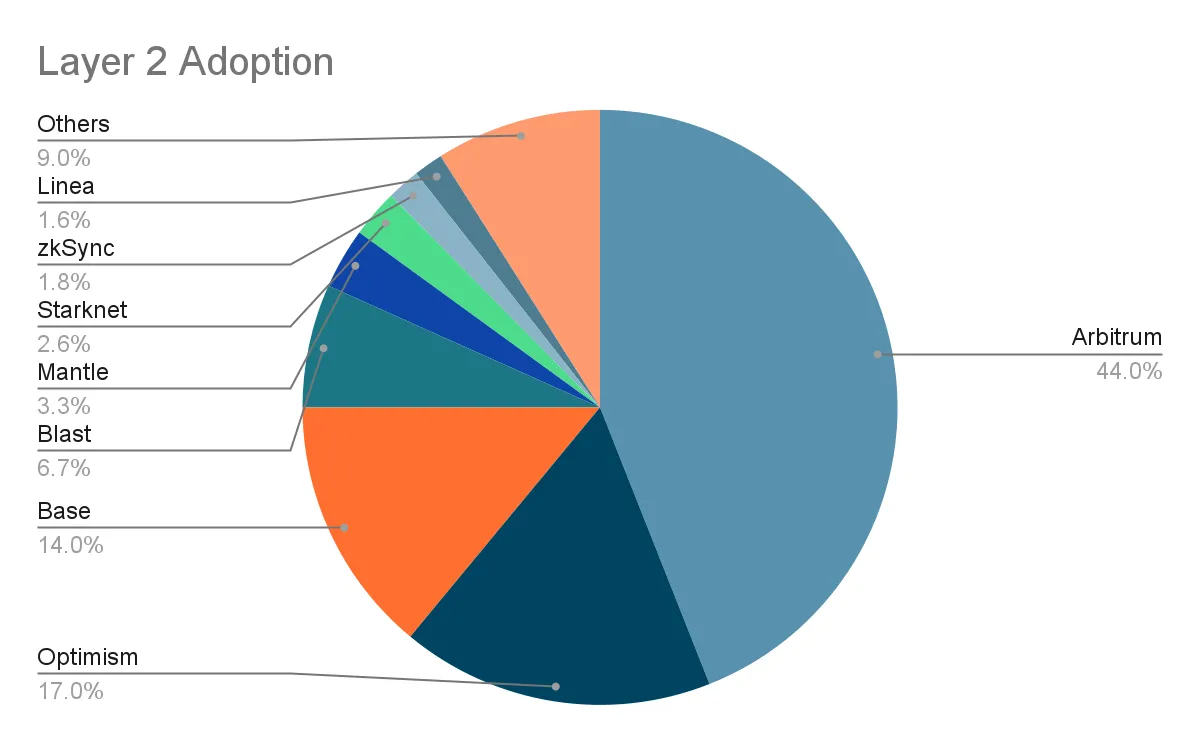
L2 Adoption
L2 networks currently handle over $36 billion in TVL and process 11 times more transactions than the Ethereum mainnet. Since the Ethereum Dencun upgrade on March 13, the user experience on L2s has improved significantly, especially in terms of transaction fees. In some cases, fees have been reduced by over 90%. Proto-Danksharding introduced Blobs, which act as data attachments to blocks.
The primary beneficiaries of the upgrade are Ethereum rollup chains, which now enjoy lower fees and faster transaction settlement. By making rollup transactions faster and cheaper, the upgrade improves user experience and could increase user adoption across the Ethereum ecosystem (including against competitors). This will positively impact L2s, as they become cheaper to operate and may see increased revenue.
In addition to Proto-Danksharding, the following upgrades were included in Dencun:
-
EIP-1153: No Fork Frontier — enables future network upgrades without hard forks
-
EIP-4788 and State Receipt Credentials — improve communication between consensus and execution layers to boost network efficiency. State receipt credentials contain only basic transaction information.
-
EIP-5656 and MCOPY opcode — enhance memory operations to improve smart contract efficiency, resulting in faster execution and lower fees.
-
EIP-6780 and SELFDESTRUCT gas metering — better gas calculation for the selfdestruct function.
All these updates are part of Ethereum’s long-term roadmap, ultimately aiming to transform Ethereum into the settlement/security layer for the internet.
Spot Trading Volume
March 2024 was the fourth-highest volume month in history, with $2.48 trillion traded. High trading volume signals increased market activity, confirmation of market trends, and rising institutional interest.
On the other hand, trading volume in April dropped to an annualized average of about 500,000 BTC per day.
Centralized Exchange (CEX) and Decentralized Exchange (DEX) Volume
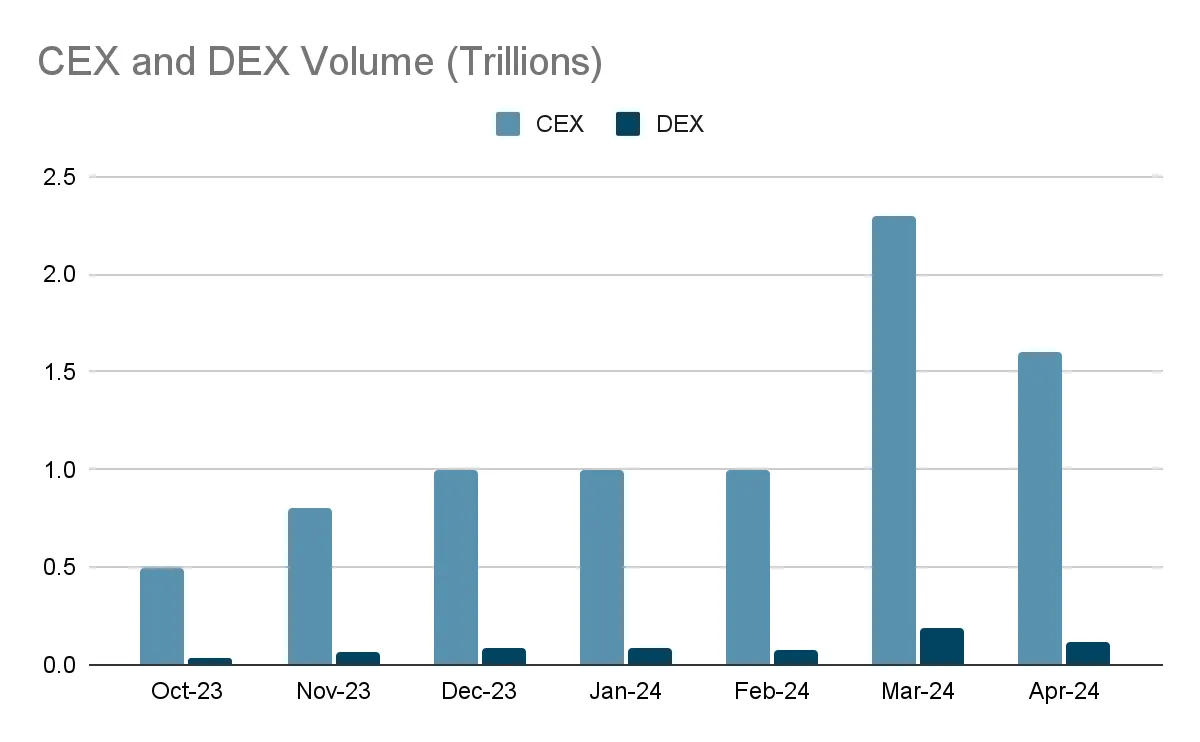
CEX volume increased by 95% in Q1 2024, while DEX volume rose by 78%. Compared to March, April saw a 31% decline in volume, although it remains well above the average monthly volume over the past six months.
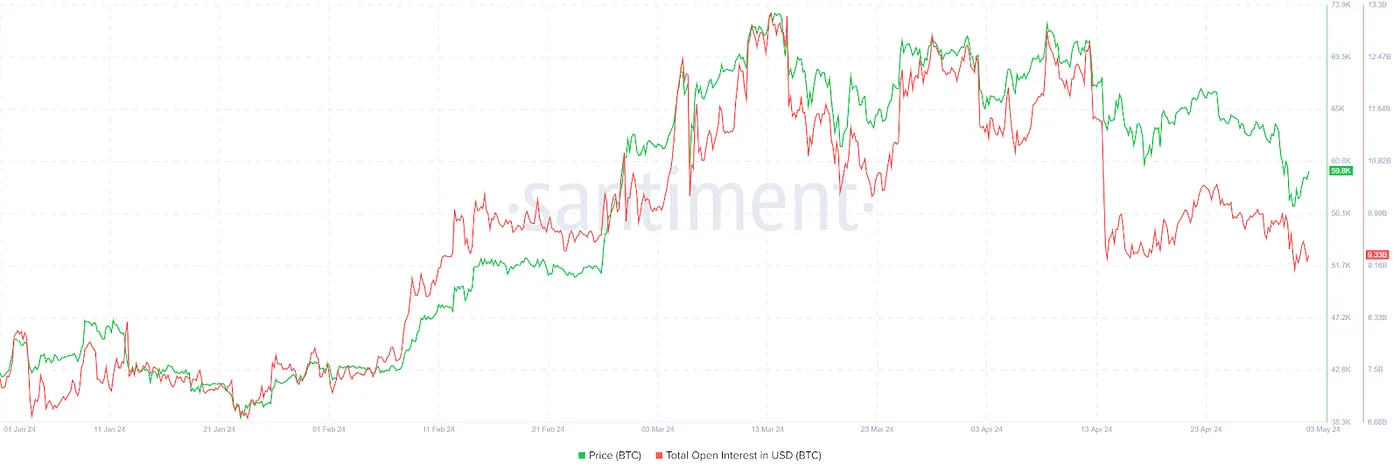
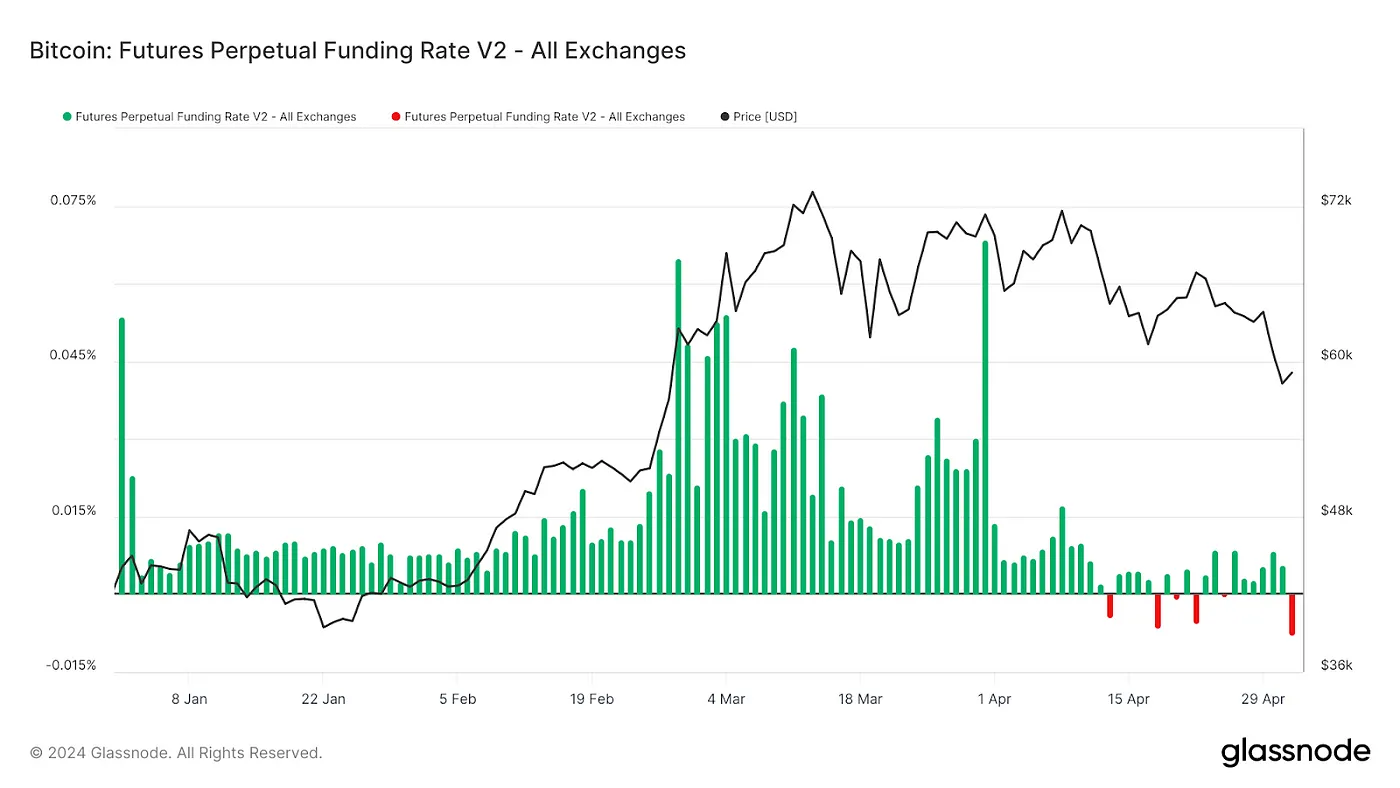
Futures Data
Funding rates were generally high and positive, indicating more longs than shorts. However, liquidation events pushed funding rates into negative territory.
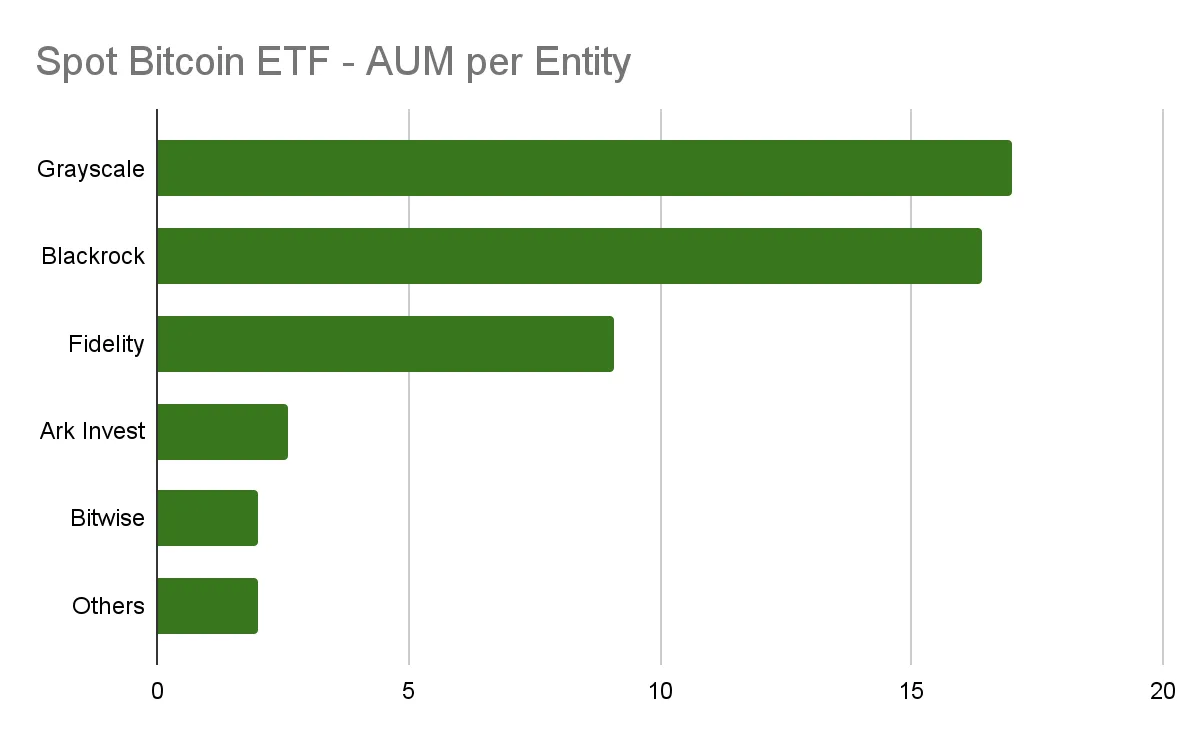
Spot Bitcoin ETFs
U.S. spot Bitcoin ETFs held $5.2 billion in AUM by the end of April. BlackRock’s ETF set a record with 72 consecutive days of positive net inflows, reaching $16.4 billion in AUM by month-end.
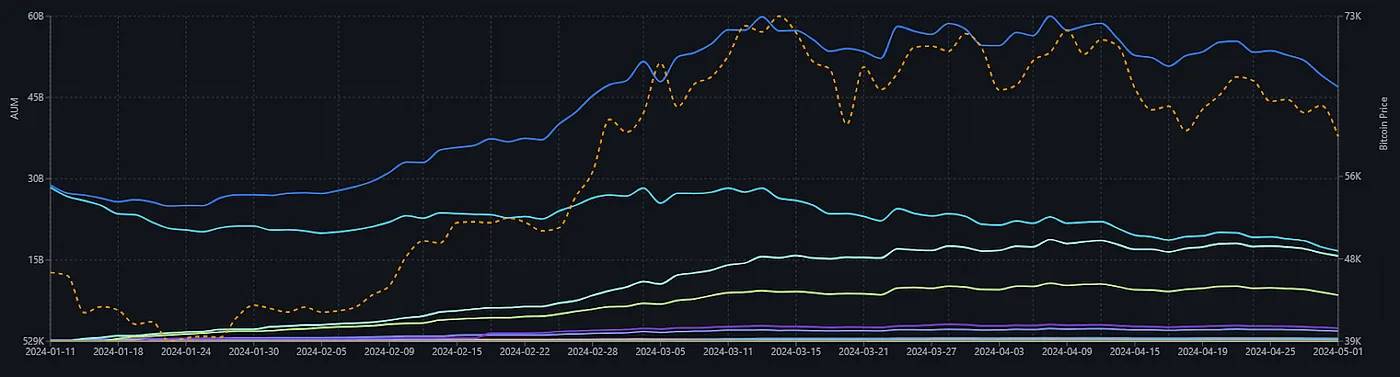
HashKey also made history on April 30, becoming part of Hong Kong’s first spot Bitcoin and Ethereum ETFs alongside Bosera. HashKey’s BTC ETF ticker is 3008, and ETH ETF is 3009.
Crypto Venture Investment Activity
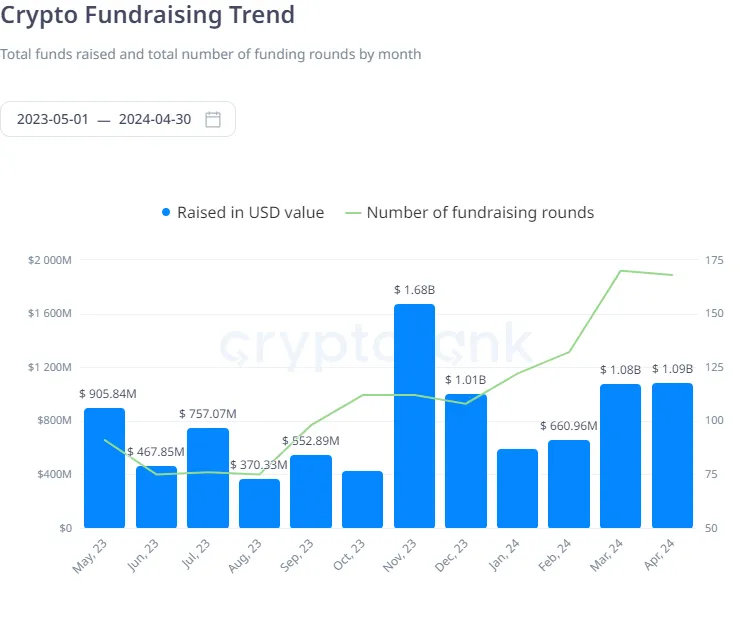
Compared to much of 2023, venture investment activity has increased. In March and April, crypto startups attracted over $1 billion in funding each month.
Market Share, Dominance, and M2 Correlation
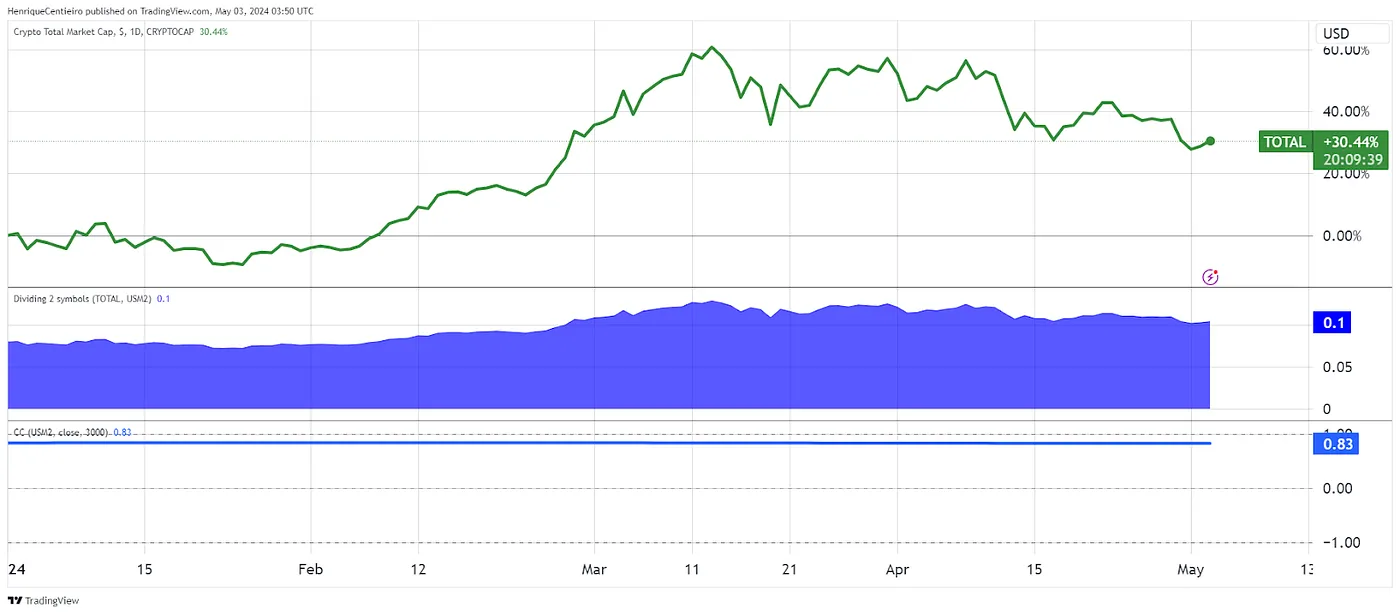
The 10-year correlation between crypto market cap and U.S. M2 is 0.83. We can also observe that despite no significant increase in M2 over the past two years, crypto market cap has grown substantially.
The middle line shows the crypto_market_cap / US M2 ratio, currently at 0.10. This means that if we compare the size of the crypto market to U.S. M2, crypto represents 10% of it.
Interpretation: Crypto assets are capturing an increasing share of market capital. This ratio is approaching the previous all-time high of 0.14. However, there is a key difference: the prior 0.14 high in November 2021 was driven by extremely loose monetary policy. This suggests the current market surge is more fundamentally driven rather than simply fueled by monetary expansion.
Bitcoin and Google Trends
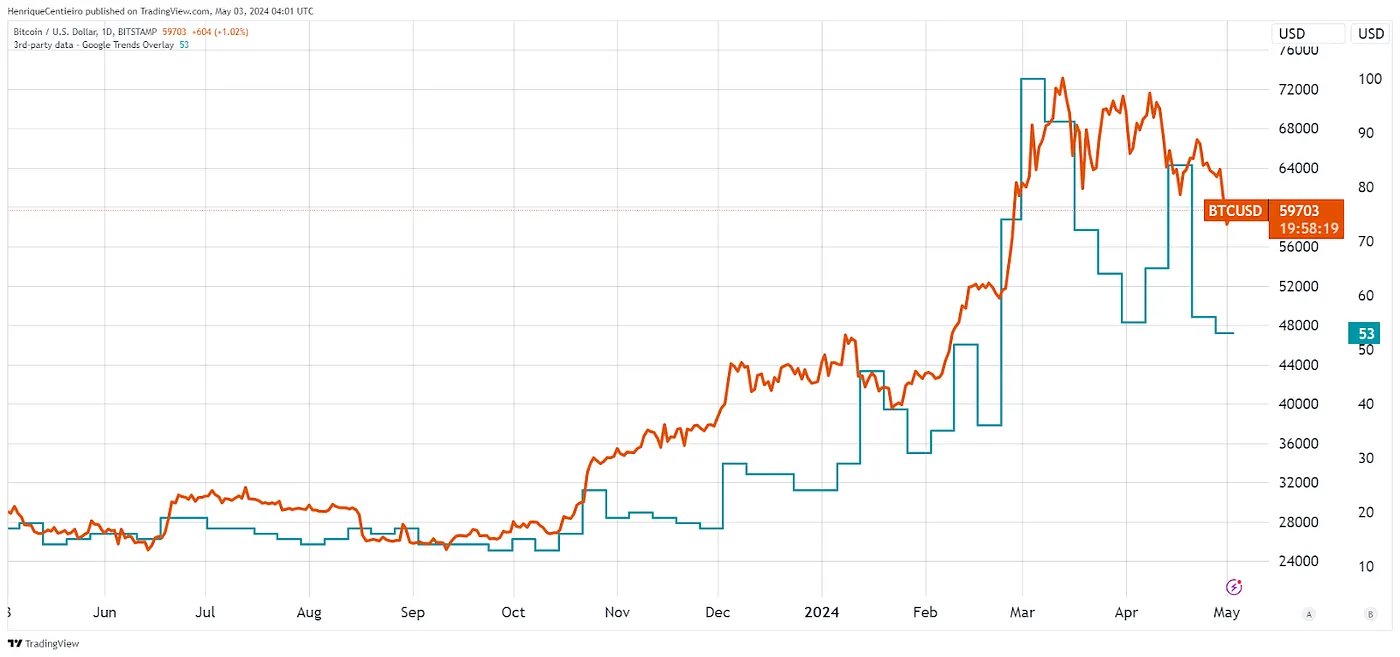
According to our analysis, there is a significant correlation between Google Trends (search frequency) and Bitcoin price.
Coincidentally, low Google search volume indicates a relatively quiet retail market, which historically has formed good buying opportunities.
Compared to last year, Google Trends data shows a sharp increase in Bitcoin-related searches. However, it should be noted that over time, fewer people may search for Bitcoin as awareness grows. Despite a drop in search volume in April, it still exceeds 90% of all historical months.
Bitcoin Hashrate, Hash Metrics, and Mining Revenue per TH/s
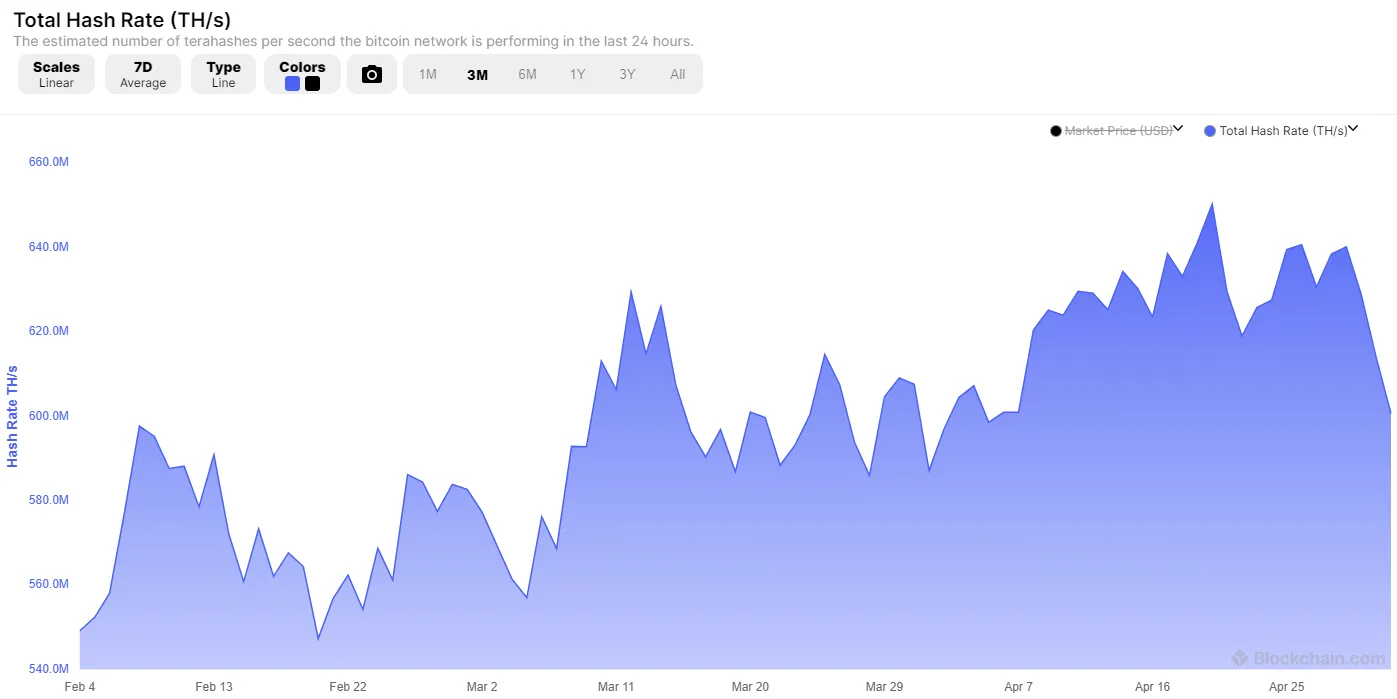
Bitcoin hashrate measures the computational power on the network and reflects network security.
Despite the approaching halving, hashrate continued to reach new all-time highs, increasing by 2% in Q1 2024.
However, after the halving on April 19, when the block reward dropped from 6.25 to 3.125 BTC, Bitcoin’s hashrate declined by 7.5%. With reduced mining rewards, higher-cost miners become unprofitable.
Nevertheless, April 2024 was the month with the highest transaction fee revenue for users. This is also a crucial income source for miners.
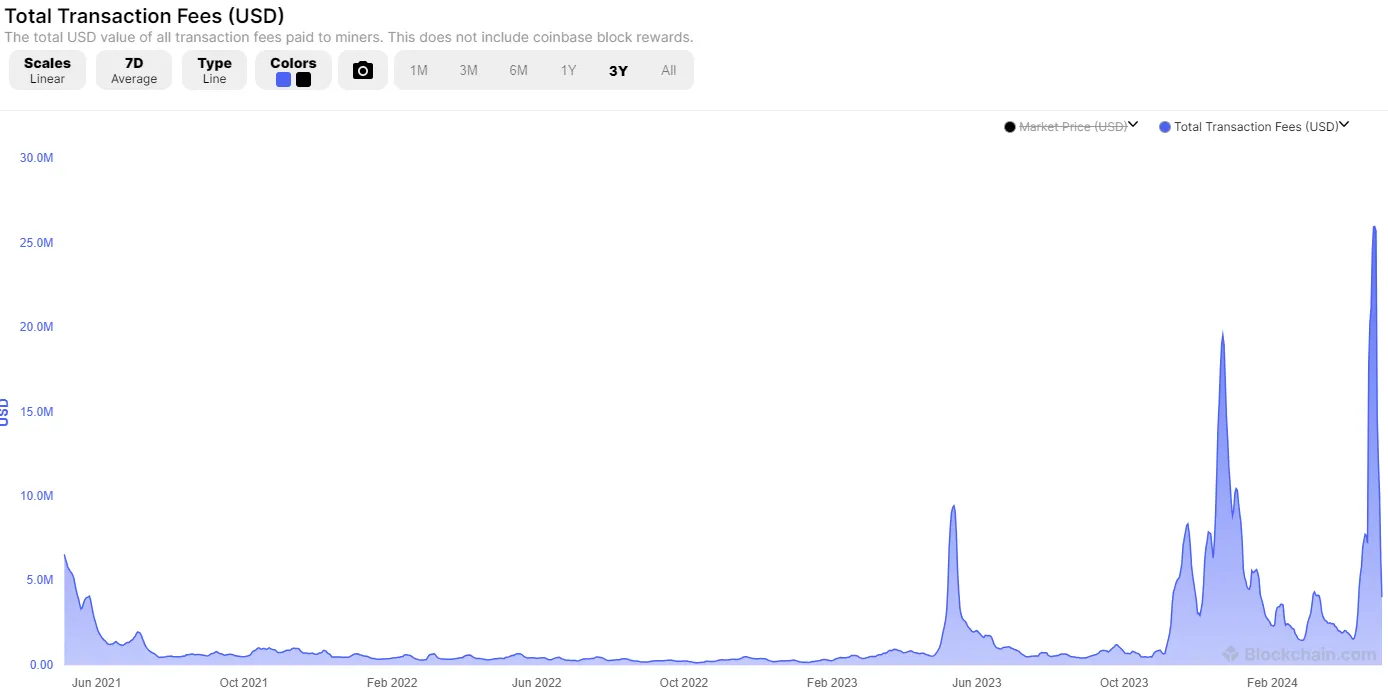
With growing network activity and the resurgence of BRC-20, Runes, and Bitcoin L2 chains, transaction fees are likely to continue rising and may eventually replace block rewards as the primary income source for miners.
Bitcoin Realized Profit and Loss
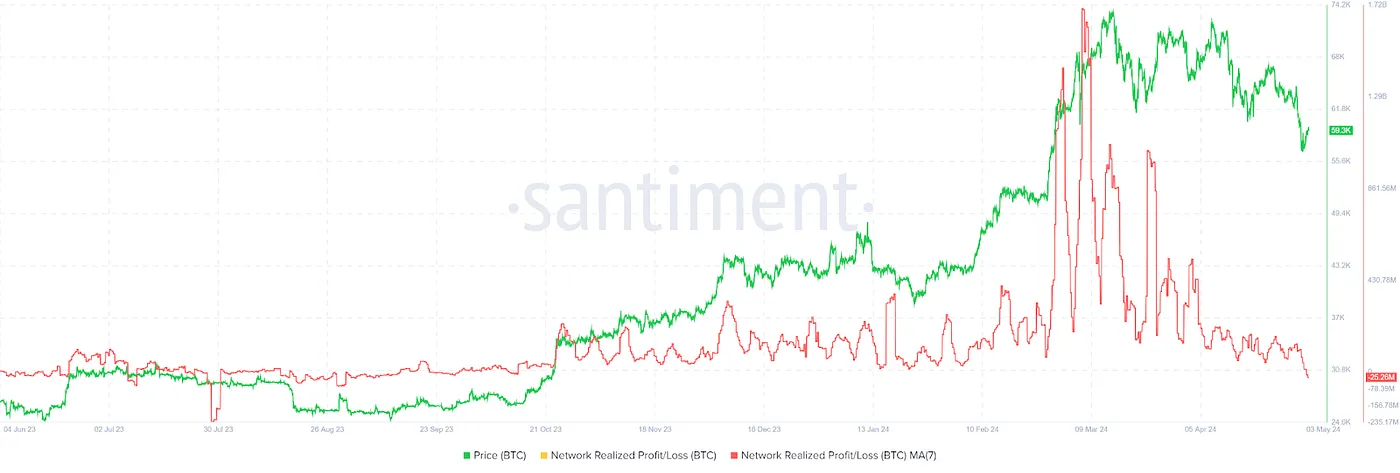
In March 2024, Bitcoin’s realized profit and loss hit a new high. However, in late April, realized profit and loss turned negative. This key metric uses the concept of price tagging, where each UTXO is assigned a cost basis.
When the value is negative, it means investors may be selling Bitcoin at a loss. This is a capitulation signal (typically a relatively good buying opportunity). This can be interpreted as indicating more upside potential after the market correction.
DeFi Activity
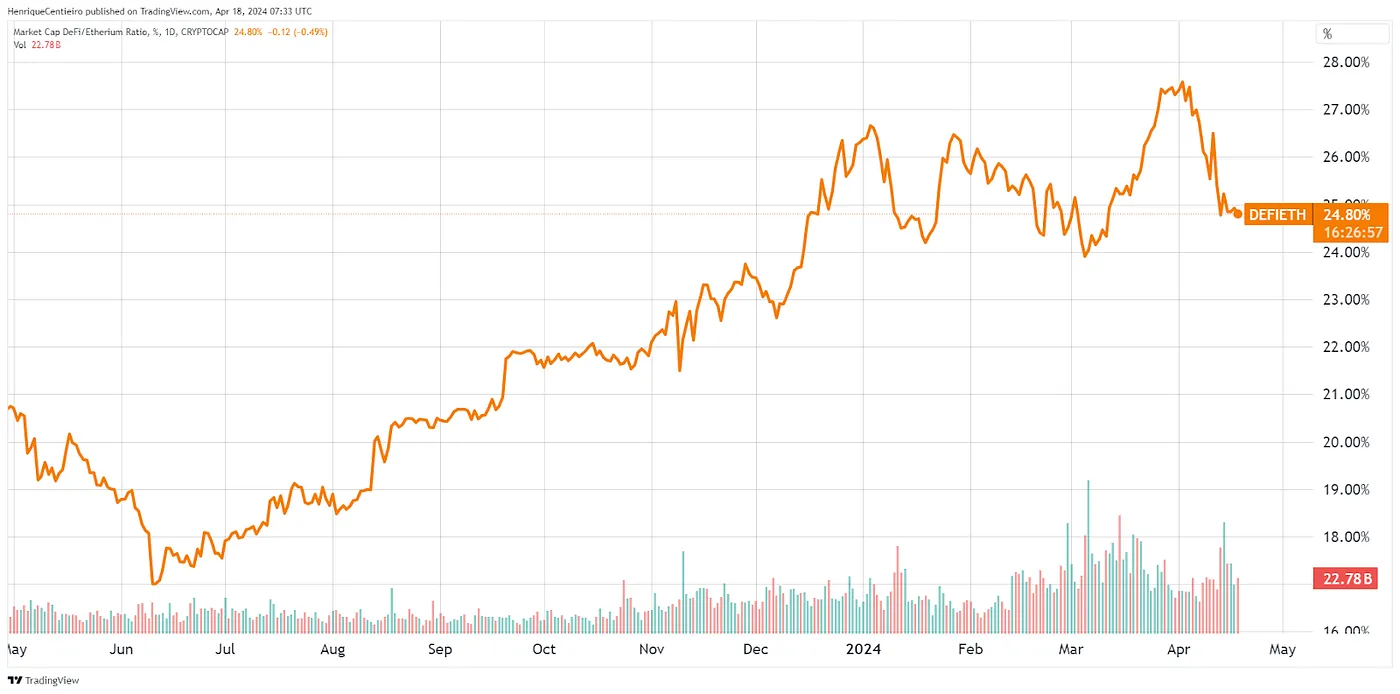
Over the past six months, we’ve seen a significant increase in DeFi activity. DeFi’s market cap has risen from 17% to 25% of Ethereum’s market cap, indicating accelerated DeFi activity relative to ETH price movements.
Meanwhile, DeFi has been one of the biggest winners in the space. As shown in the chart below, DeFi’s market cap rose from $35 billion to $120 billion over six months.
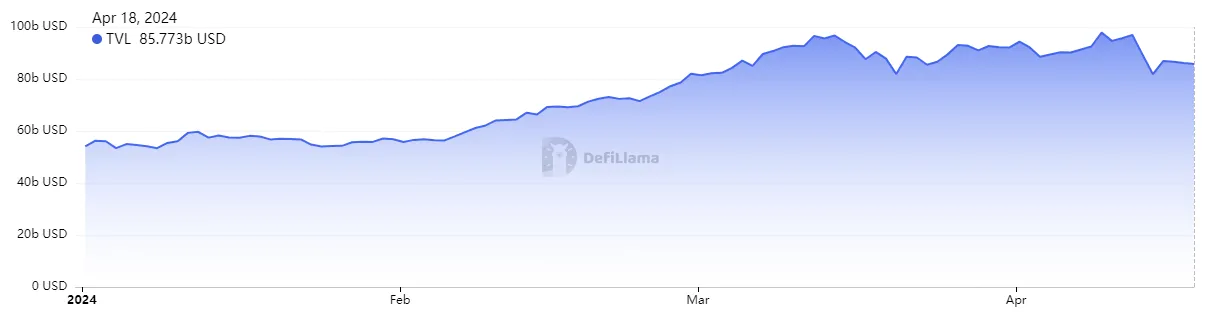
Additionally, DeFi’s Total Value Locked (TVL) has grown 60% year-to-date, though it contracted by about 10% in April.
DeFi Ecosystem Overview
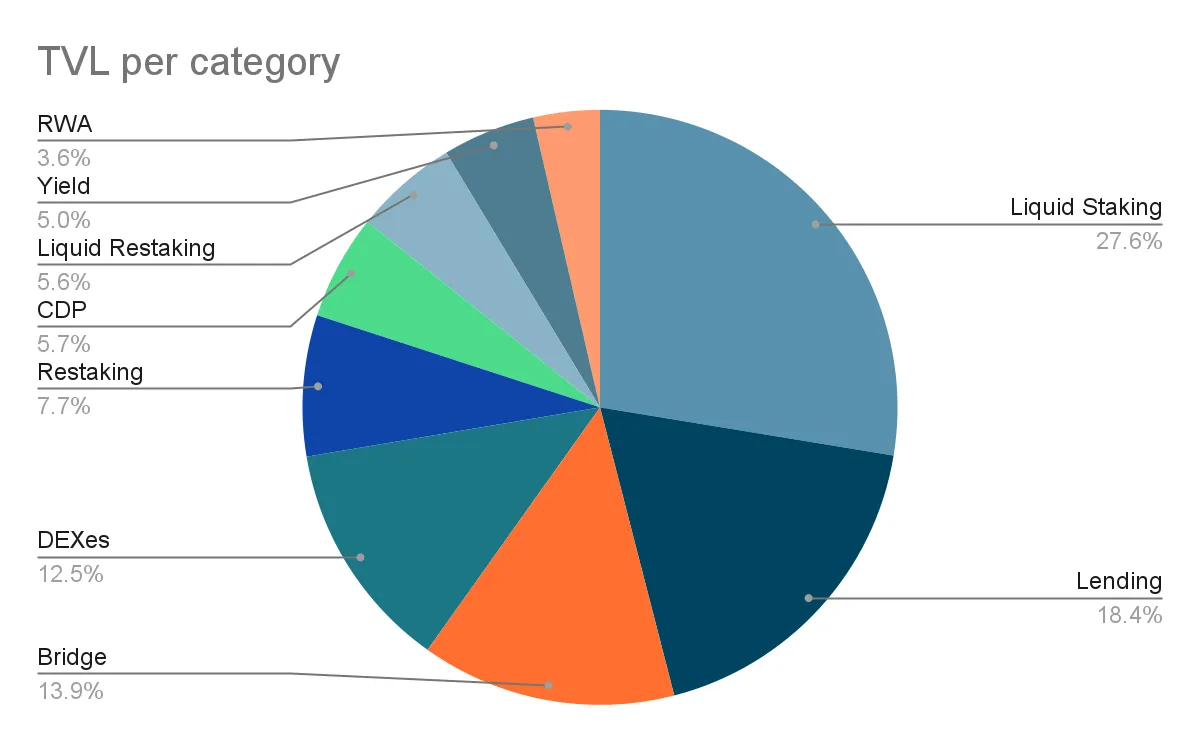
Since the beginning of 2024, liquid staking has been the dominant DeFi sector in terms of TVL. However, other use cases such as staking and yield generation have also seen substantial inflows, driven by protocols like EigenLayer, EtherFi, Zircuit, Swell, Puffer, and Pendle.
Authors:
Jupiter Zheng, Partner, Liquid Funds and Research
Vivien Wong, Partner, Liquid Funds
Henrique Centieiro, Research Manager
Join TechFlow official community to stay tuned
Telegram:https://t.me/TechFlowDaily
X (Twitter):https://x.com/TechFlowPost
X (Twitter) EN:https://x.com/BlockFlow_News