Analyzing Four Bull and Bear Cycles: Is There Really a Connection Between "Teams Actually Doing Work" and Token Price?
TechFlow Selected TechFlow Selected
Analyzing Four Bull and Bear Cycles: Is There Really a Connection Between "Teams Actually Doing Work" and Token Price?
Does "the team is actively working" really make a token price rise more during bull markets? And does it make the token more resilient during bear markets?
 Navigating Web3 tides with focused insights
Authors: LUCIDA & FALCON
When holding crypto assets, "the team is actively building" serves as both the confidence that the token price will surge during a bull market and the baseline justification for continuing to hold during bear-market drawdowns.
But does active team development actually lead to stronger price appreciation in bull markets or better downside resistance in bear markets?
This article uses 10 years of historical data to answer this question.
Four Bull-Bear Cycles in the Crypto Market
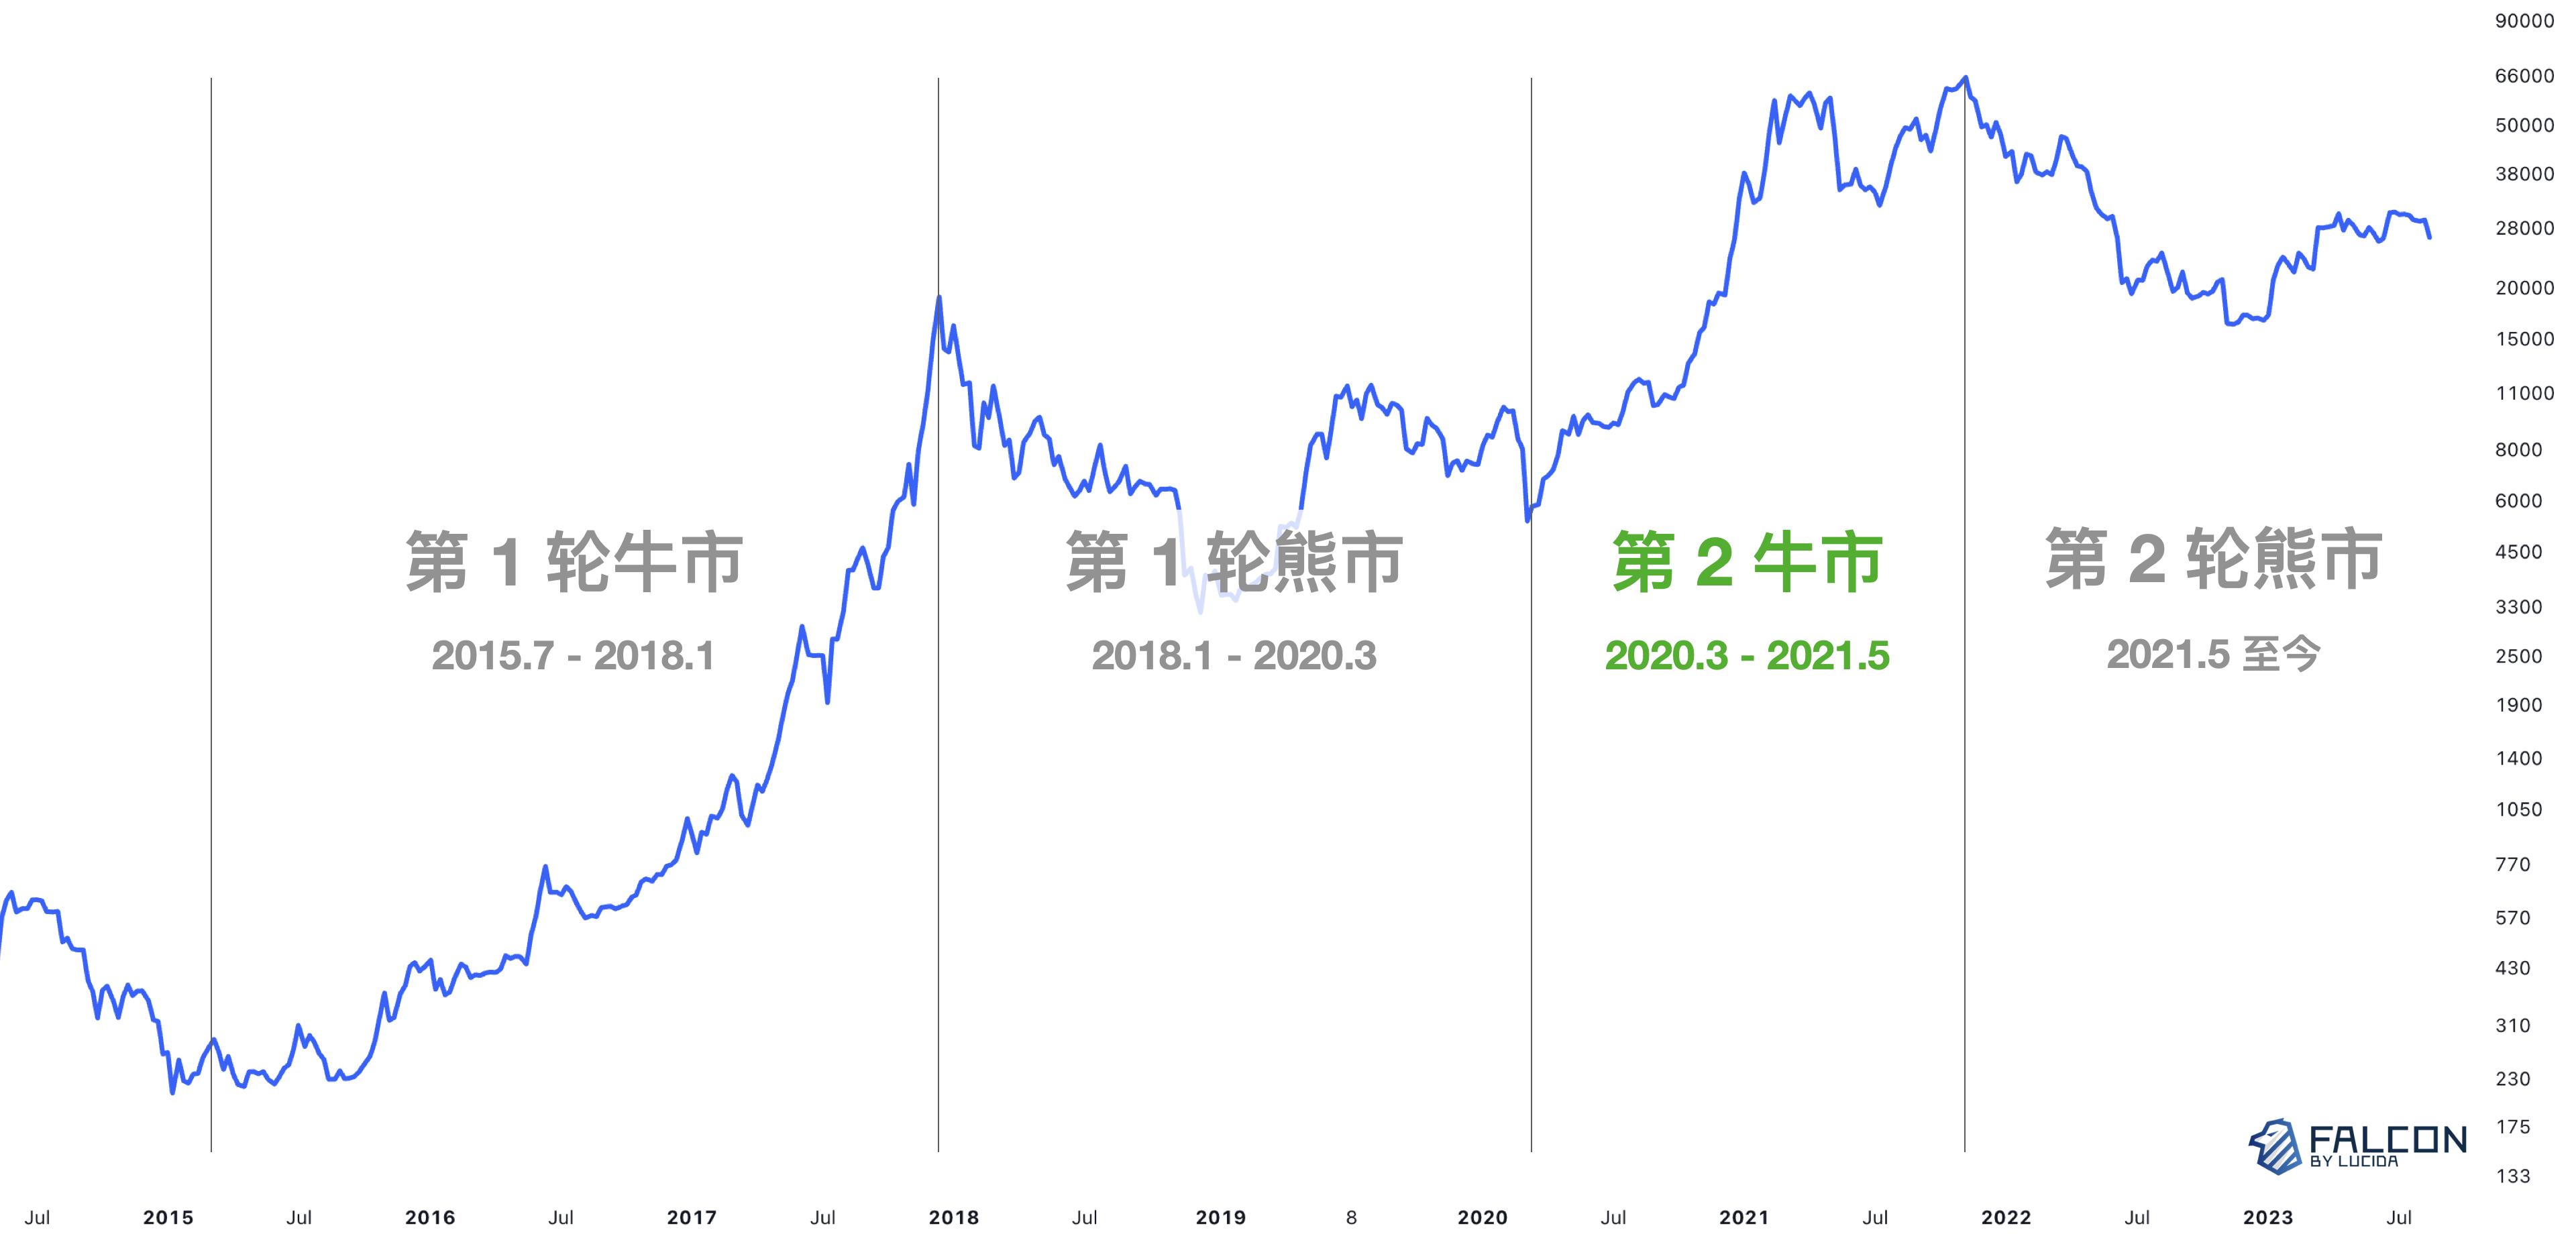
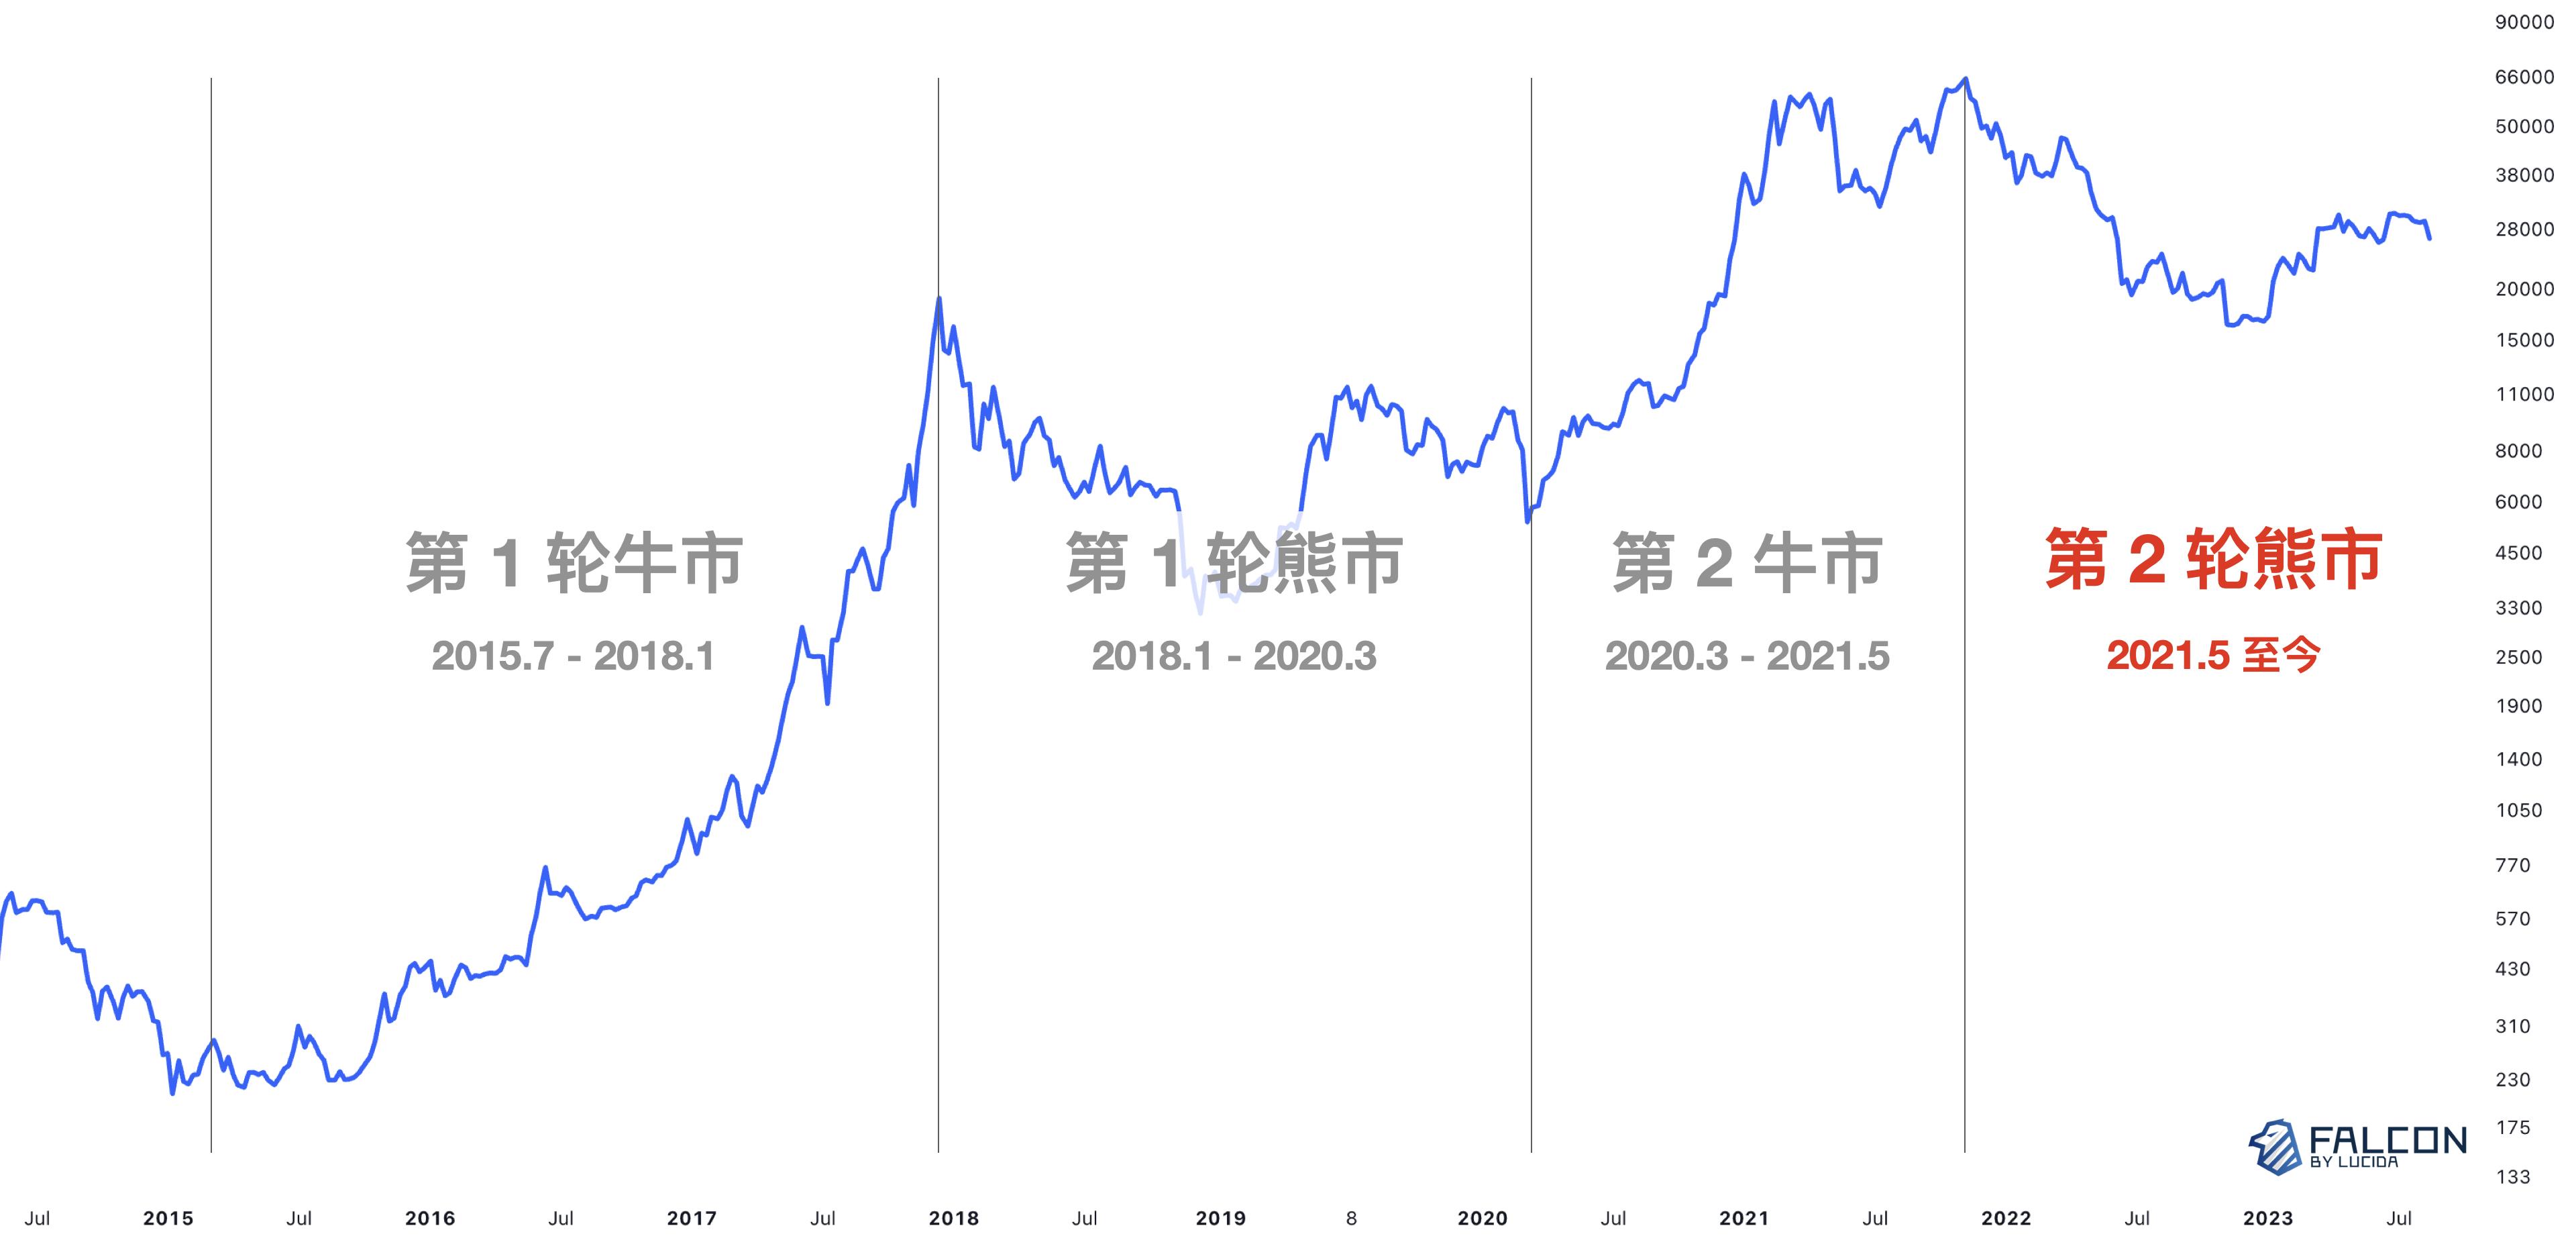
Bitcoin’s genesis block was mined in 2009. Over the subsequent 14 years, its price has experienced multiple cycles of bull and bear markets, accompanied by evolving industry narratives such as the “ICO era,” “smart contract chain boom,” “DeFi Summer,” and the “NFT wave.”
For analytical clarity, this article defines July 2015 to January 2018 as the first bull market, January 2018 to March 2020 as the first bear market, March 2020 to May 2021 as the second bull market, and May 2021 to present as the second bear market.
The first “ICO” bull market (July 2015–January 2018) occurred too long ago, with insufficient available data to yield rigorous conclusions. Therefore, this analysis focuses primarily on the latter three cycles.
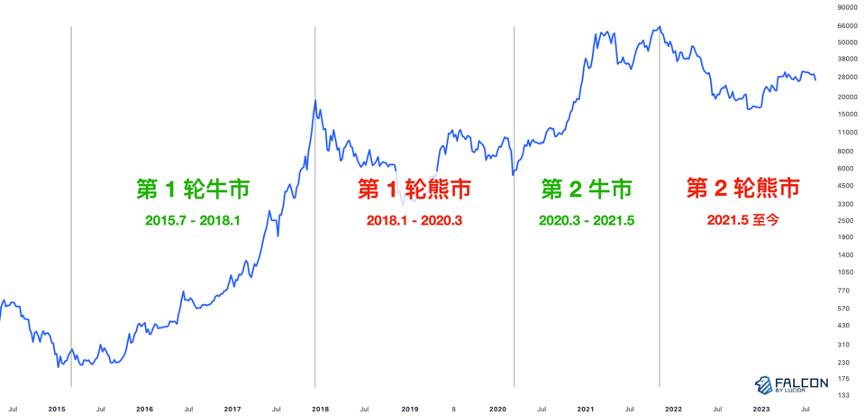
Four bull-bear cycles in the crypto market
What Metrics Reflect 'Team Activity'? We Identified Six Factors
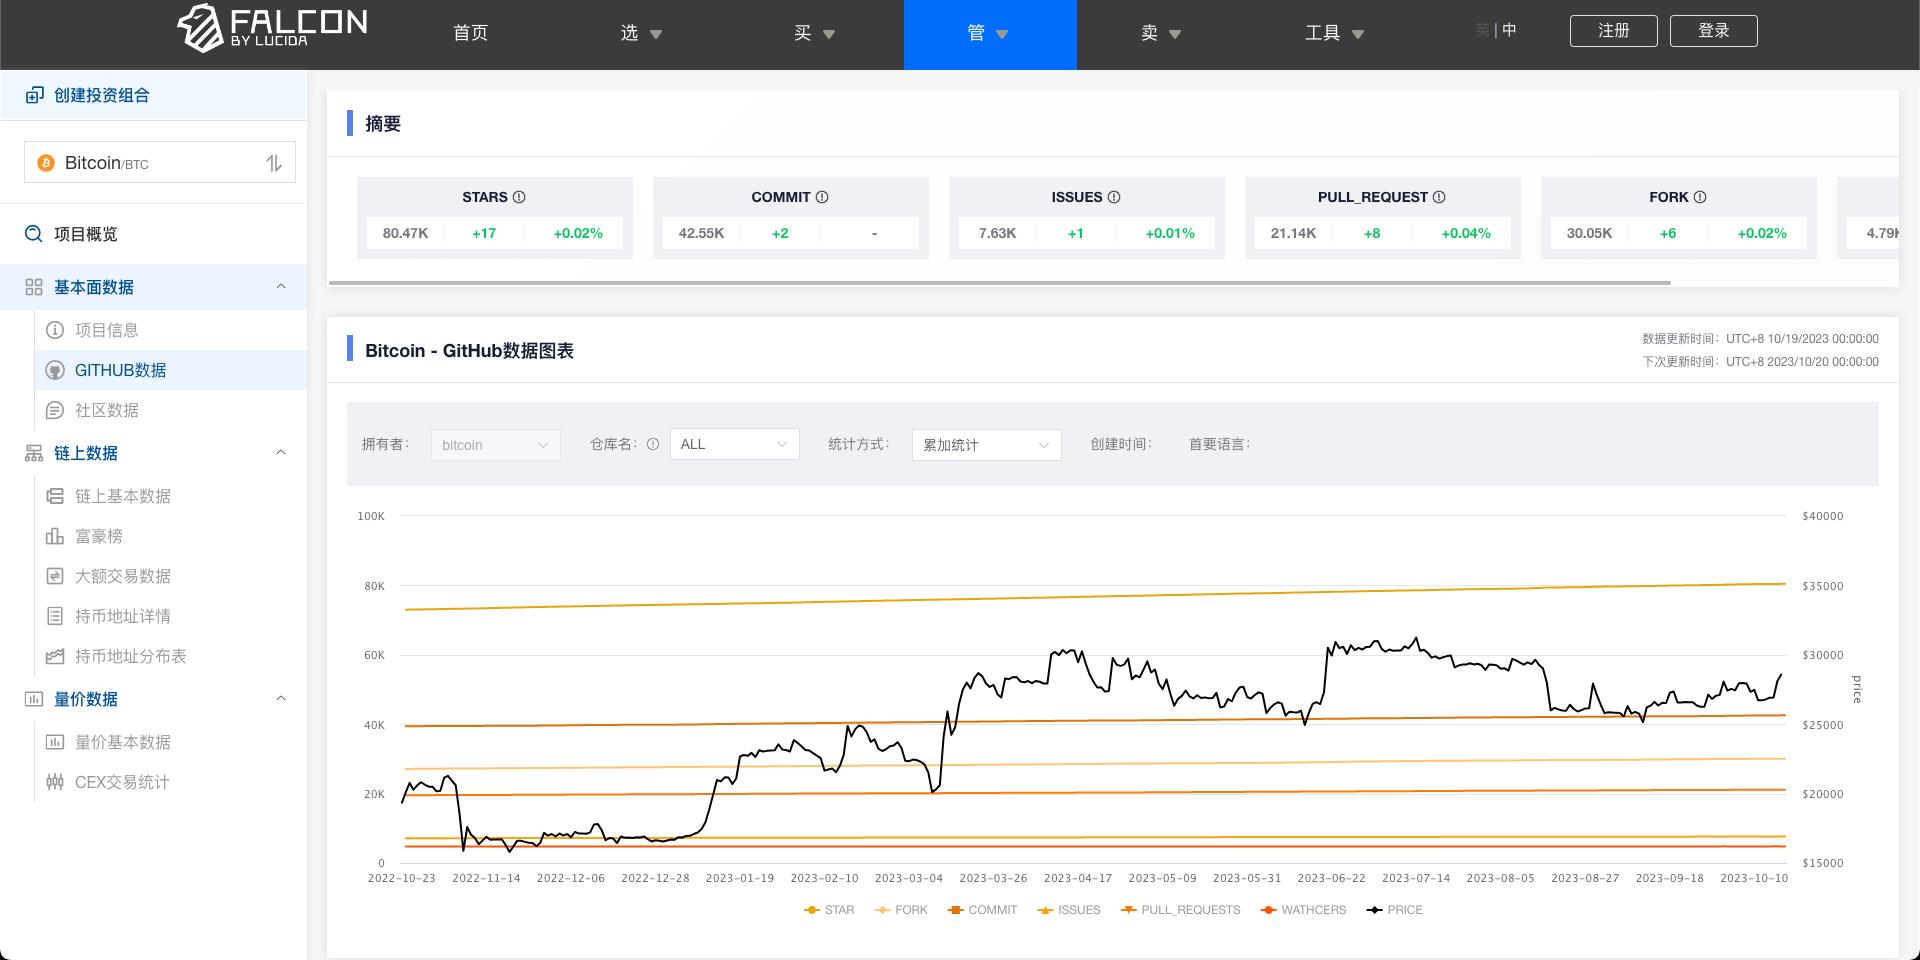
The vast majority of projects in the industry are built on blockchain technology, with open-source code hosted on GitHub (a platform for code sharing and version control).
Therefore, Falcon uses six GitHub metrics as quantitative proxies for measuring "team activity." These include: Star, Fork, Commit, Issues, Pull Requests, and Watchers. Below are definitions and types for each factor:
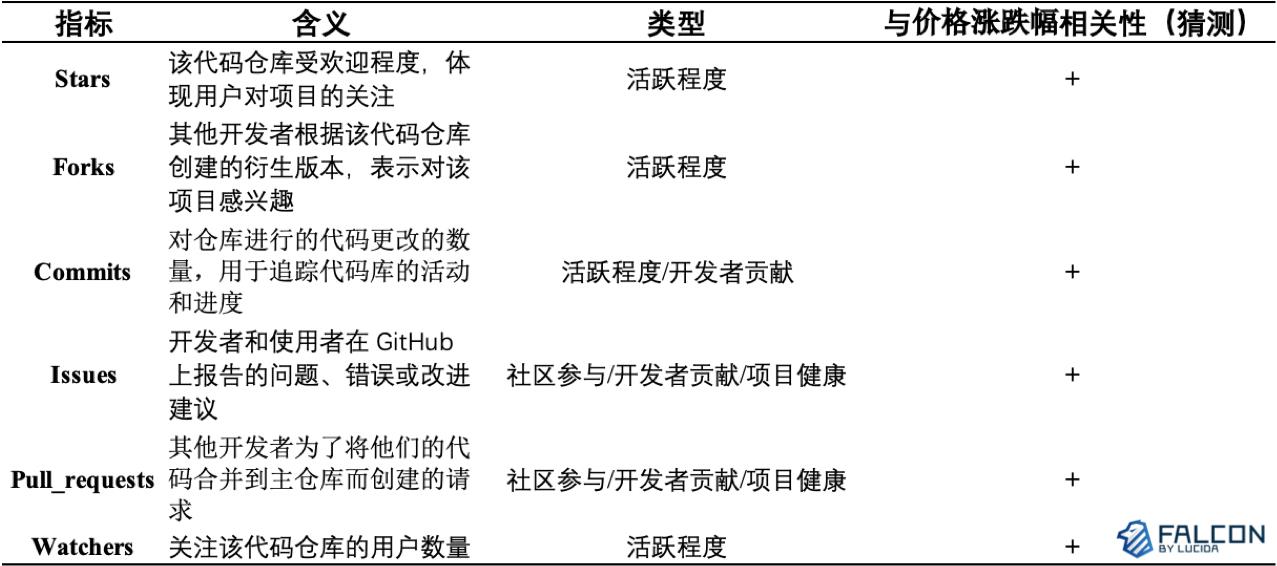
Detailed introduction to the six GitHub data factors
All GitHub data for the projects mentioned in this article can also be viewed on Falcon's product platform. Visit link.
Effective Sample Size and Terminology
We collected token price movements and corresponding GitHub six-factor data across three market cycles. After removing outliers, we retained 81, 330, and 596 valid token samples for each cycle respectively.
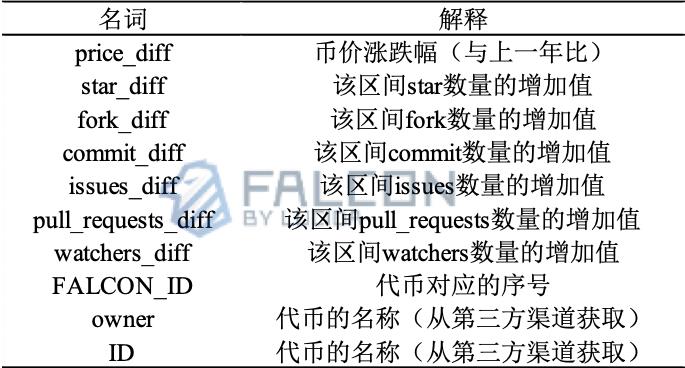
Definitions of terms appearing in charts below:
Term definitions
First Bear Market (2018.1–2020.3): GitHub Data Provided Limited Downside Protection, Likely Due to Small Sample Size
Let’s begin with the first bear market:

Descriptive statistics of the six GitHub factors and token price changes:

Token data during the first bear market was highly dispersed, reflecting the early-stage characteristics of the crypto market. For all seven statistical measures, standard deviations were far from the mean, indicating large disparities between tokens in price performance and GitHub engagement. Well-established tokens like Bitcoin and ETH had extremely high levels of GitHub attention across all factors, while many emerging tokens showed minimal GitHub activity.
Statistics for tokens whose price decline was less than the average (bolded black):

Gray cells represent tokens moving against market trends. We consider these cases exceptional and require contextual analysis. Only Binance Exchange falls into this category. Its GitHub data shows high Star and Fork values (top 10), but extremely low Commit, Issues, Pull Requests, and Watchers—because BNB functioned solely as a utility token before 2019 without public chain functionality, so its code was not open-sourced. However, platform tokens became a market focus in late 2018, driving strong BNB price performance and relative resilience in this cycle. For this token, only Star and Fork show some correlation with price.
Among tokens with declines smaller than the average, 40% ranked in the top 10 for at least one GitHub factor, while the rest generally showed low GitHub activity. We preliminarily conclude that GitHub activity had a modest positive effect on reducing downside risk in this cycle, but the impact was limited.
Second Bull Market (2020.3–2021.5): More Active GitHub Projects Achieved Greater Gains
Descriptive statistics of the six GitHub factors and token price changes:

Token data in the second bull market was relatively concentrated, reflecting improved maturity and vitality in the crypto market. The standard deviations of the seven metrics were closer to their means compared to the previous cycle, indicating a more compact data distribution. From a market perspective, this reflects two trends: First, by 2020, many tokens launched in earlier years had matured significantly, leading to stronger fundamentals reflected in higher GitHub engagement. Second, the number of new token launches surged during this period, increasing the sample size and further stabilizing data distributions.
Statistics for tokens whose price increase exceeded the average (bolded black):
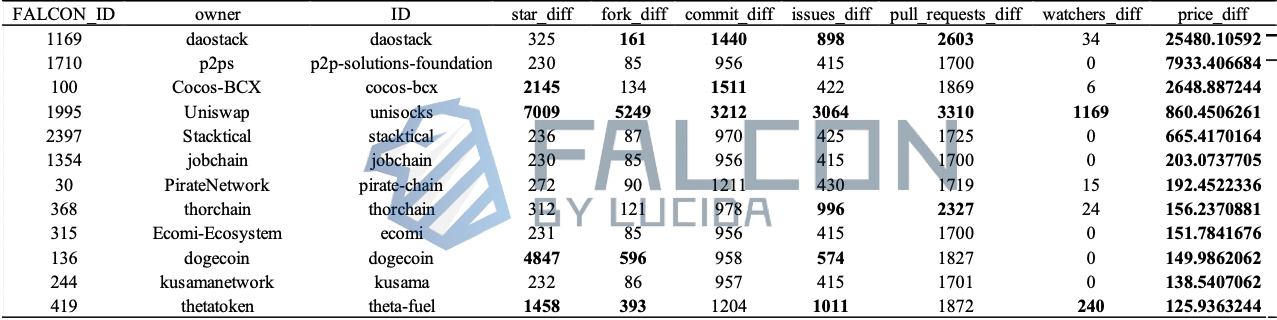
Out of 330 tokens, 11 outperformed the average price gain. Among them, 5 (about 45%) also ranked above average across the six GitHub factors. This suggests a preliminary positive correlation between GitHub activity and price appreciation, with detailed correlation strength analyzed later in the article.
Projects That Declined During the Bull Market Were All Characterized by Very Low GitHub Development Activity
Outlier cases (price declines during a bull market):

Among the 330 valid samples in this cycle, 28 tokens declined despite the overall bullish trend, indicating severe weakness. Correspondingly, over 90% of their GitHub metrics fell below average and clustered near the minimum values.
Second Bear Market (2021.5–Present): Higher GitHub Activity Contributed Modestly to Downside Resilience, But Impact Remained Limited
Descriptive statistics of the six GitHub factors and token price changes:

Sorted by Star count, the top 20 tokens and their other six metric values (bolded black indicates values above average):
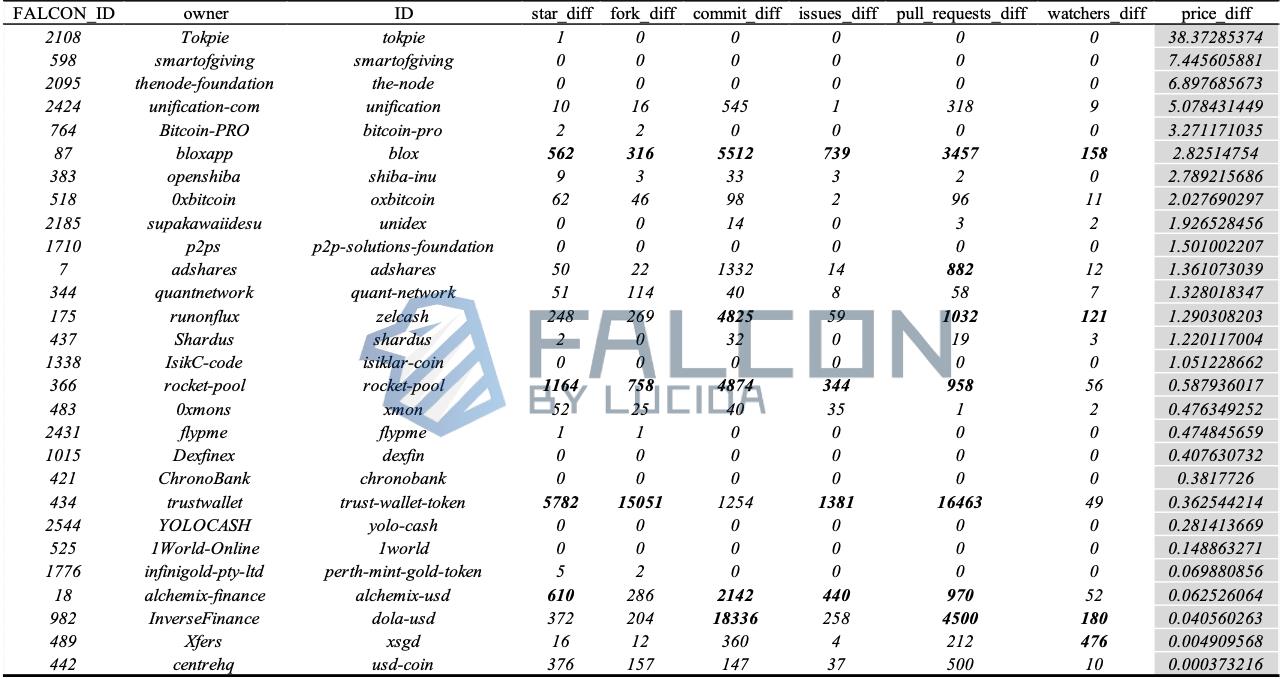
As the crypto market evolved further, token data in the second bear market became more dispersed, likely due to growing divergence among projects. Standard deviations of the seven metrics deviated significantly from their means, indicating wider data dispersion. In 2021, the token market remained in a growth phase, attracting increasing participants who initially focused on established, mature projects—reflected in GitHub metrics reaching tens of thousands for leading tokens. Meanwhile, newer tokens required time to gain visibility and developer traction, resulting in naturally lower engagement and development activity.
Analyzing the top 20 tokens by Star count reveals common statistical patterns among those exceeding average ranks across GitHub factors, suggesting high inter-correlation among the six factors. Additionally, tokens ranking exceptionally high across GitHub metrics tend to be well-established projects launched between 2015 and 2018, such as Bitcoin, ETH, and Dogecoin.
Outlier cases (price increases during a bear market):
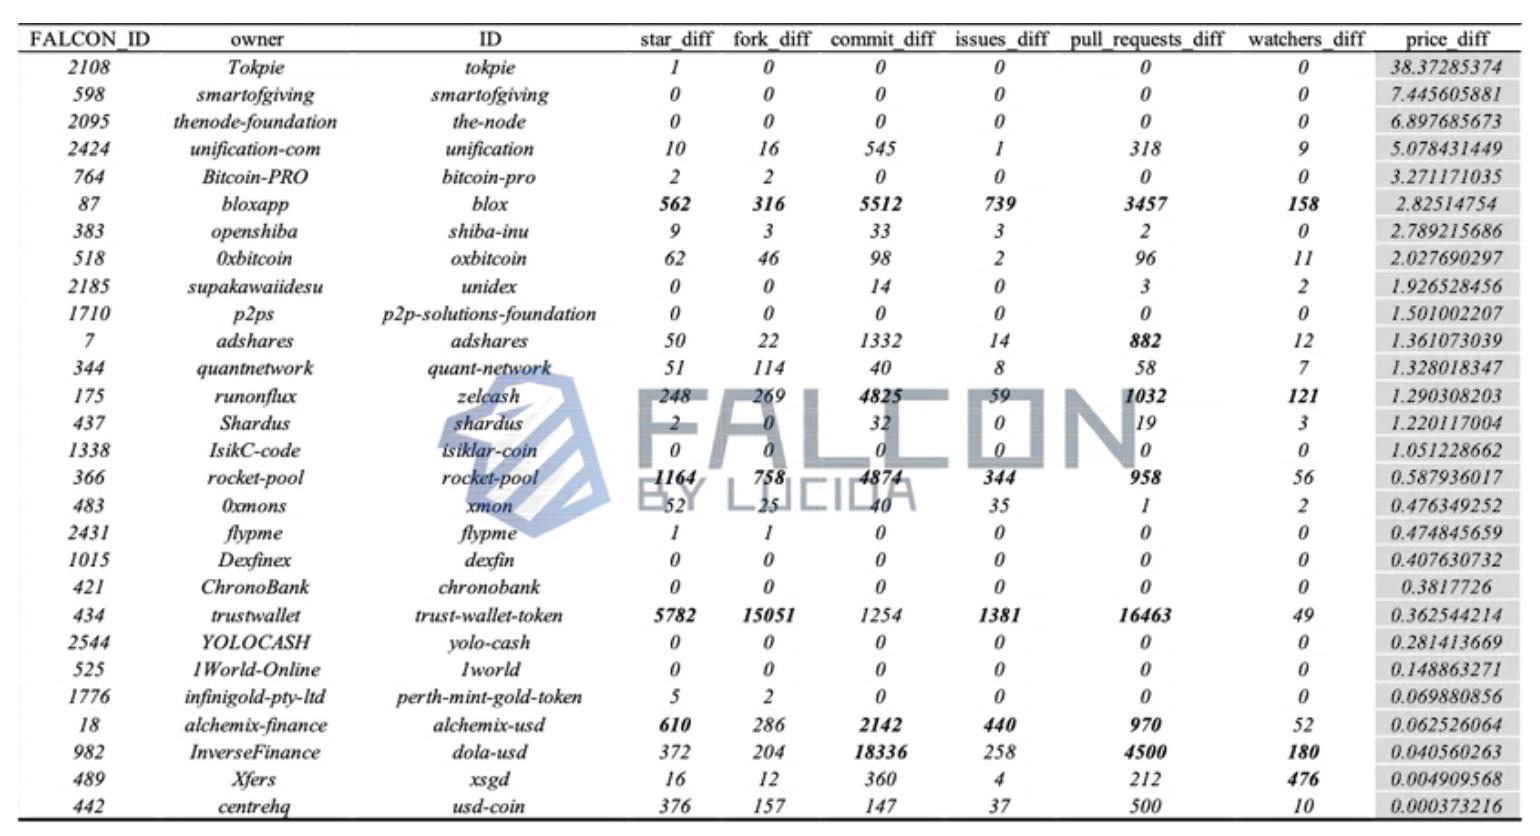
Among 596 tokens, 28 were outliers. Of these, 6 (28%) had at least one GitHub factor above average. Based on the table, we infer that increased GitHub activity contributes modestly to downside resilience during bear markets, but the effect is not substantial. Their strong price performance is primarily driven by other factor categories.
How to Quantify the Correlation Between GitHub Factors and Price? Which Coefficient Should We Use?
In previous sections, simple statistical analysis revealed differing roles of GitHub data across bull and bear cycles.
How can we quantify the correlation between GitHub metrics and token prices?
Q-Q plots use sample quantiles as the x-axis and theoretically expected normal distribution quantiles as the y-axis, plotting data points in Cartesian coordinates. If the dataset follows a normal distribution, the points align closely along the diagonal line. Data following a normal distribution should be analyzed using Pearson correlation coefficient; otherwise, Spearman rank correlation is more appropriate.
Q-Q plot results for the six factors across the three periods are shown below:

As shown, none of the six factors (Star, Fork, Commit, Issues, Pull Requests, Watchers) across the three periods follow the diagonal line, meaning they do not conform to a normal distribution. Thus, correlations between GitHub factors and token prices will be assessed using the Spearman coefficient.
First Bear Market (2018.1–2020.3): Limited Correlation Due to Small Sample Size
Correlation table between six GitHub factors and price returns:
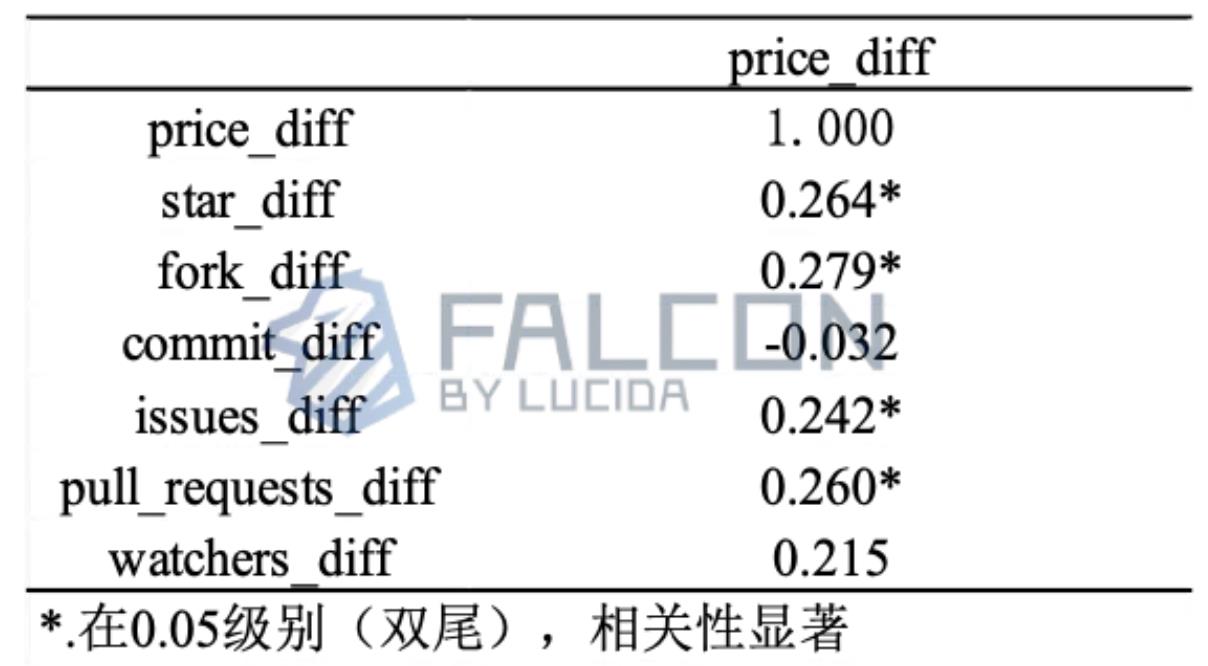
Five of the six GitHub factors show a positive relationship with downside resilience during the bear market. As seen in the table, Star, Fork, Issues, Pull Requests, and Watchers all exhibit correlation coefficients around 0.260, with statistical significance at the 0.05 level—indicating a positive correlation with price performance.
Commit shows no significant relationship with price change. Its correlation coefficient is -0.032 (close to zero), with a p-value of 0.776 > 0.05, indicating no meaningful correlation with price.
The positive correlations of Star, Fork, Issues, Pull Requests, and Watchers align with our earlier observations—suggesting a modest positive effect. While the correlation magnitude (~0.260) is not strong, it remains meaningful for modeling token price behavior and constructing factor-based strategies. The insignificant result for Commit contrasts slightly with expectations, which we attribute to limited sample size. With larger datasets in the next two periods, we reassess Commit’s relationship with price.
Second Bull Market (2020.3–2021.5): Higher GitHub Activity = Greater Price Gains
Correlation table between six GitHub factors and price returns:

In the second bull market, with sample size increasing from 81 to 330, correlations between all six GitHub factors (Star, Fork, Commit, Issues, Pull Requests, Watchers) and price strengthened significantly, averaging around 0.322—markedly higher than the 0.260 average in the first period—and statistically significant at the 0.01 level. Notably, Star, Commit, and Watchers reached correlations as high as 0.350. All six factors now show positive relationships with price, supporting our hypothesis that the earlier negative Commit correlation was likely due to small sample size and outlier influence.
Second Bear Market (2021.5–Present): GitHub Factors Are Time-Sensitive! Still Significantly Correlated to Price, But Not Necessarily Protective
Correlation table between six GitHub factors and price returns:
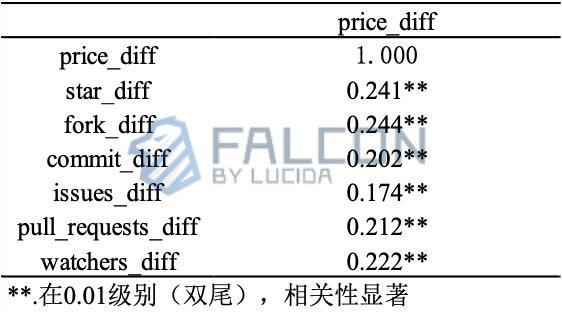
In the third period, with sample size growing to 597, correlations between all six GitHub factors and price remain positive and significant at the 0.01 level, averaging 0.216—slightly higher than the first bear market (0.205), but notably weaker than the second bull market (0.322).
We conclude that all six GitHub factors positively correlate with price returns, but their influence is time-sensitive!
That is, GitHub activity has stronger predictive power and contribution during bull markets, but weaker effectiveness in bear markets. In downturns, price movements are influenced more heavily by other factors—such as technical indicators, market sentiment, and alternative data—while GitHub metrics serve only as part of fundamental analysis, with relatively limited impact.
Article Conclusion
Based on the above analysis, Falcon summarizes the key takeaways:
1. As the crypto market matures and developer ecosystems grow richer, GitHub activity shows increasingly strong correlation with token prices.
2. From an investment standpoint, prioritize projects with active GitHub development and avoid those with stagnant repositories.
3. In bull markets, higher GitHub activity correlates with greater price gains; in bear markets, it correlates with relatively better downside resilience.
4. The correlation between GitHub activity and token prices is significantly stronger in bull markets than in bear markets.
Join TechFlow official community to stay tuned
Telegram:https://t.me/TechFlowDaily
X (Twitter):https://x.com/TechFlowPost
X (Twitter) EN:https://x.com/BlockFlow_News
 @lucidafund